Copyright
©The Author(s) 2020.
World J Clin Cases. Jun 6, 2020; 8(11): 2190-2200
Published online Jun 6, 2020. doi: 10.12998/wjcc.v8.i11.2190
Published online Jun 6, 2020. doi: 10.12998/wjcc.v8.i11.2190
Figure 1 Immunochemical staining of claudin 7.
A: Immunochemical staining of claudin 7 in normal colorectal tissue; B: Immunochemical staining of claudin 7 in cancer tissue.
Figure 2 Comparison of claudin 7 expression in colorectal cancer tissues and normal tissues (P < 0.
001). N/W: Negative/weak expression; M: Moderate expression; S: Strong expression.
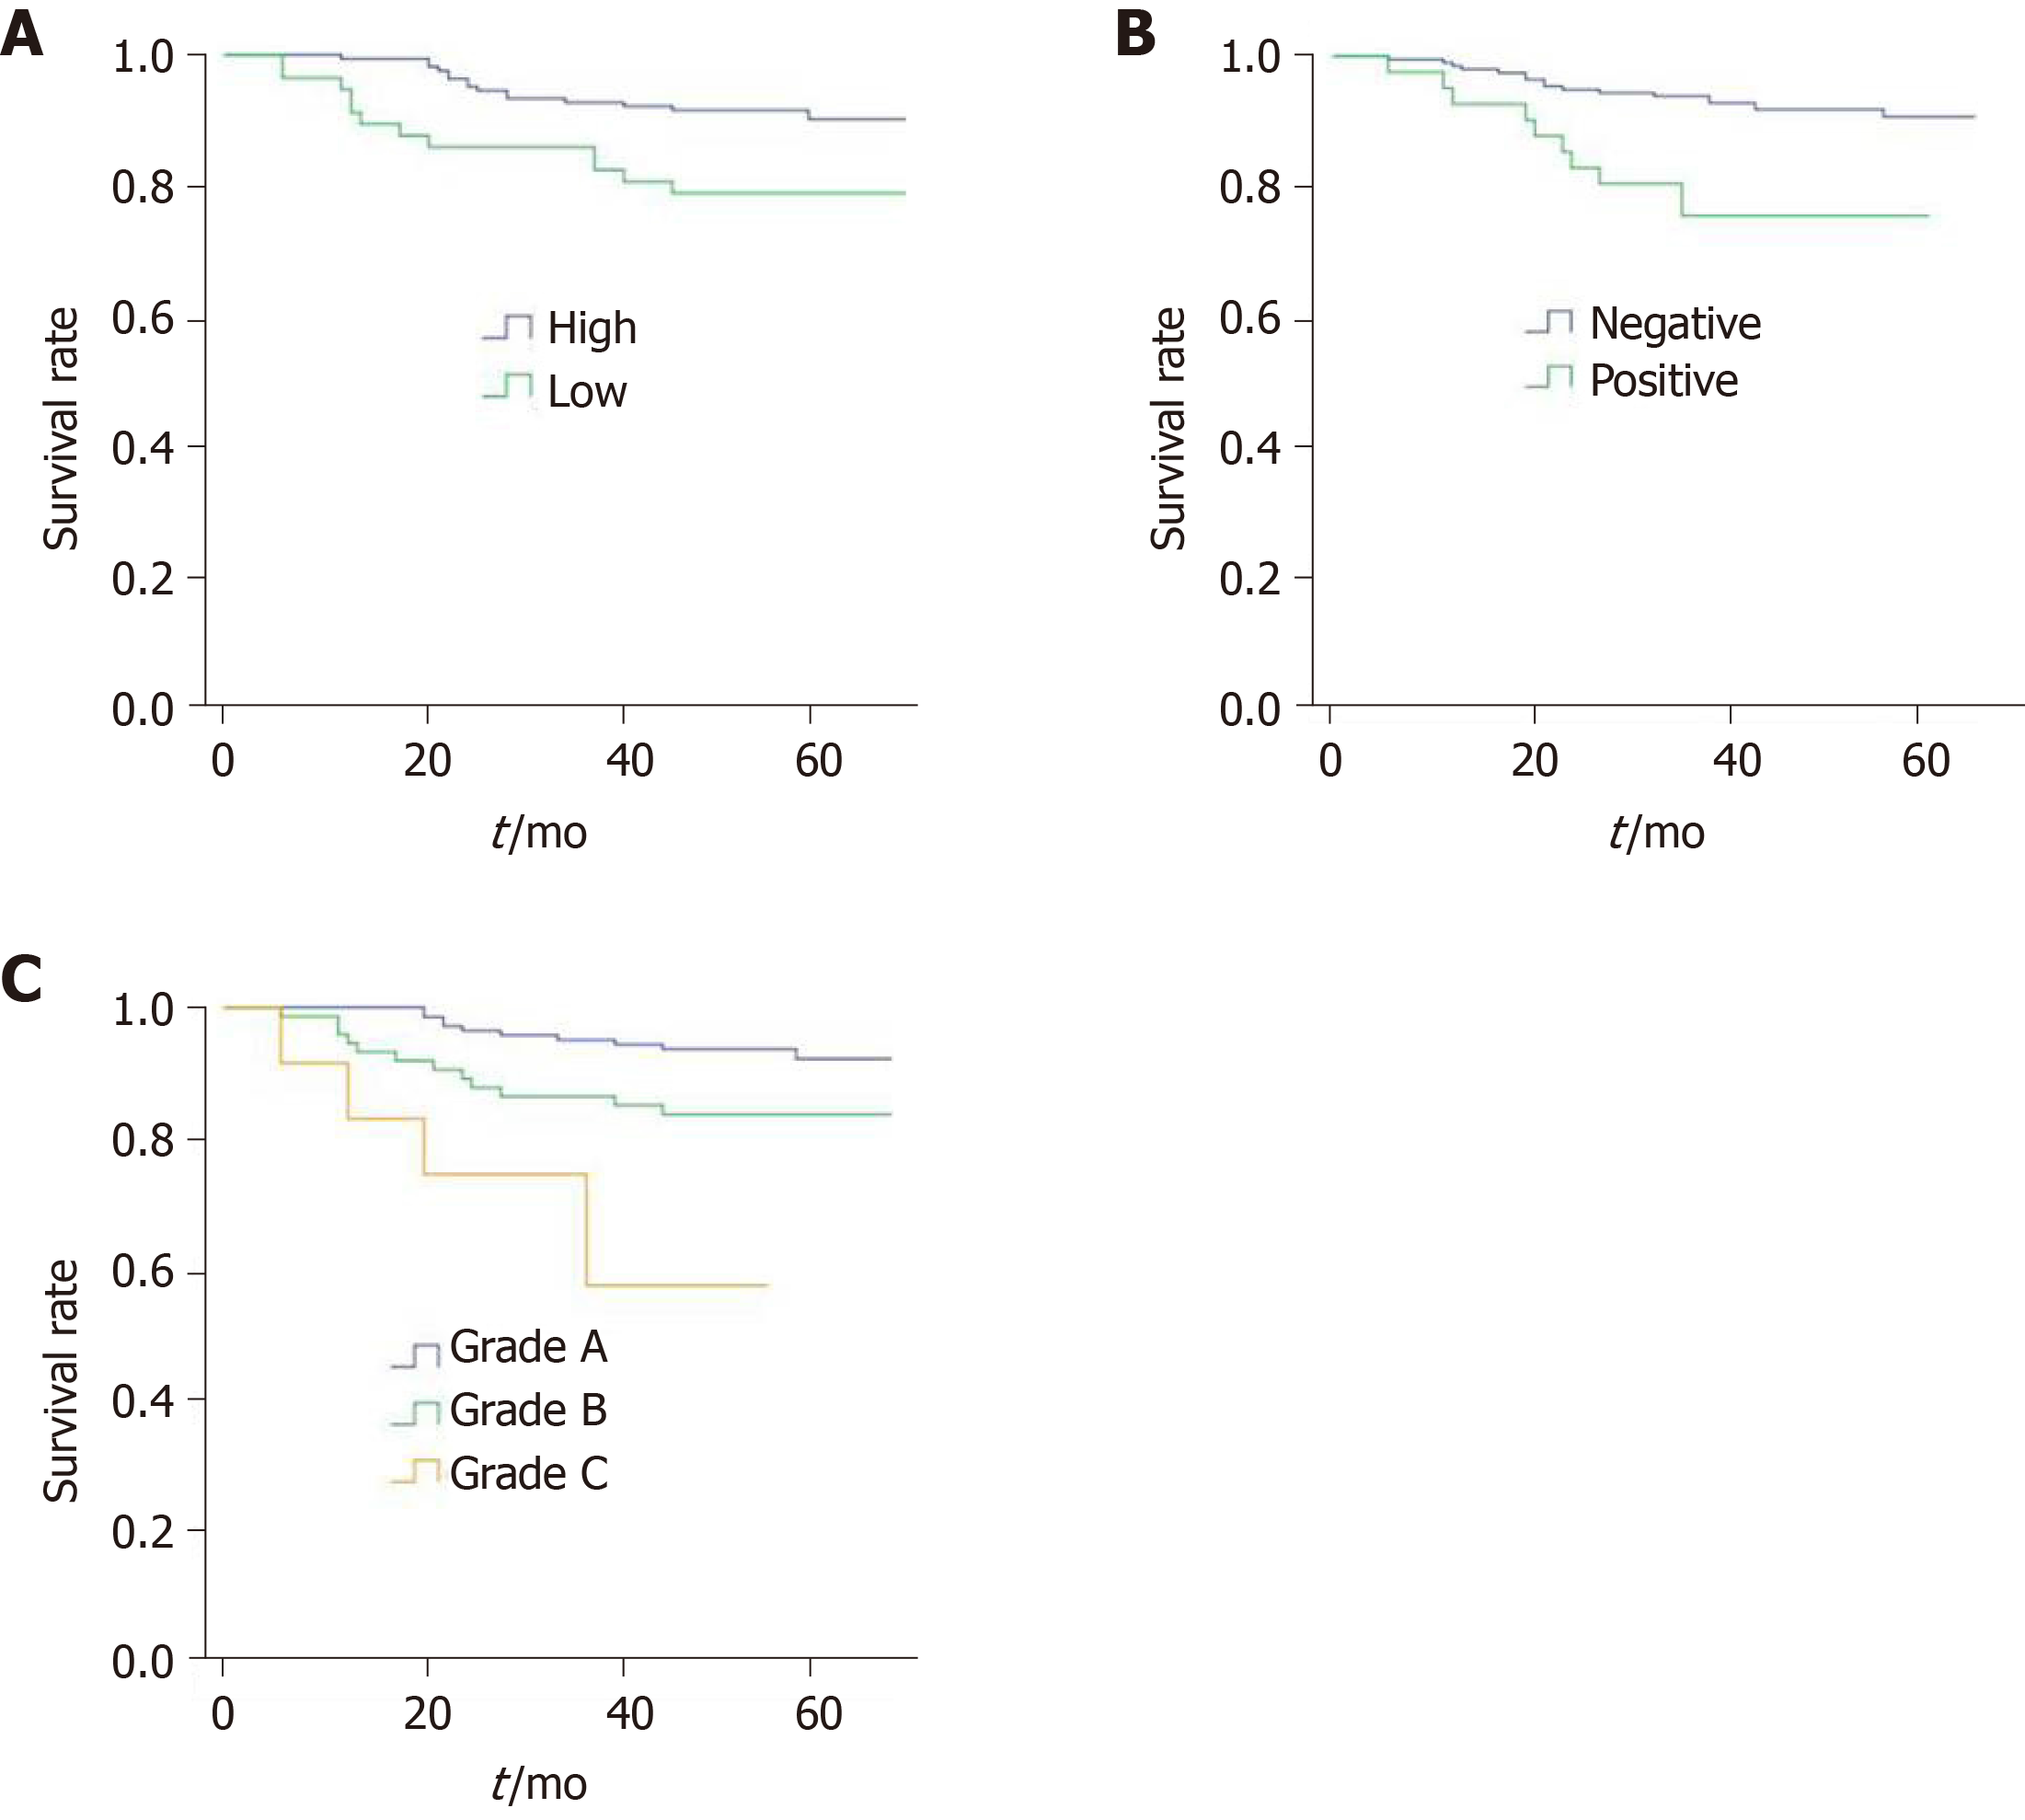
Figure 3 Kaplan-Meier curves for disease-free survival.
A: Kaplan-Meier survival curves for patients with high and low claudin 7 expression (P = 0.011, log-rank test); B: Kaplan-Meier survival curves for patients with or without perineural invasion (P = 0.002, log-rank test); C: Kaplan-Meier survival curves for patients with different prognostic grades (P < 0.001, log-rank test).
- Citation: Quan JC, Peng J, Guan X, Liu Z, Jiang Z, Chen HP, Zhuang M, Wang S, Sun P, Wang HY, Zou SM, Wang XS. Evaluation of clinical significance of claudin 7 and construction of prognostic grading system for stage II colorectal cancer. World J Clin Cases 2020; 8(11): 2190-2200
- URL: https://www.wjgnet.com/2307-8960/full/v8/i11/2190.htm
- DOI: https://dx.doi.org/10.12998/wjcc.v8.i11.2190


