Copyright
©The Author(s) 2020.
World J Clin Cases. Jan 6, 2020; 8(1): 11-19
Published online Jan 6, 2020. doi: 10.12998/wjcc.v8.i1.11
Published online Jan 6, 2020. doi: 10.12998/wjcc.v8.i1.11
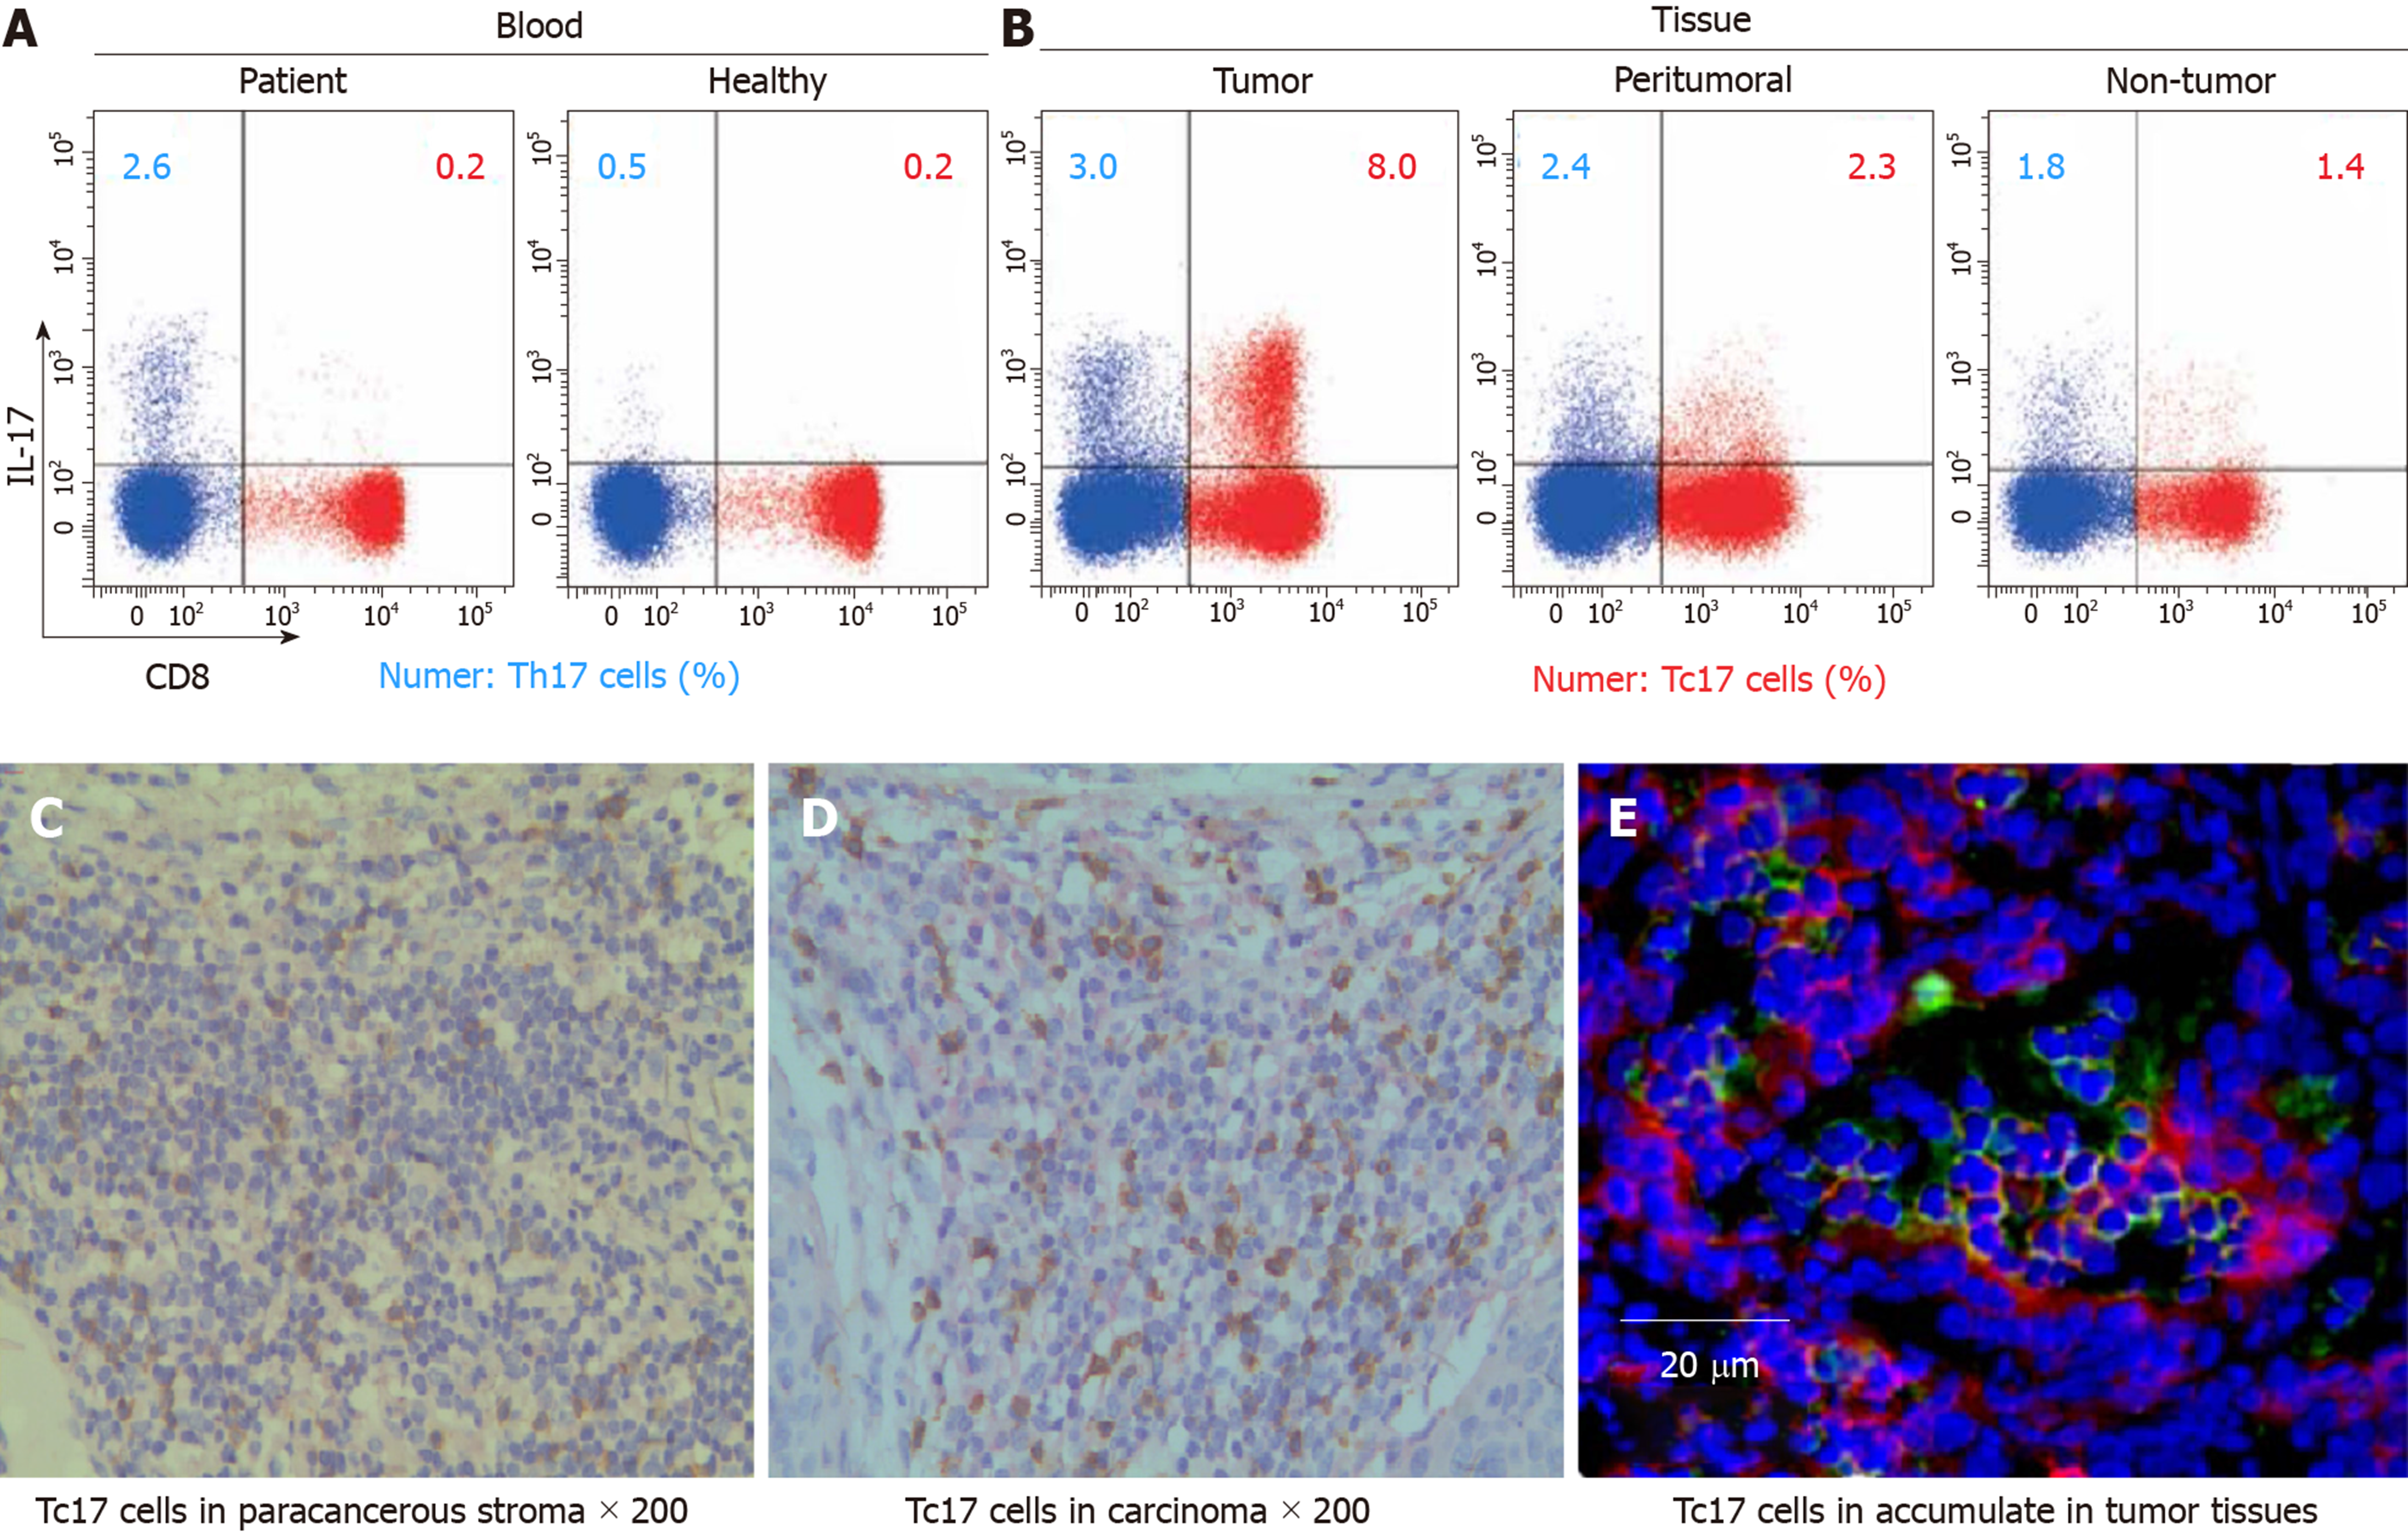
Figure 1 Tc17 cells accumulate in tumor tissues of cervical cancer patients.
A, B: Dot plots of intracellular cytokine staining for Tc17 and Th17 in tumor cells; C: Immunohistochemistry staining for interleukin (IL)-17+ Tc17 cells in paracancerous stroma, the brown signal represents staining of IL-17, and the red signal represents staining of Tc17 (Envision, ×200); D: Immunohistochemistry staining for IL-17+ Tc17 cells in carcinoma nets, the brown signal represents staining of IL-17, and the red signal represents staining of Tc17 (Envision, ×200); E: Immunofluorescence staining for intra-tumoral IL-17+ Tc17 cells, the green signal represents staining of IL-17, the red signal represents staining of Tc17, and the blue signal represents DAPI-stained nuclei (scale bar, 20 μm). IL: Interleukin.
Figure 2 Interleukin-6, interleukin-1β, and interleukin-23 accumulated in tumor tissues of cervical cancer patients.
A-C: Before cell suspension culture, ELISA was carried out to show that interleukin (IL)-6, IL-1β, and IL-23 were significantly upregulated in the supernatants of tumor and peritumoral tumor tissues compared with the supernatants isolated from autologous non-tumor tissues or peripheral blood. Comparisons were performed using the t-test. aP < 0.05; bP < 0.01. cP < 0.001. Error bars represent SE. IL: Interleukin.
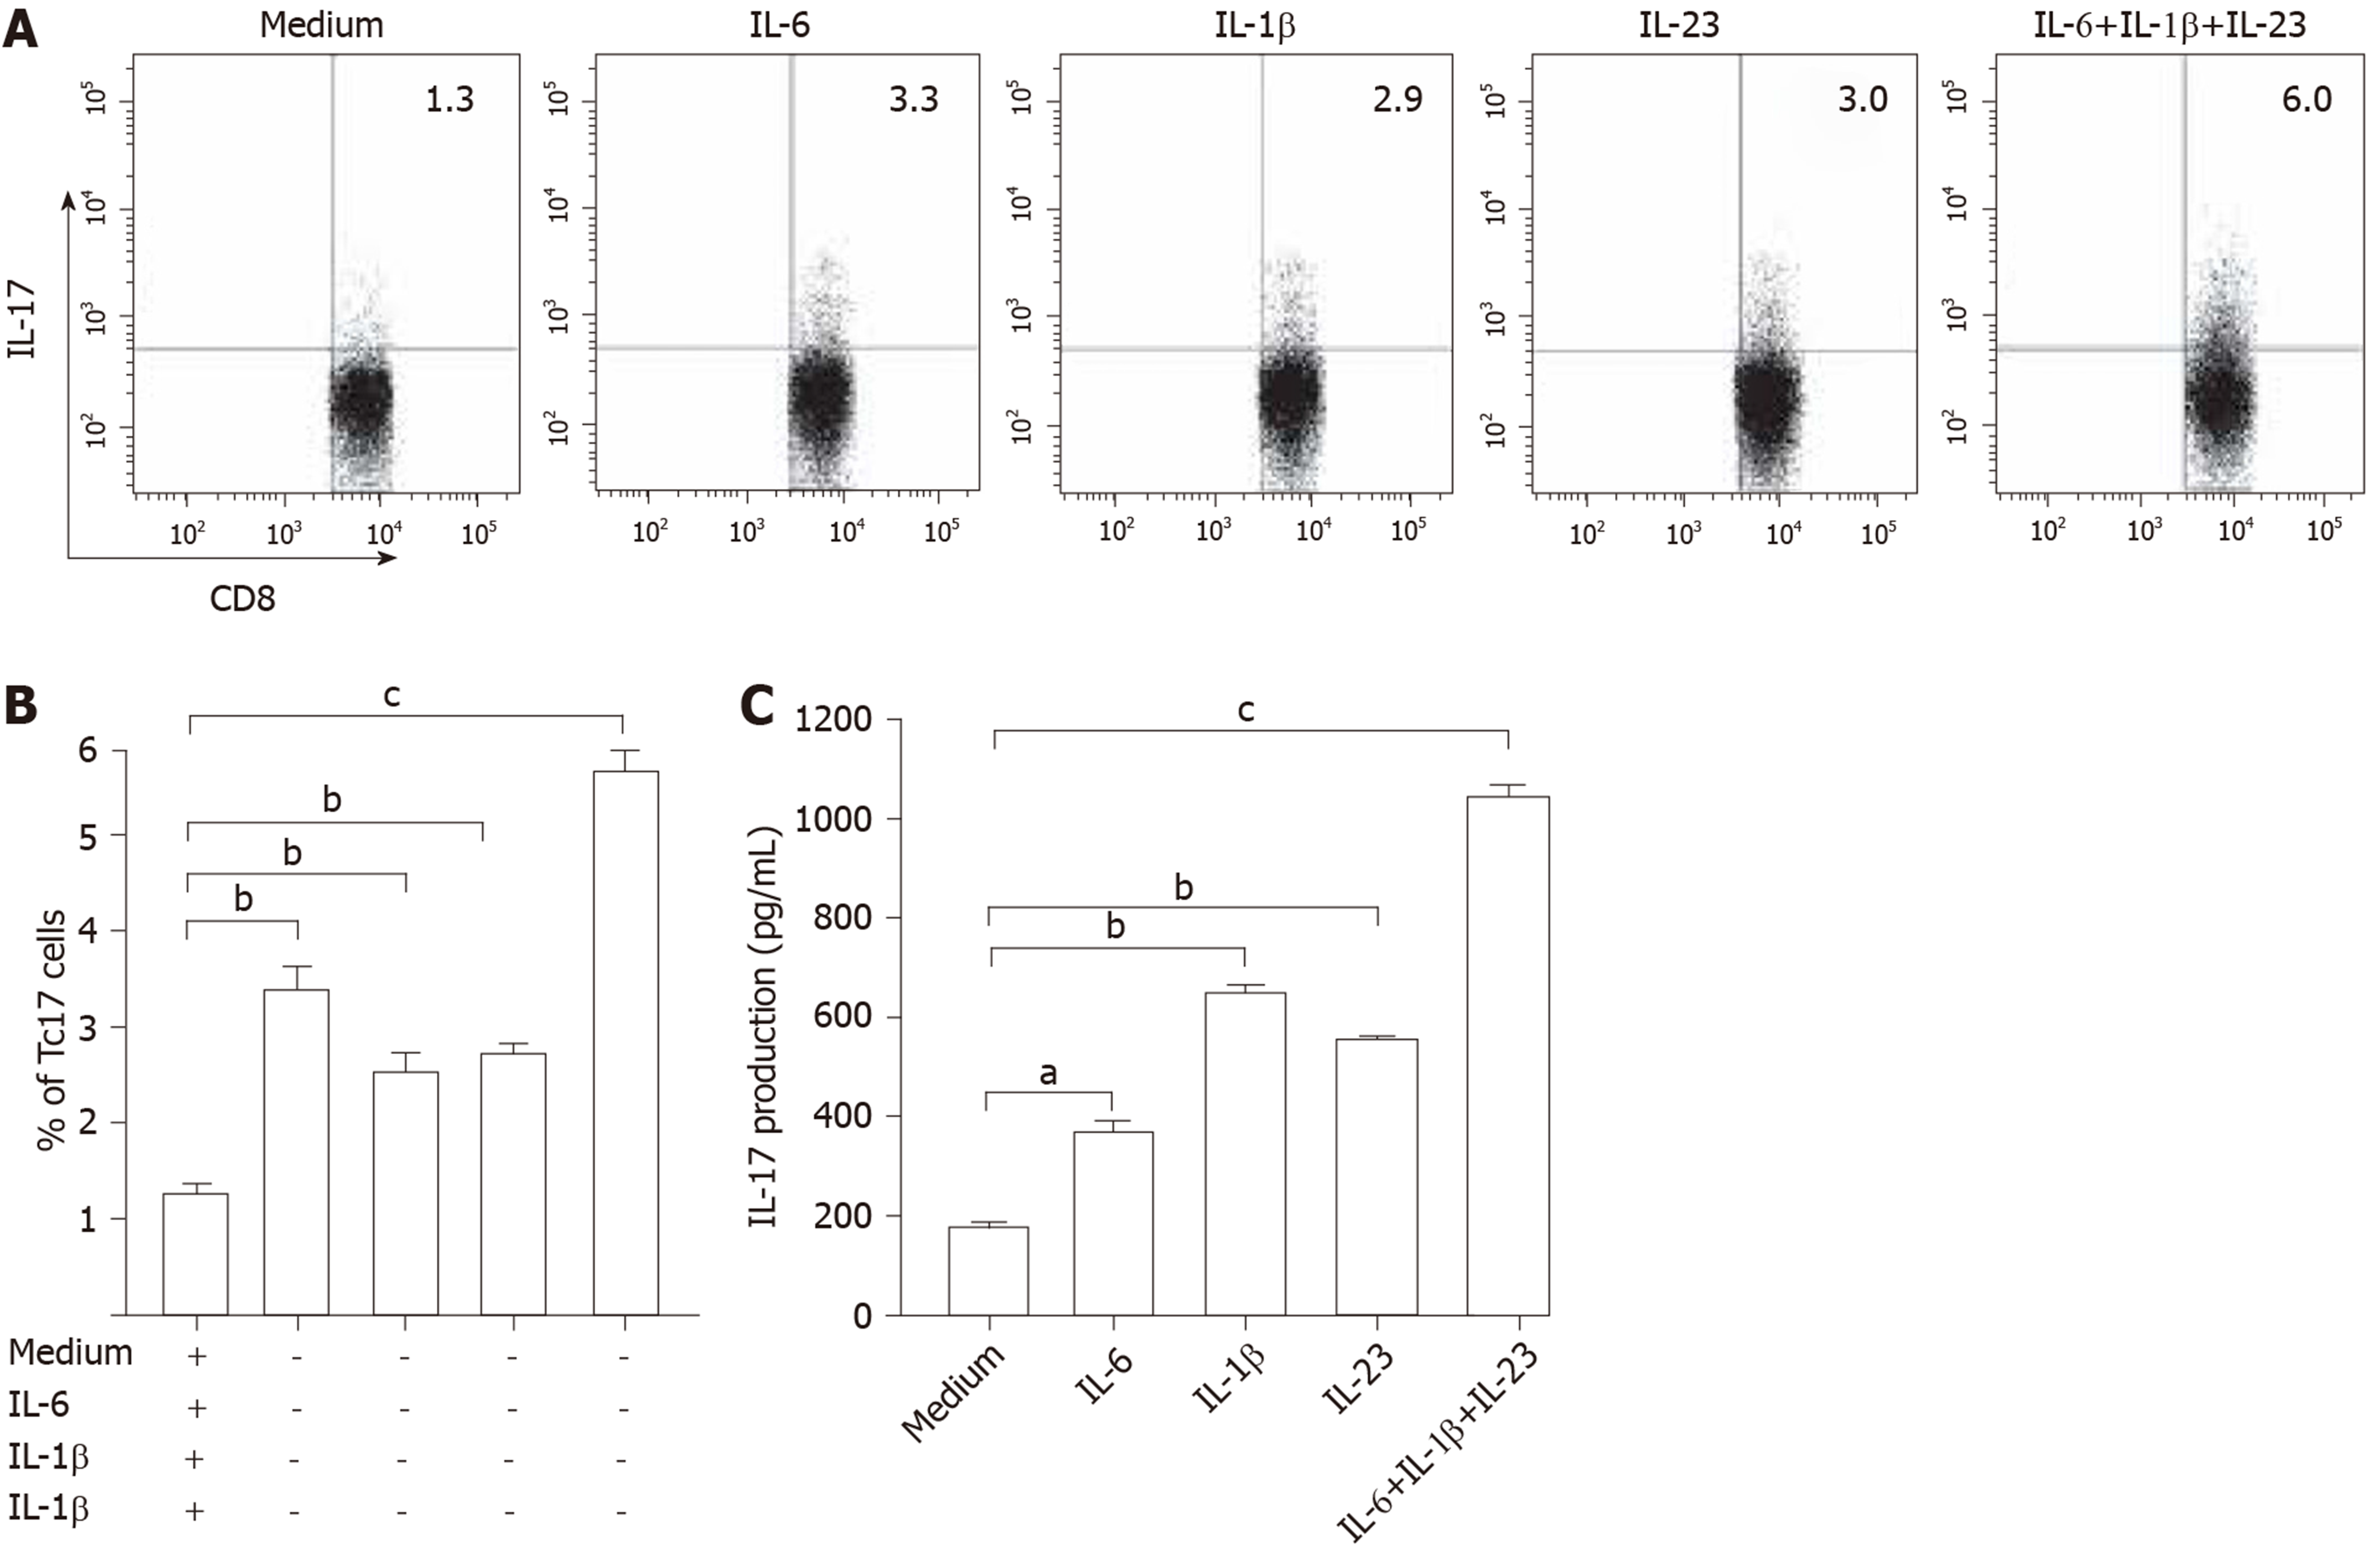
Figure 3 Interleukin-6, interleukin-1β, and interleukin-23 induced differentiation of Tc17 cells.
A-C: Peripheral CD8+ T cells and blood monocytes were co-cultured as described in Materials and Methods. Representative data and statistical analysis of Tc17 cell percentage in CD8+ T cells and interleukin-17 production in the culture supernatants from the co-culture systems. Comparisons were performed using the t-test. aP < 0.05, bP < 0.01, cP < 0.001. Error bars represent SE. IL: Interleukin.
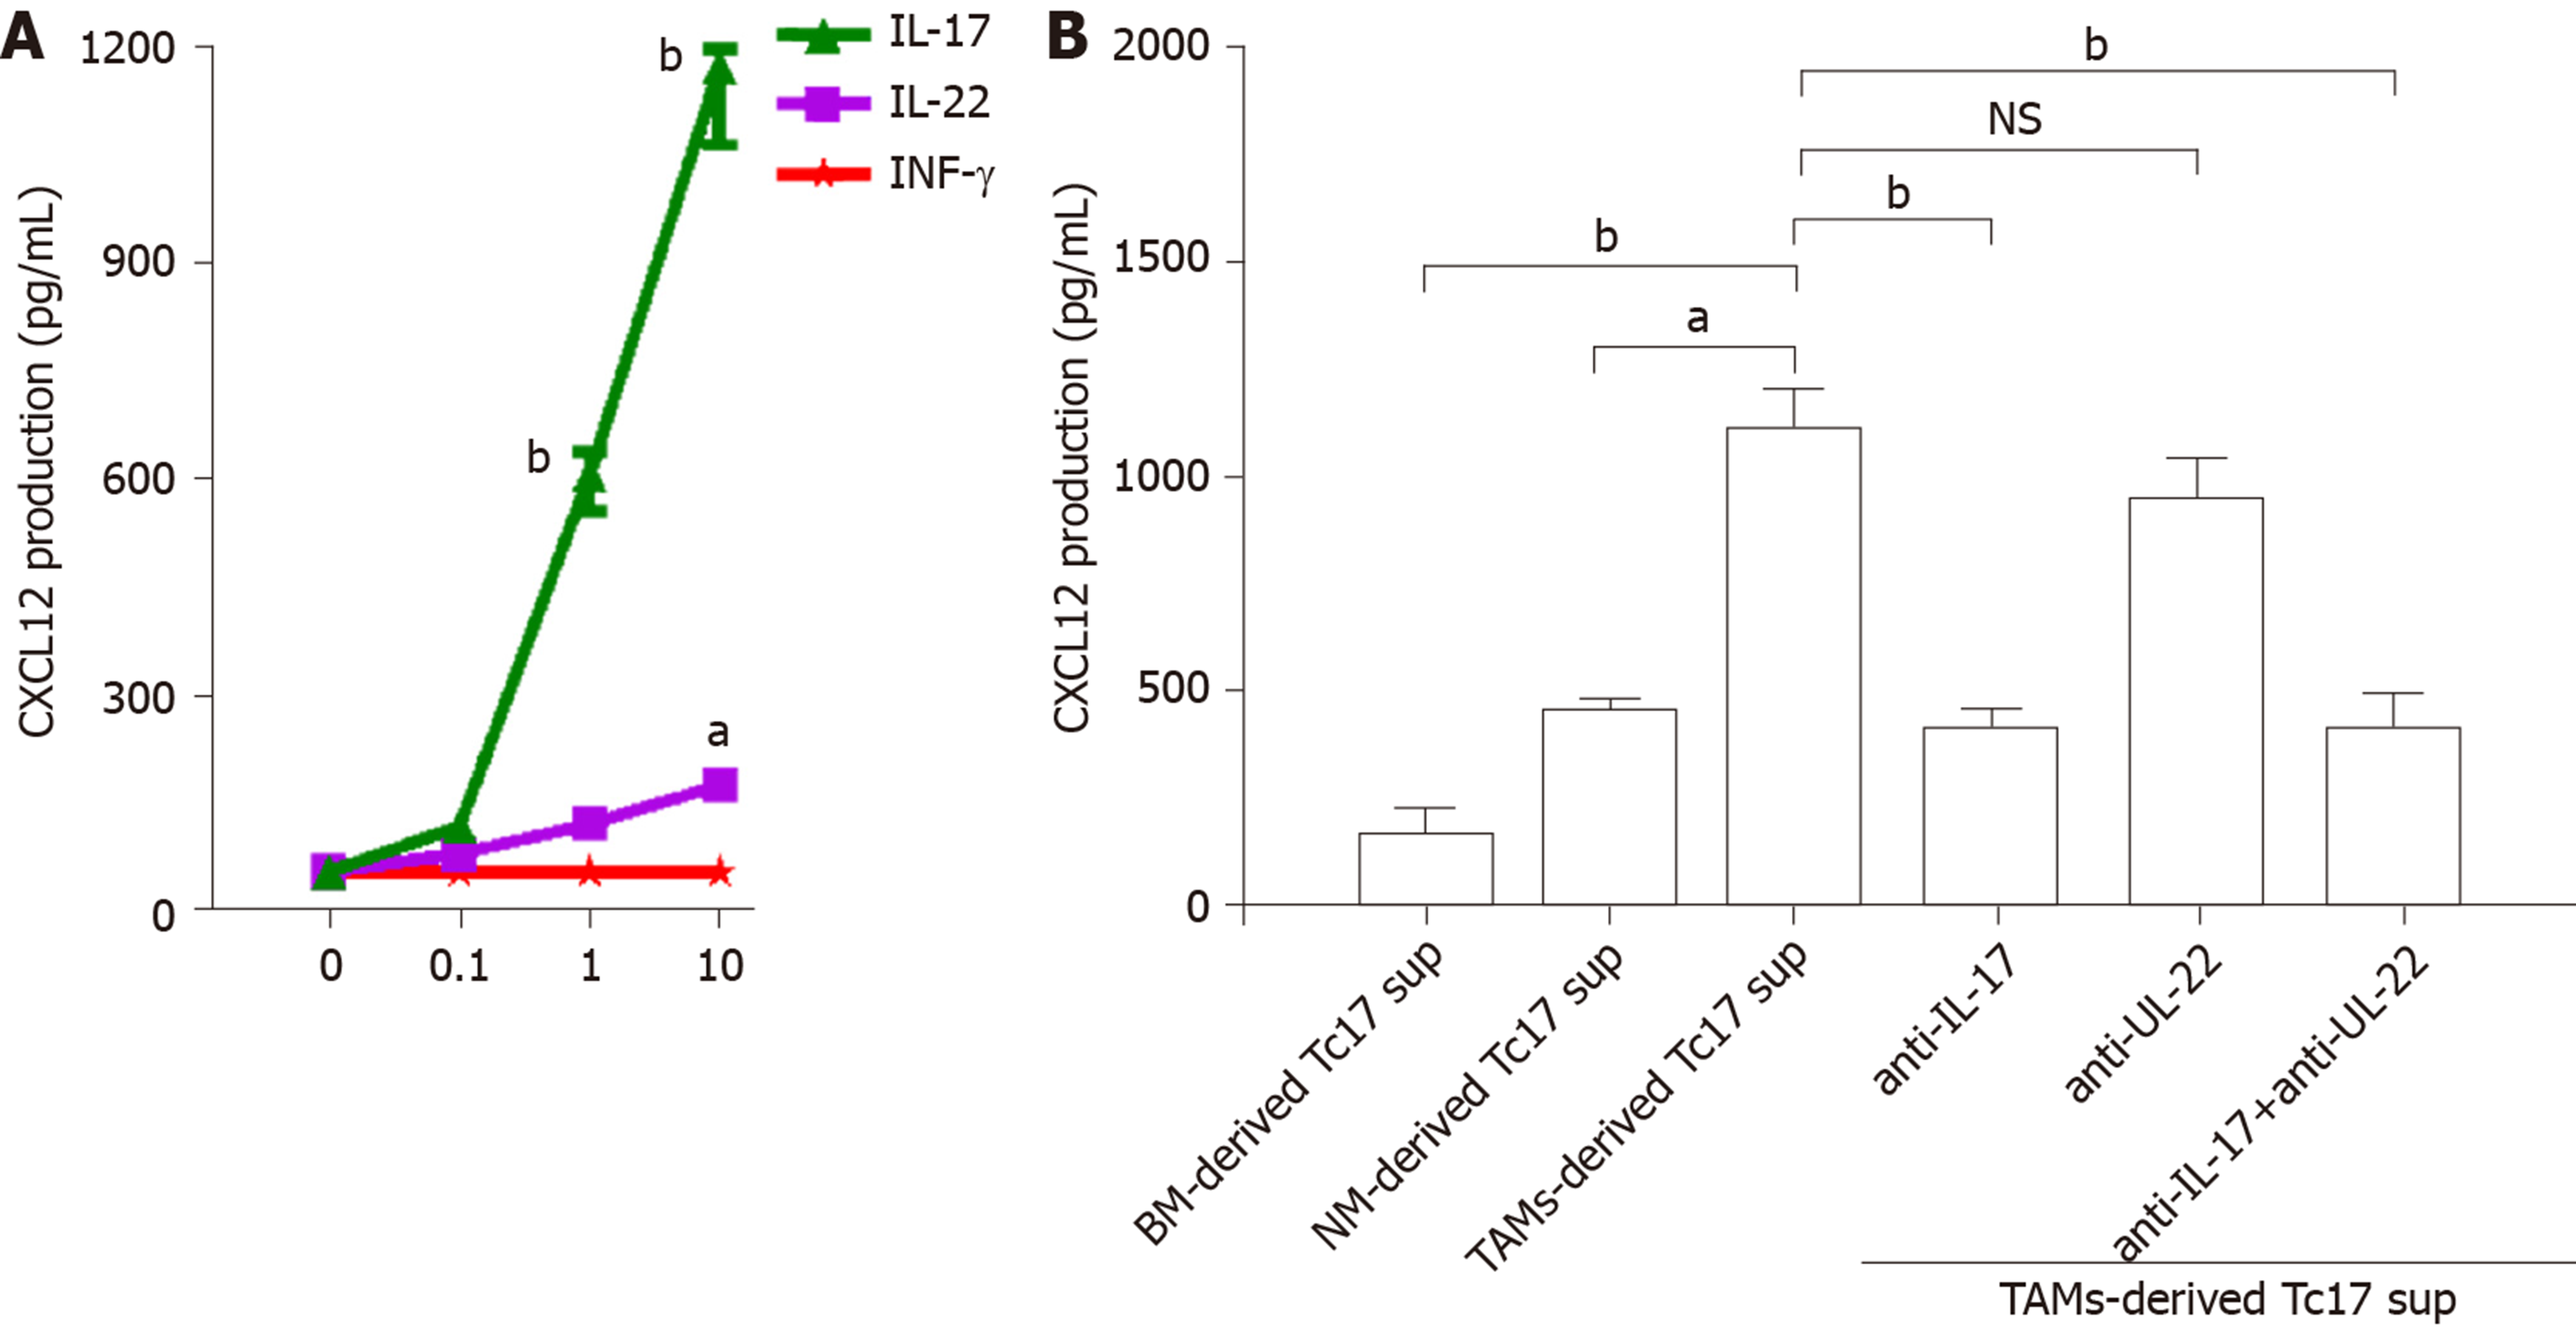
Figure 4 Tc17 cell-derived interleukin-17 induces tumor cells to produce CXCL12.
A: Primary tumor cells were cultured with various concentrations of interleukin (IL)-17, IL-22, interferon-γ, and the production of CXC12 was detected in the culture supernatants by ELISA and statistically analyzed; B: Primary tumor cells were cultured with various concentrations of cytokines or monocyte-derived Tc17 cells culture supernatants, and the production of CXC12 was detected in the culture supernatants by ELISA and statistically analyzed. Comparisons were performed using the t-test. aP < 0.05; bP < 0.01. Error bars represent SE. NS: No significant difference; NM: Non-tumor tissue monocyte-derived; BM: Blood monocyte-derived; TAMs: Tumor tissue monocyte-derived.
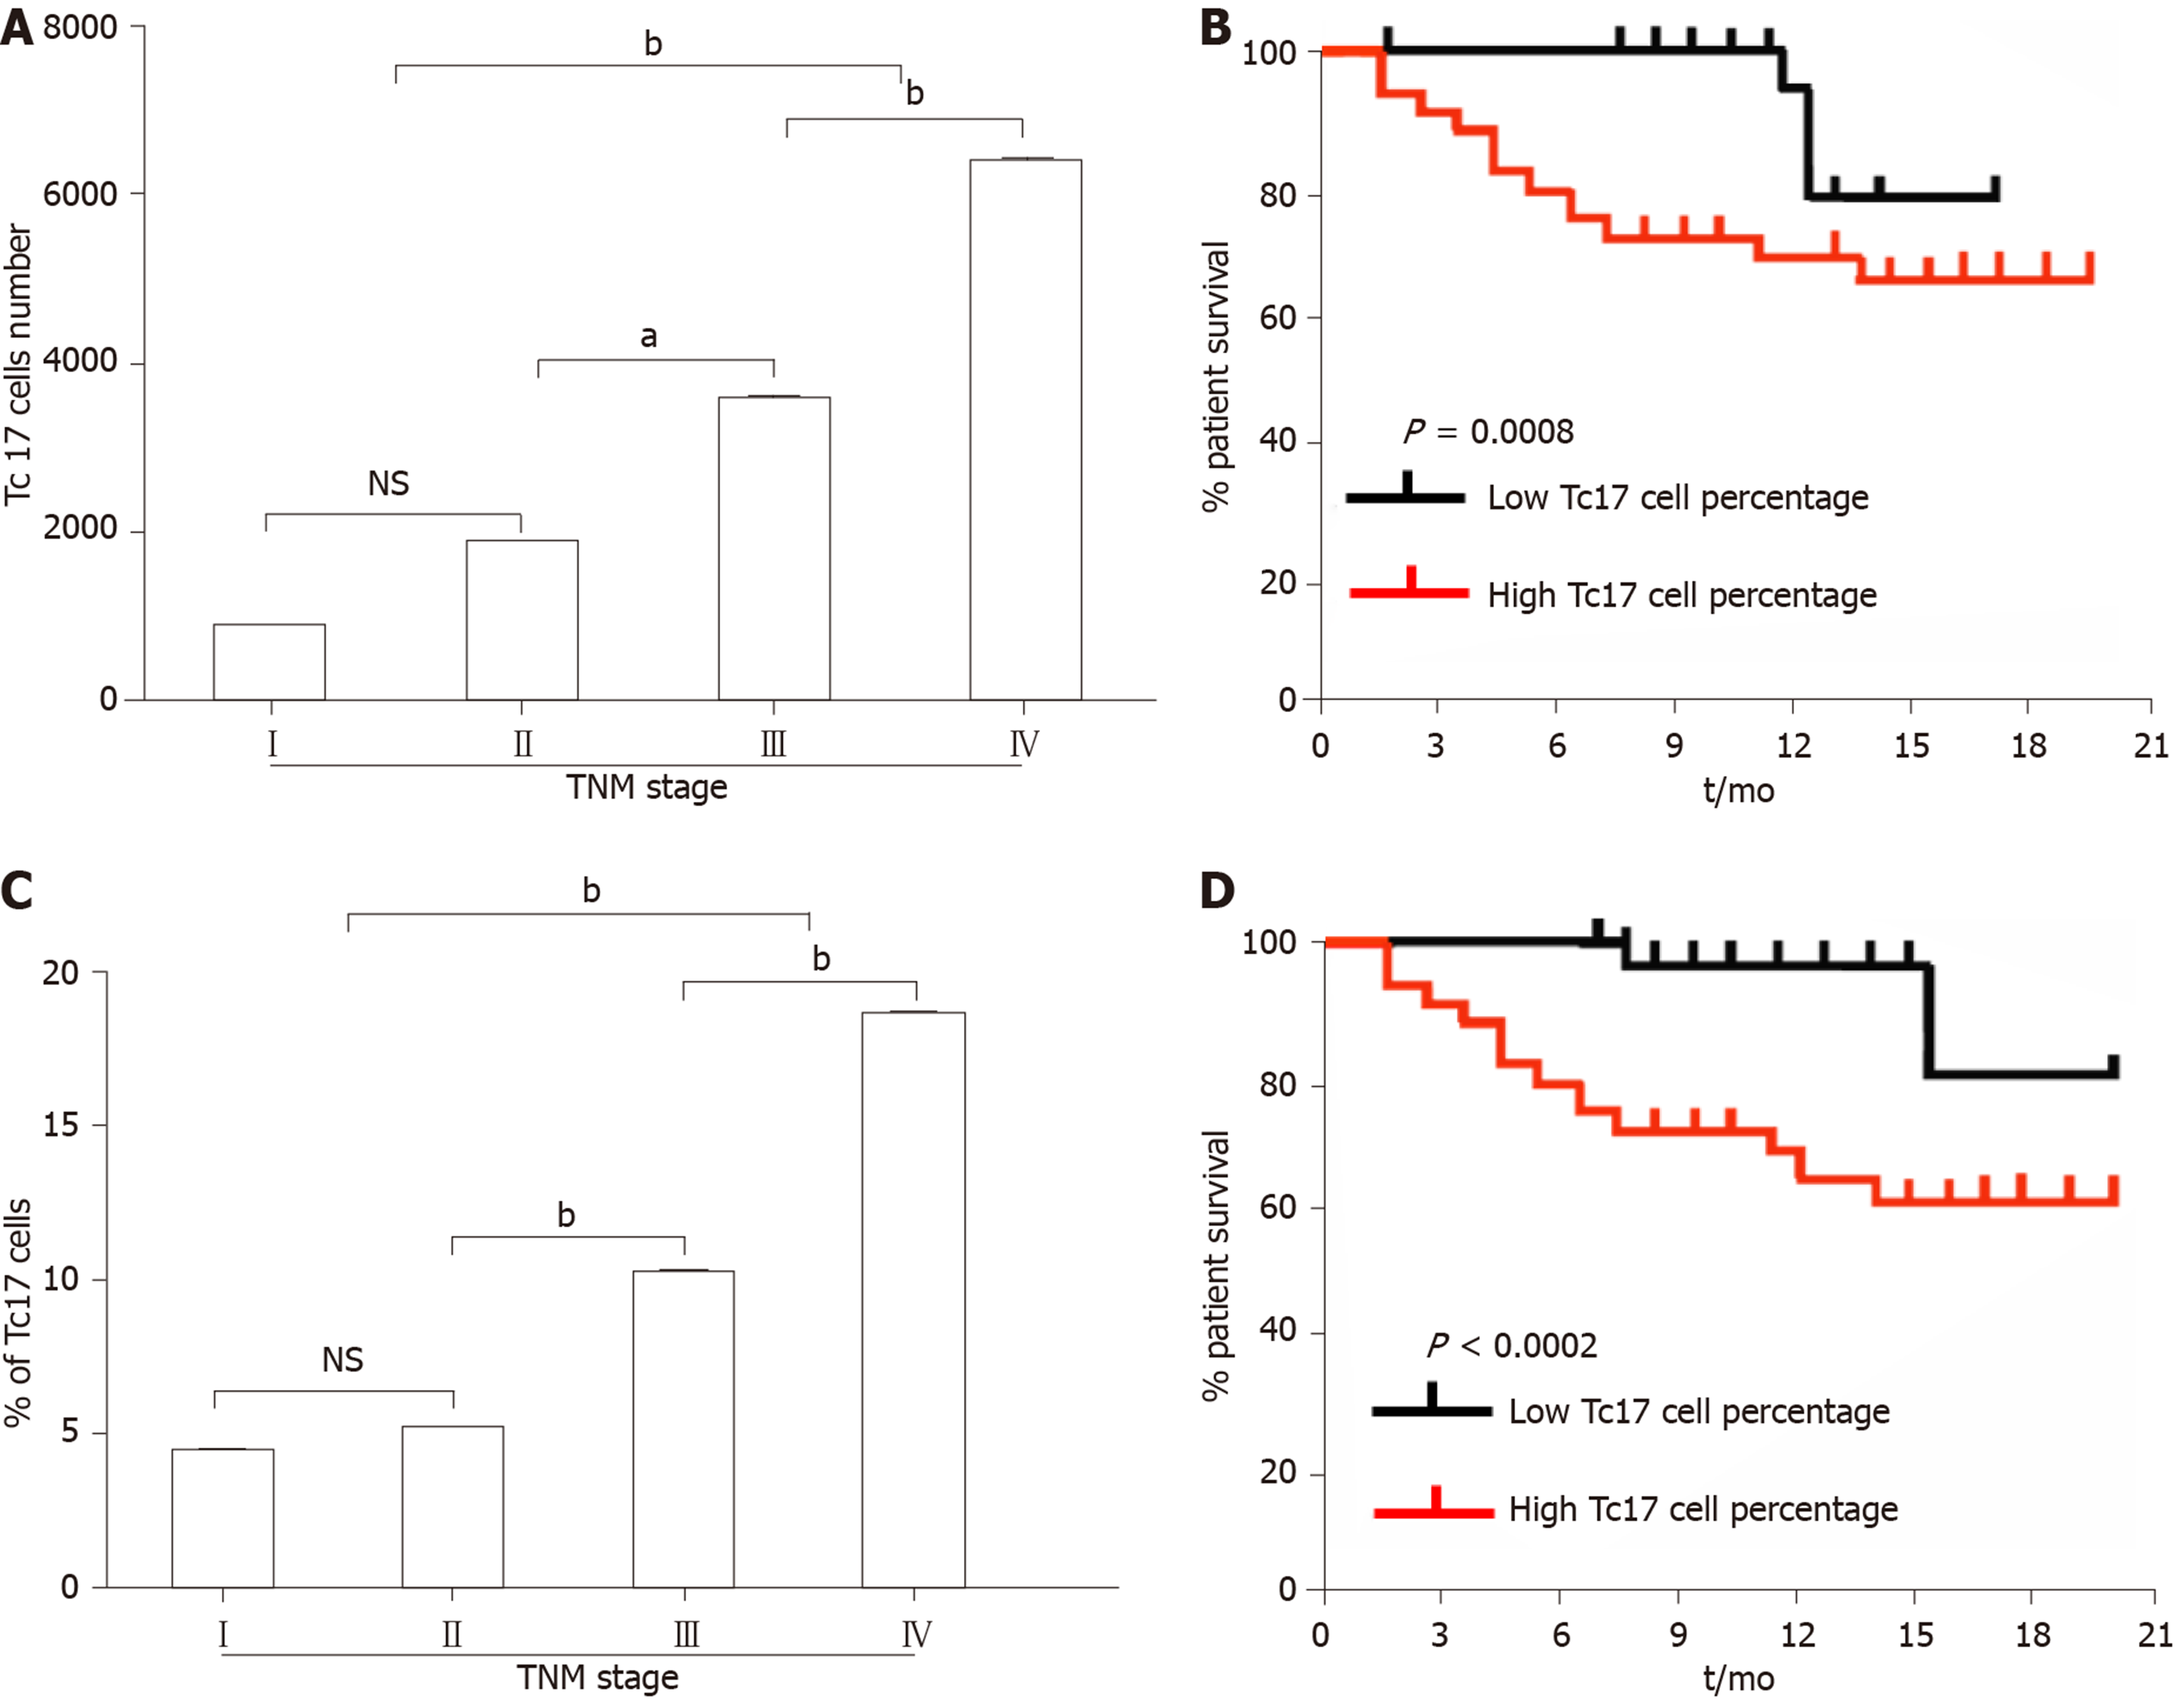
Figure 5 Analysis of the correlation between the percentage of Tc17 cells and the survival rate of cervical cancer patients.
A: The total number of Tc17 cells per million total cells in each tissue in different TNM stage; B: The association between Tc17 cell number and patient survival times; C: Tc17 cell percentage in CD8+ T cells in each stage of cancer progression; D: Survival significantly decreased as a function of Tc17 cell percentage. Comparisons were performed using the t-test. NS indicates no significant difference; aP < 0.05; bP < 0.01. Error bars represent SE.
- Citation: Zhang ZS, Gu Y, Liu BG, Tang H, Hua Y, Wang J. Oncogenic role of Tc17 cells in cervical cancer development. World J Clin Cases 2020; 8(1): 11-19
- URL: https://www.wjgnet.com/2307-8960/full/v8/i1/11.htm
- DOI: https://dx.doi.org/10.12998/wjcc.v8.i1.11


