Copyright
©The Author(s) 2019.
World J Clin Cases. Apr 26, 2019; 7(8): 961-971
Published online Apr 26, 2019. doi: 10.12998/wjcc.v7.i8.961
Published online Apr 26, 2019. doi: 10.12998/wjcc.v7.i8.961
Figure 1 Abdominal computed tomography images.
Abdominal computed tomography images show bilateral adrenal adenomas with atrophic adrenal glands. Arrows indicate tumors with a low density (right, 3.1 cm × 2.0 cm × 1.9 cm; left, 2.2 cm × 1.9 cm × 2.1 cm). Tumors are homogeneously enhanced in the presence of contrast material.
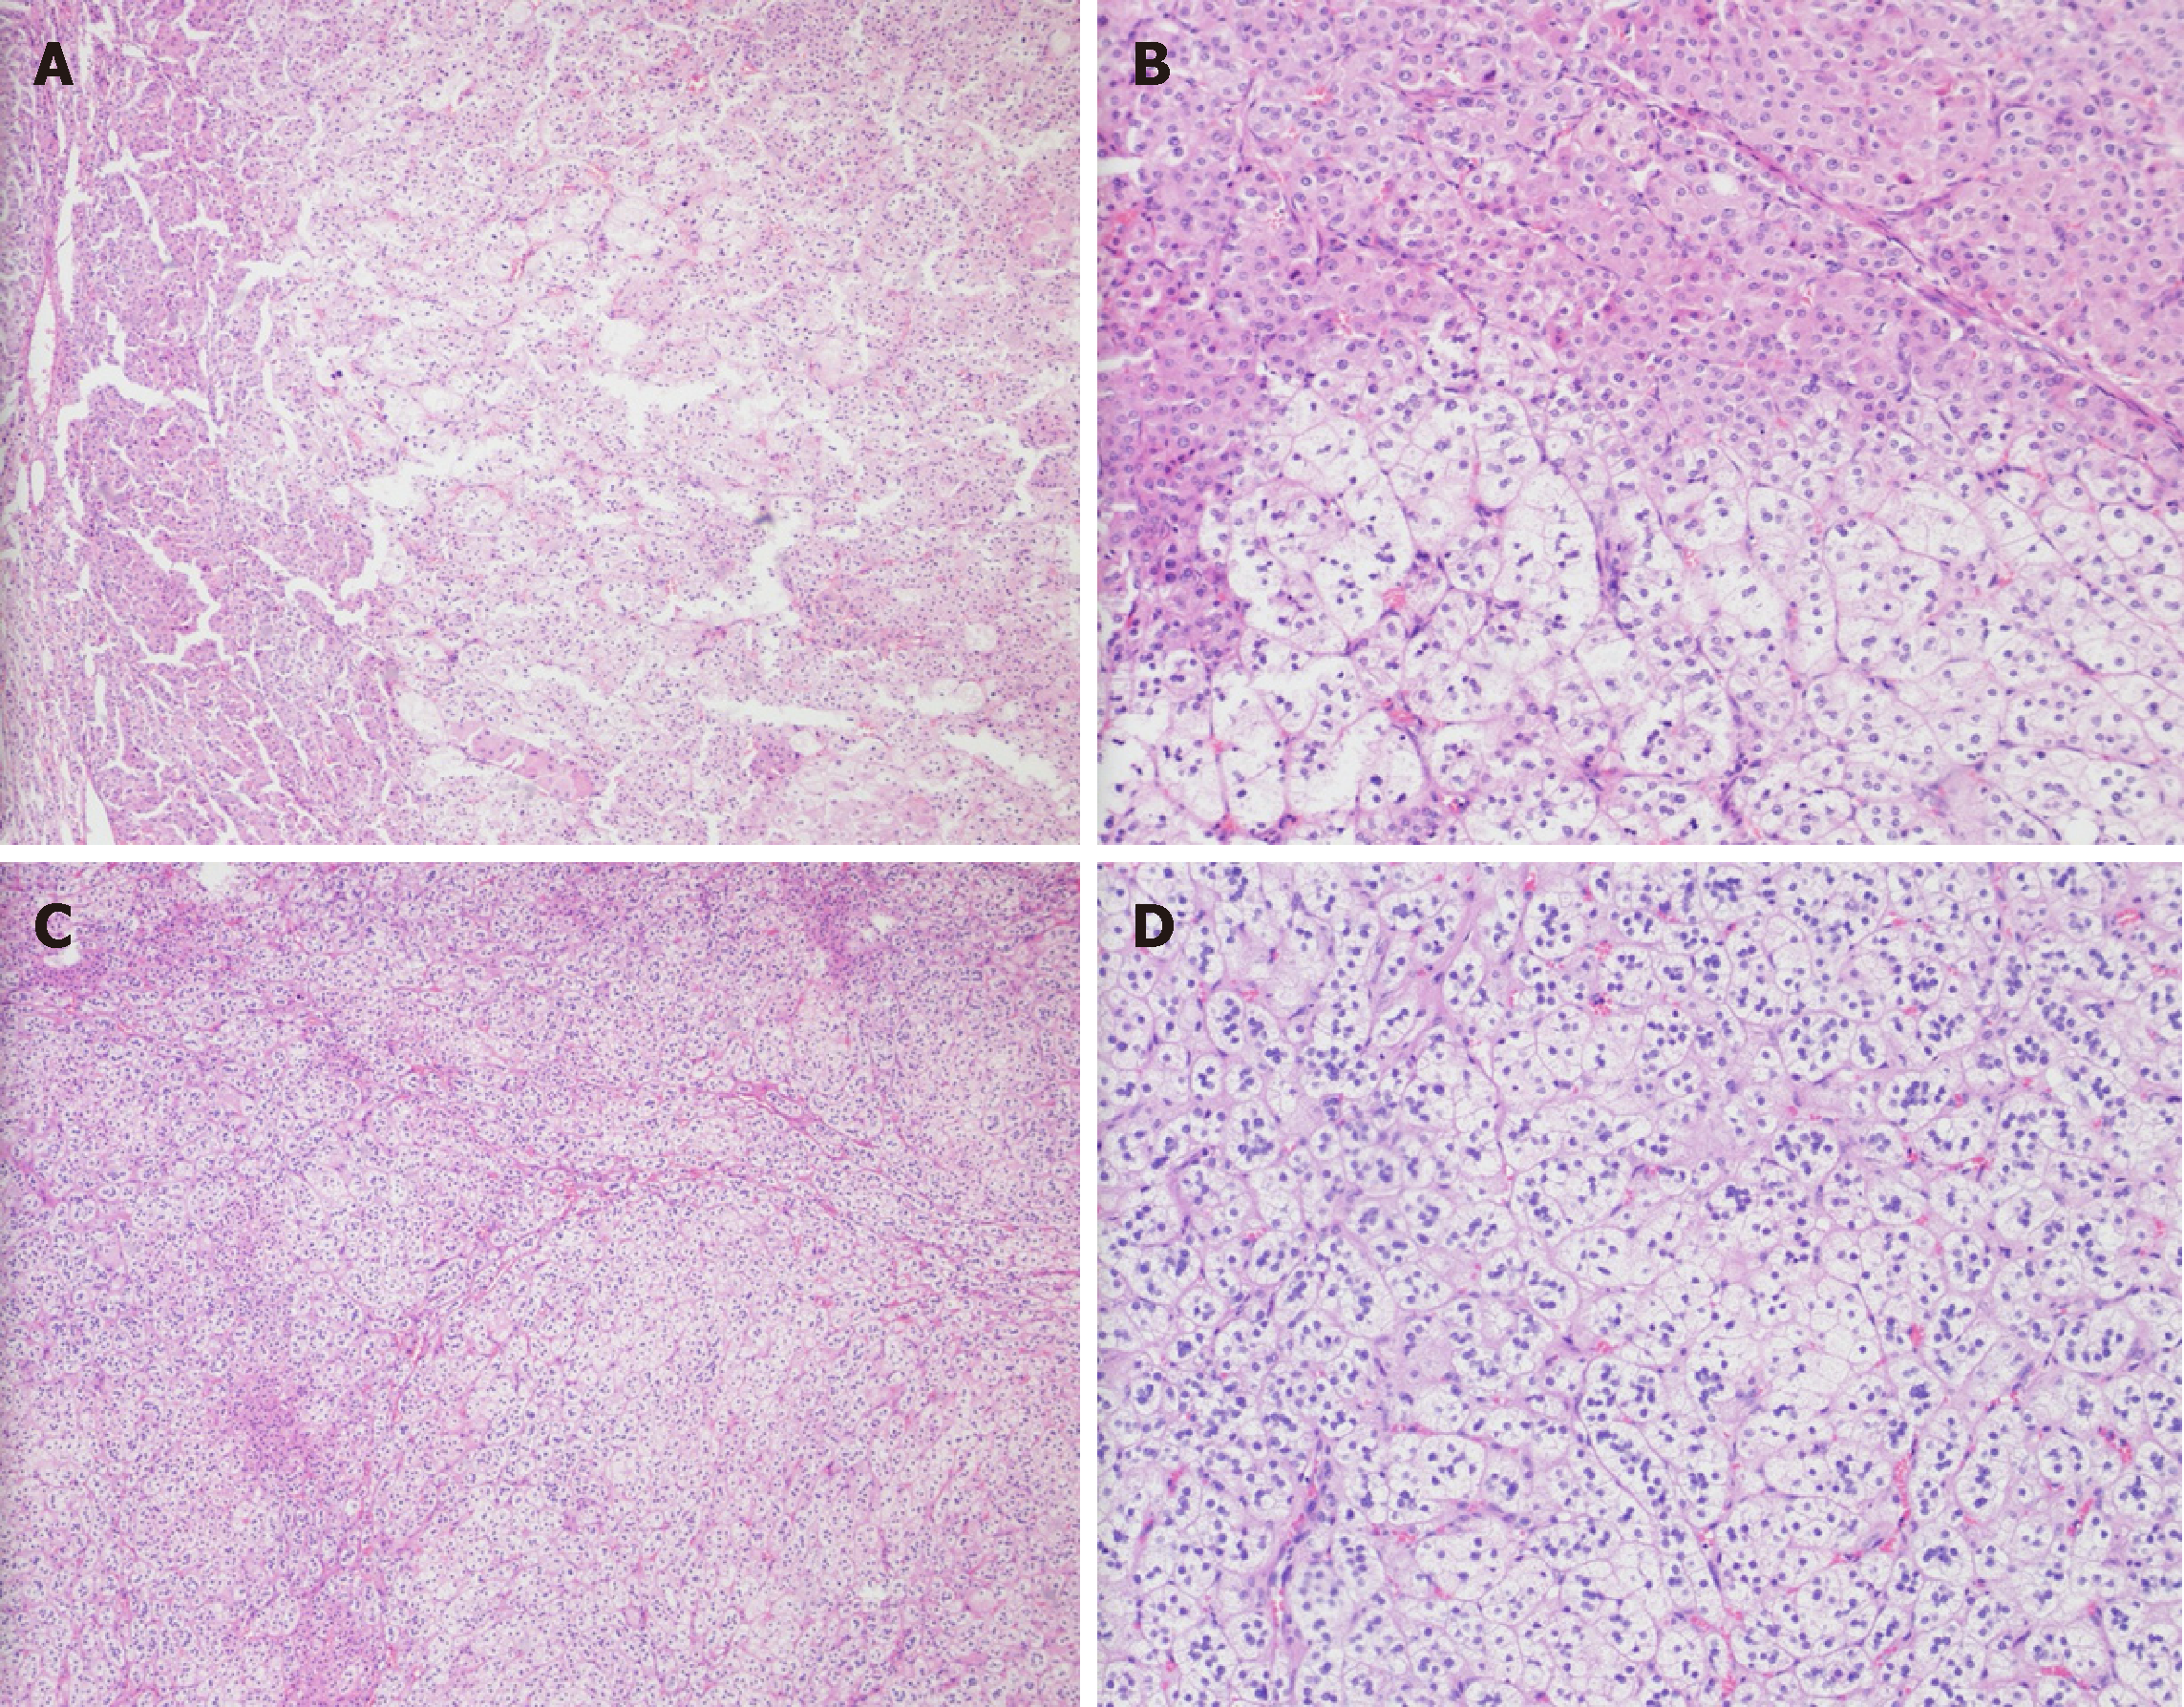
Figure 2 Histological characteristics of the adenomas (Hematoxylin-eosin staining).
A-D: The left (A: ×40, B: ×100) and right (C: ×40, D: ×100) adenomas comprised both clear cells and compact cells.
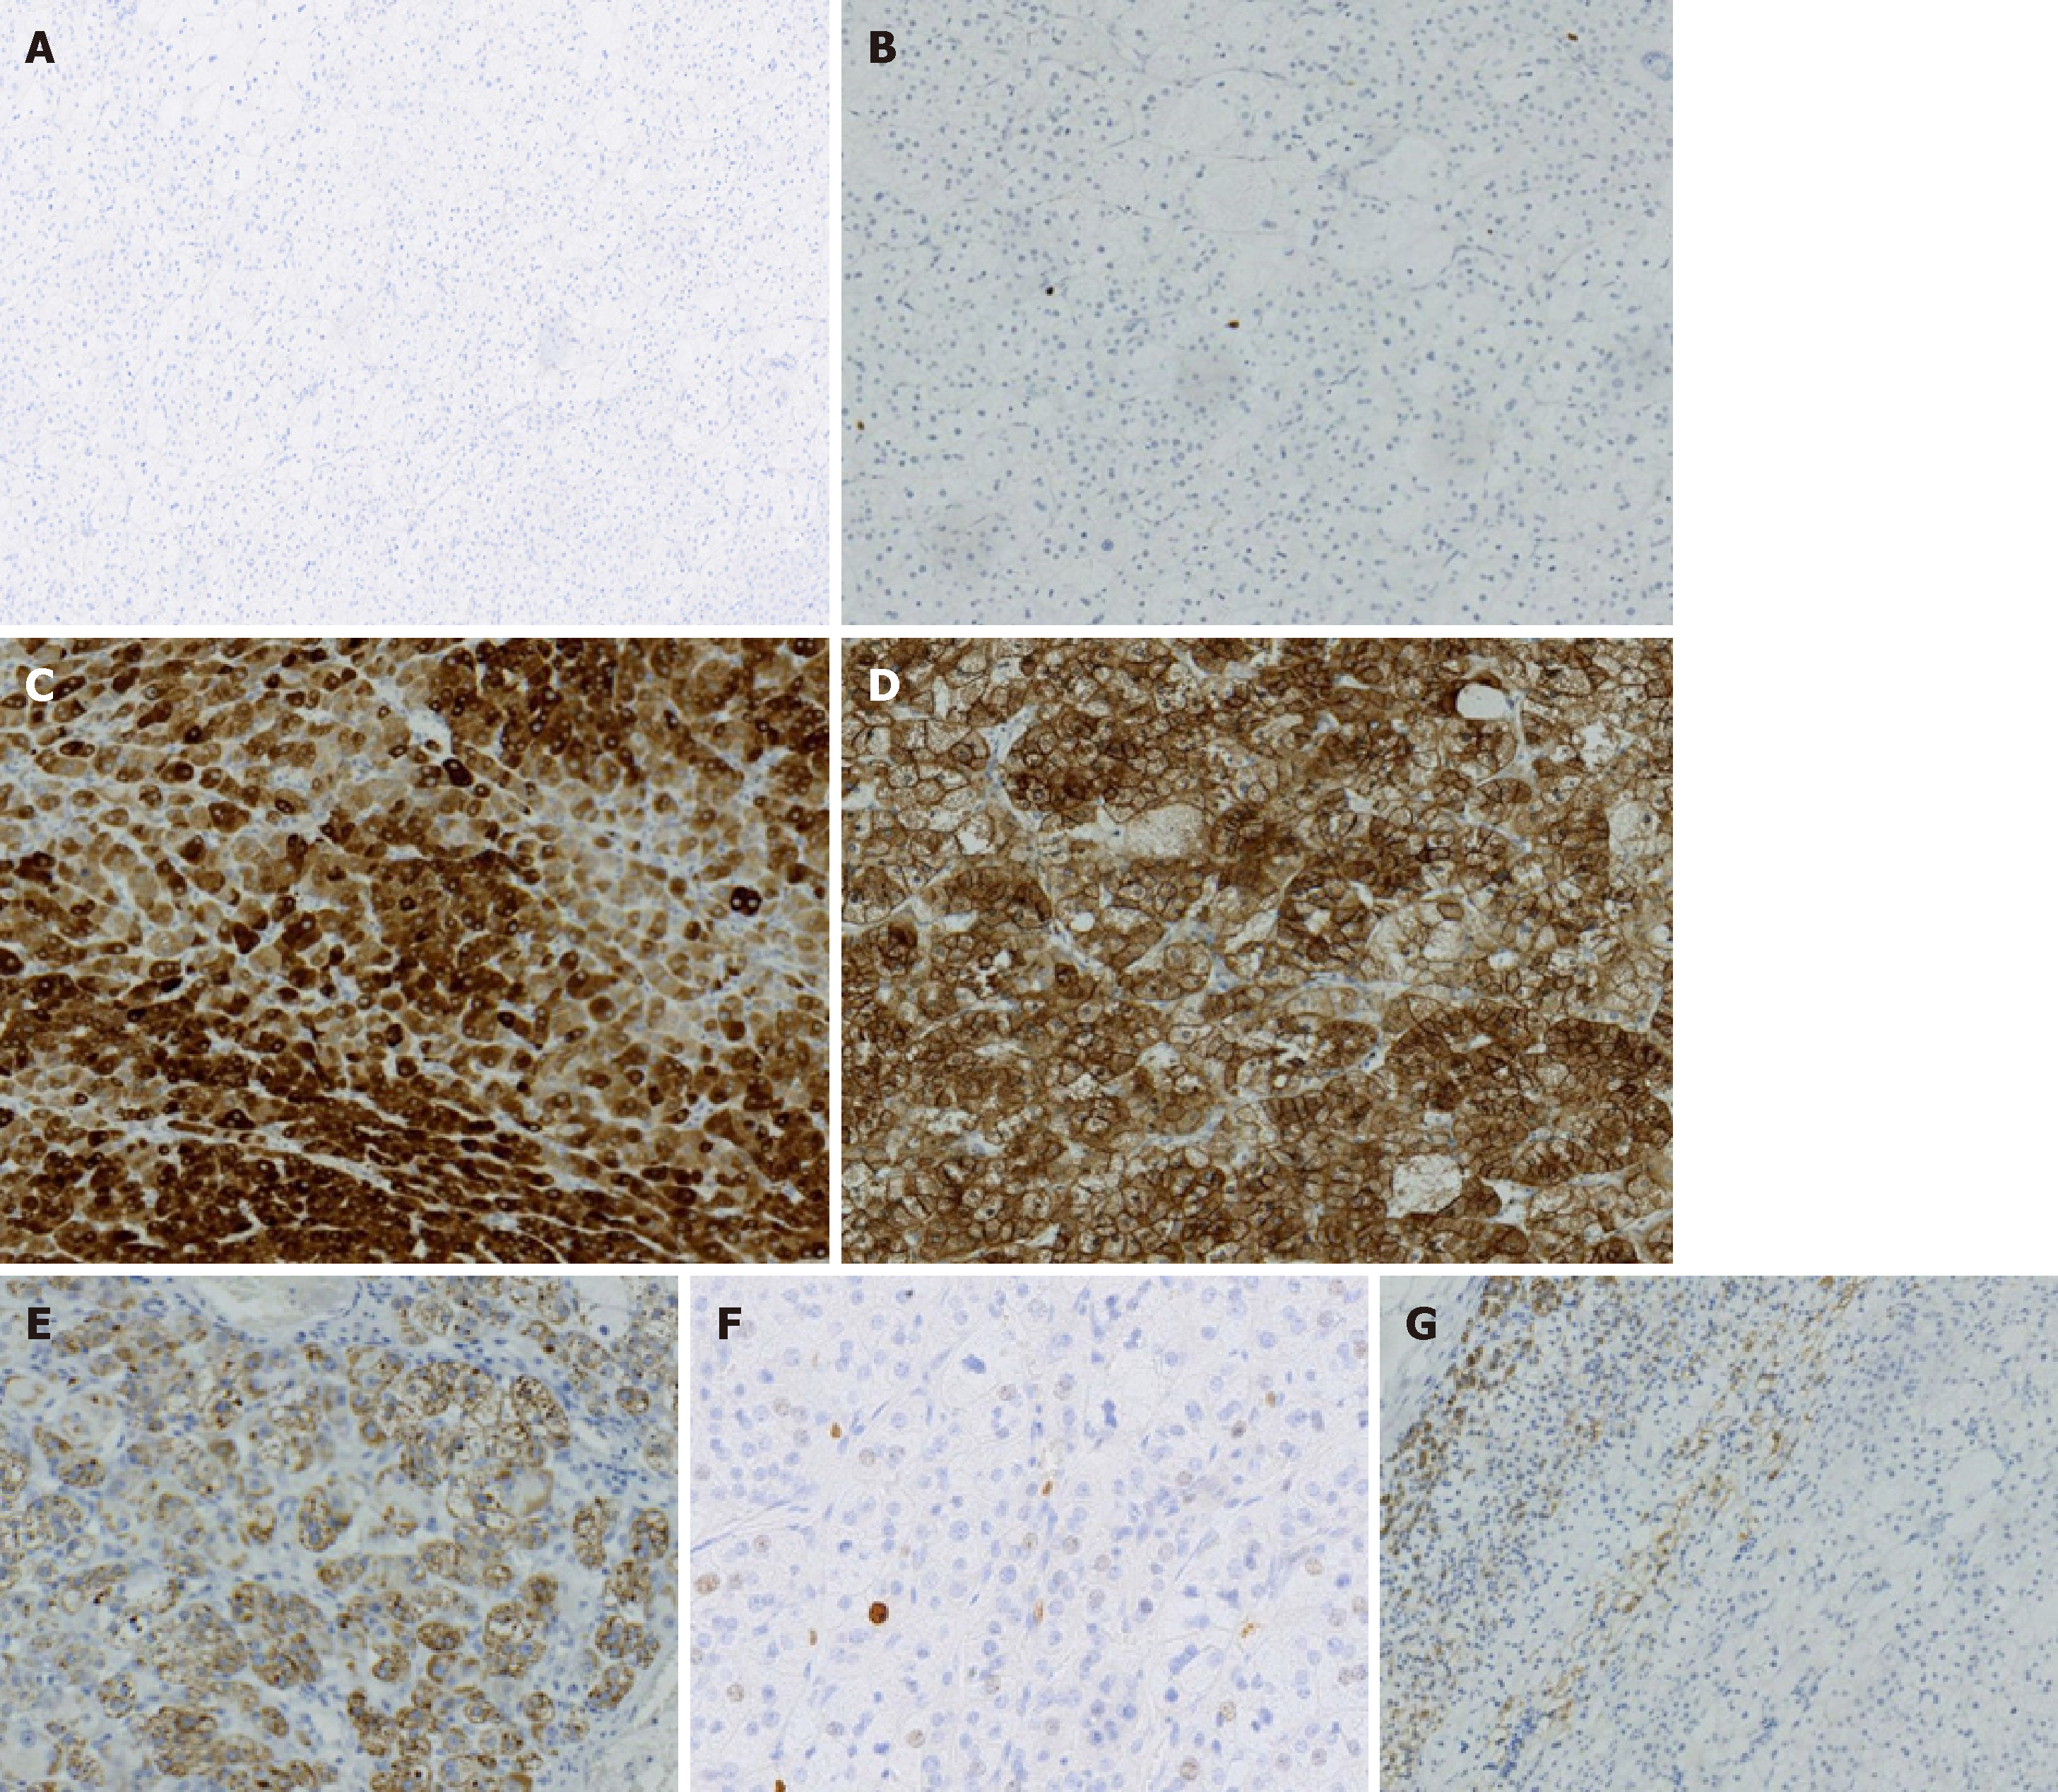
Figure 3 Immunohistochemical staining of the left adrenal adenoma (×100).
A and B: Areas negative for chromogranin A (CgA) (A) and cytokeratin (CK) (B); C-E: Tumor cells exhibiting strong staining for inhibin (C), synaptophysin (Syn) (D), and MelanA (E); F and G: Most parts of the tumor showed a proliferation index < 2% (F) and spotty positivity for S100 (G).
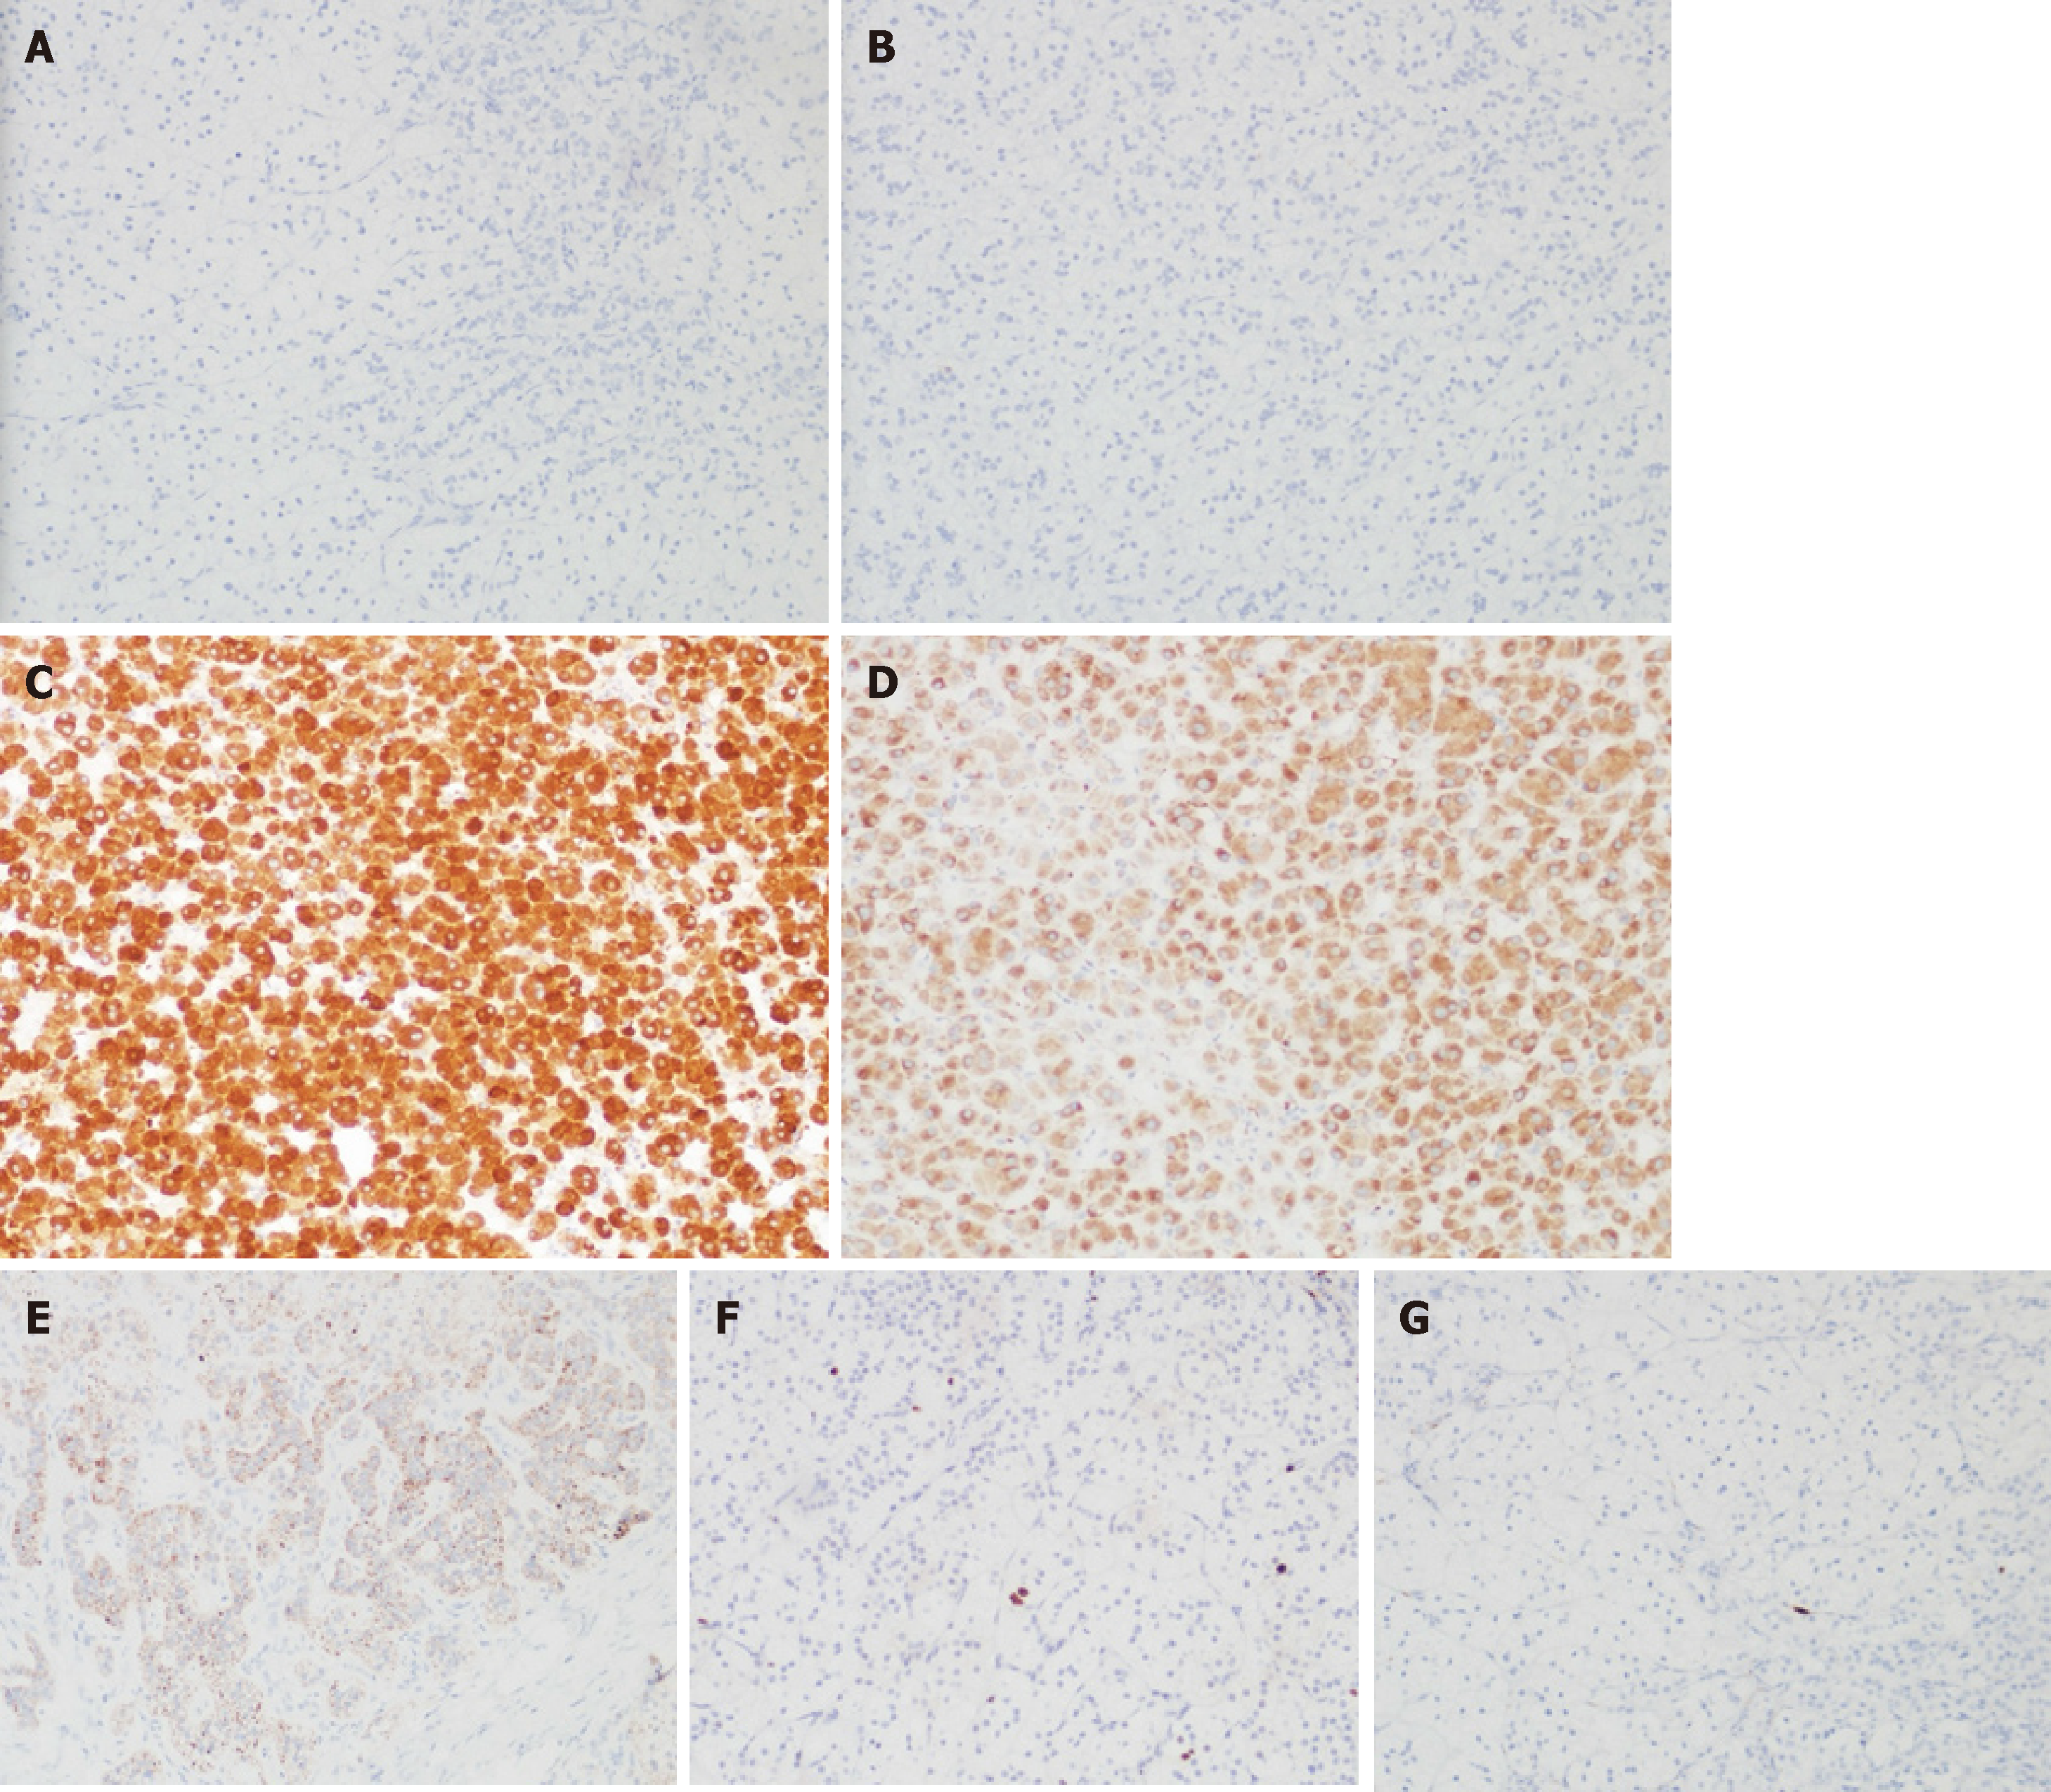
Figure 4 Immunohistochemical staining of the right adrenal adenoma (×100).
Areas negative for chromogranin A (CgA) (A) and cytokeratin (CK) (B), where some tumor cells exhibited positive staining for inhibin (C), synaptophysin (Syn) (D), and MelanA (E). Most parts of the tumor show a proliferation index < 2% (F) and spotty positivity for S100 (G).
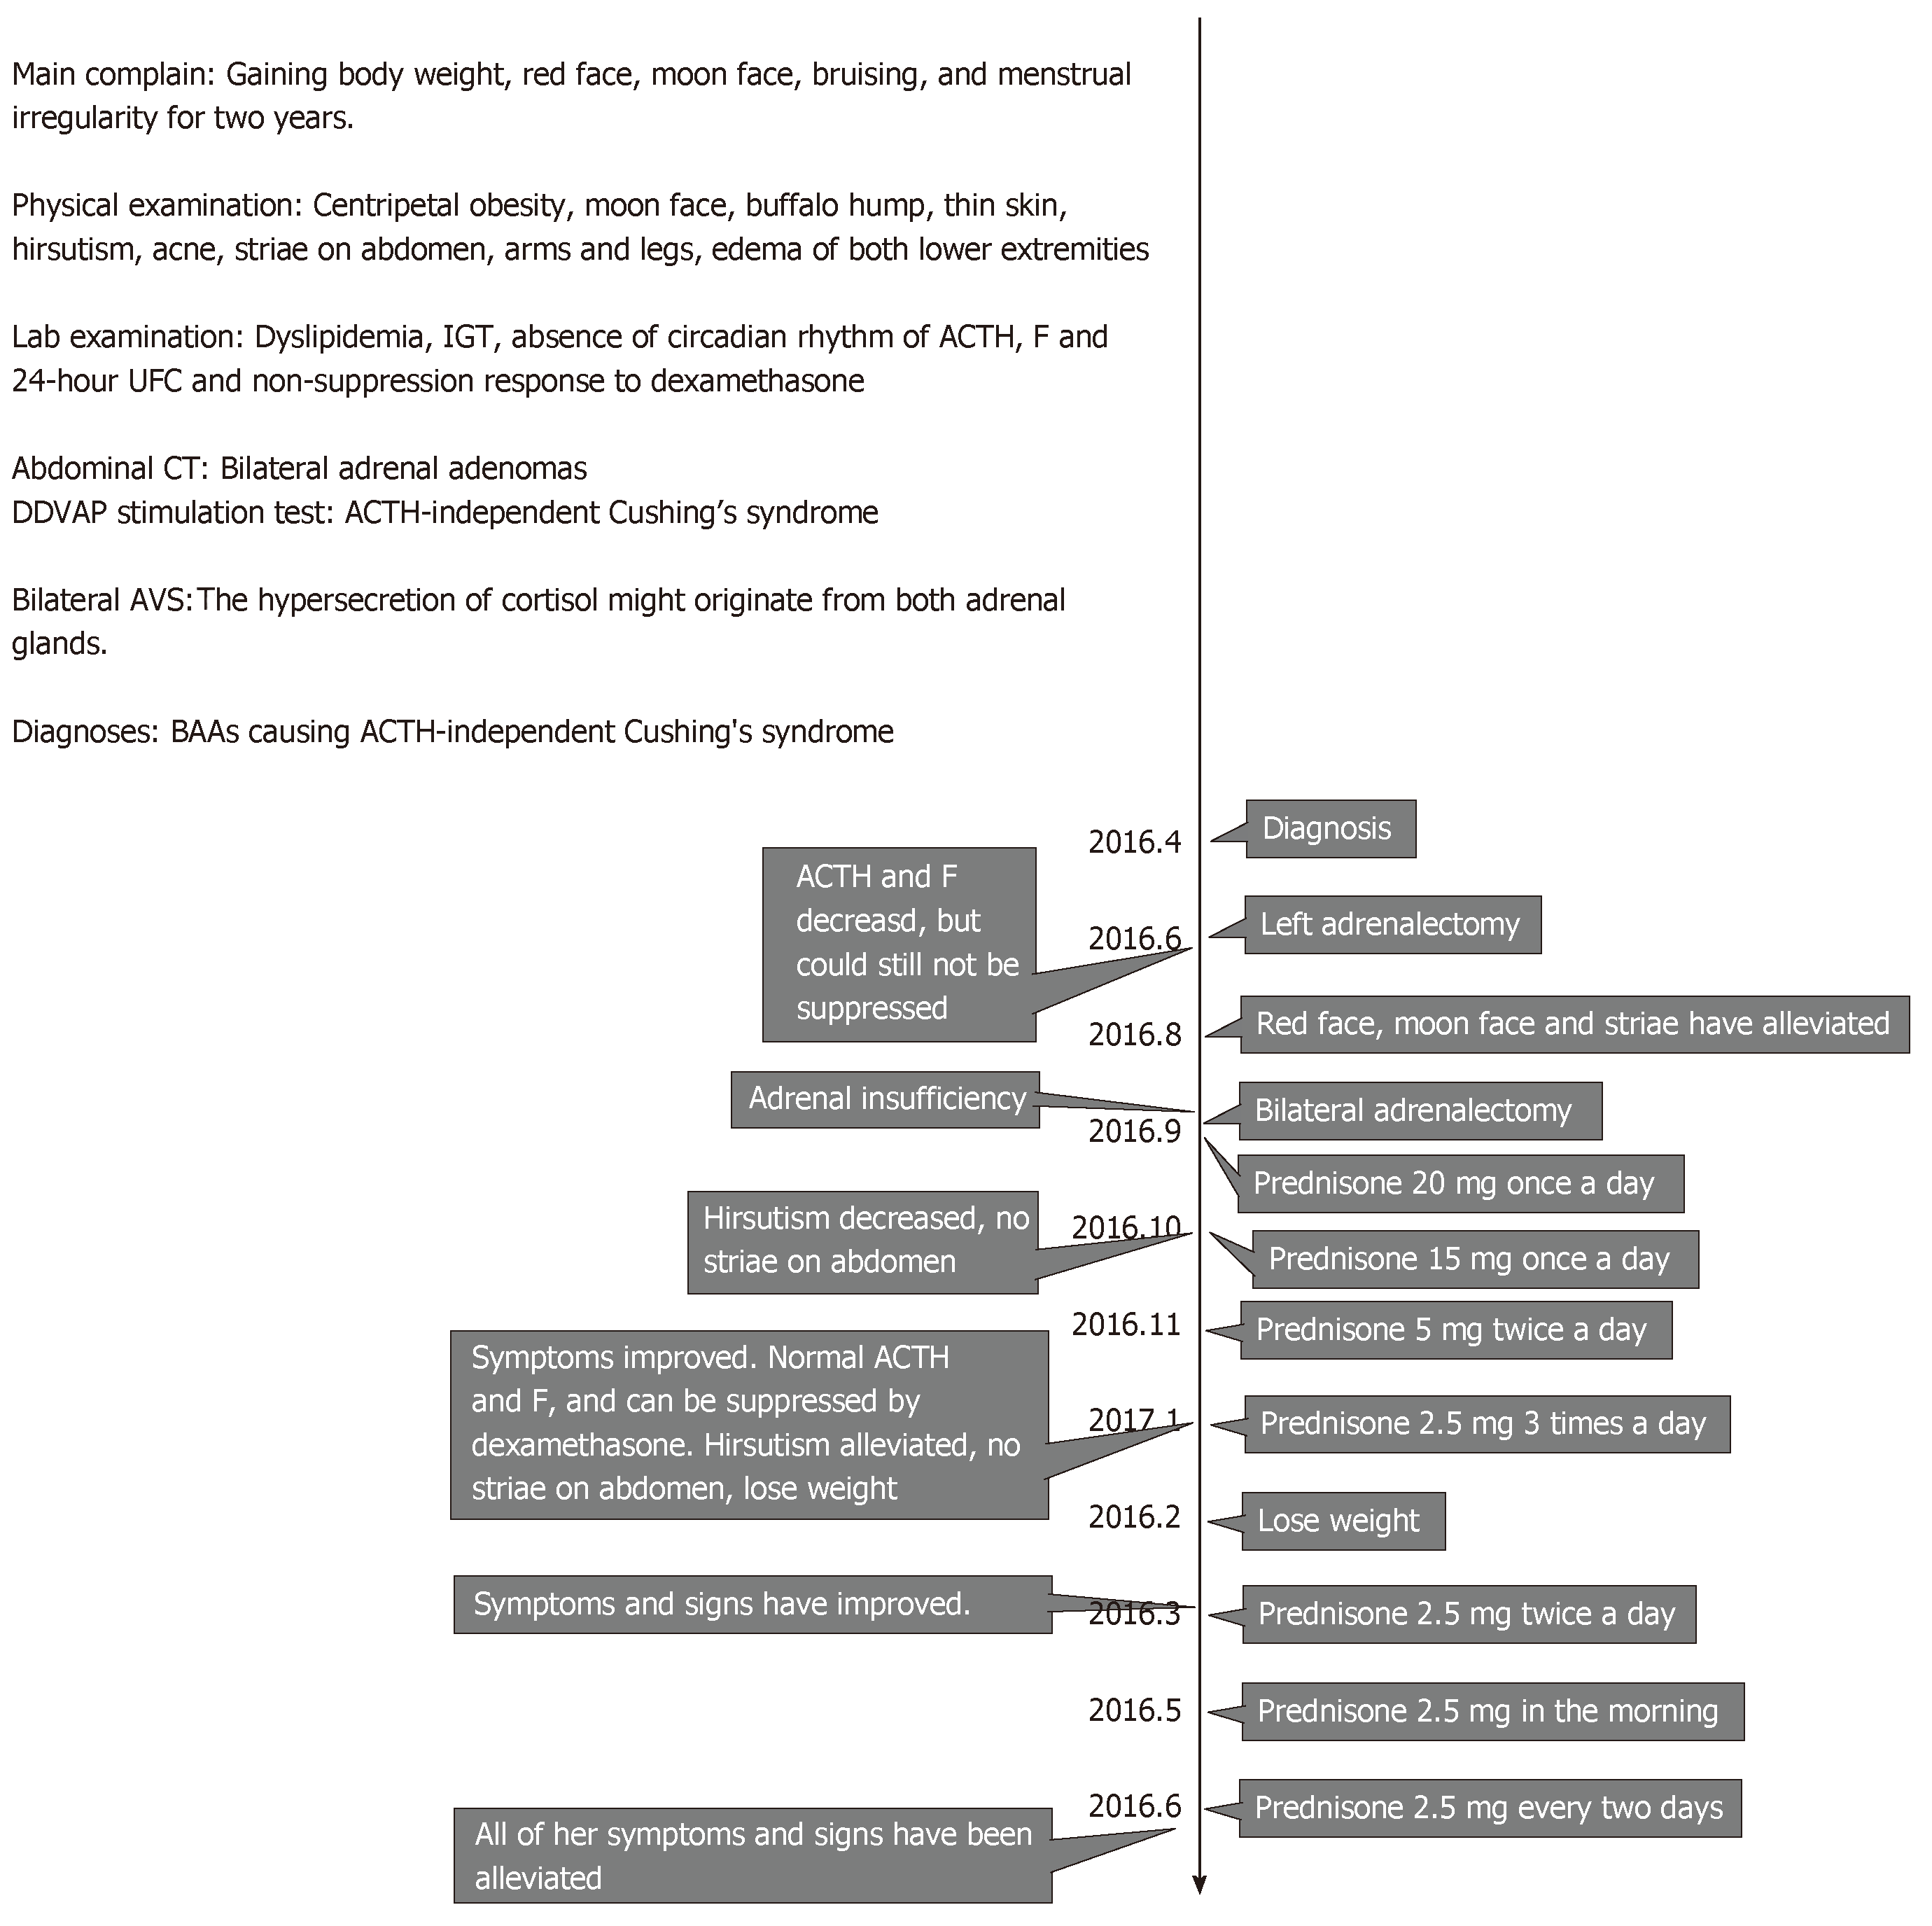
Figure 5 The timeline of this case report.
- Citation: Gu YL, Gu WJ, Dou JT, Lv ZH, Li J, Zhang SC, Yang GQ, Guo QH, Ba JM, Zang L, Jin N, Du J, Pei Y, Mu YM. Bilateral adrenocortical adenomas causing adrenocorticotropic hormone-independent Cushing’s syndrome: A case report and review of the literature. World J Clin Cases 2019; 7(8): 961-971
- URL: https://www.wjgnet.com/2307-8960/full/v7/i8/961.htm
- DOI: https://dx.doi.org/10.12998/wjcc.v7.i8.961


