Copyright
©The Author(s) 2019.
World J Clin Cases. Sep 26, 2019; 7(18): 2794-2801
Published online Sep 26, 2019. doi: 10.12998/wjcc.v7.i18.2794
Published online Sep 26, 2019. doi: 10.12998/wjcc.v7.i18.2794
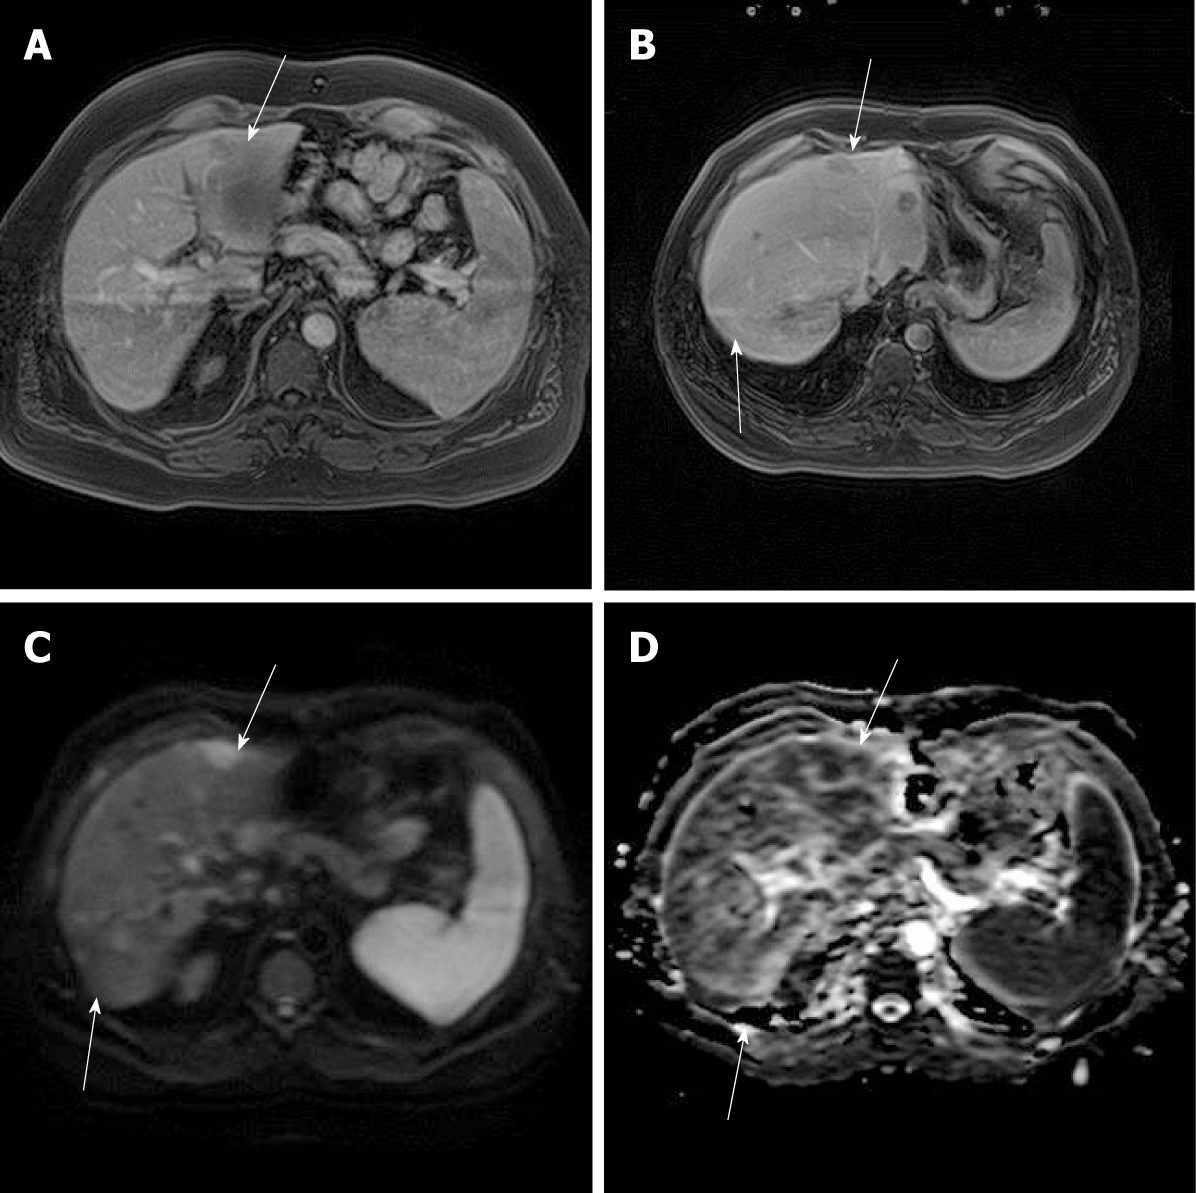
Figure 1 MR images 11 mo after LT.
A: Axial postcontrast T1 MR images showed light peripheral enhancement of the lesion in segment III in the arterial phase (arrow); B: Postcontrast axial images through the transplanted liver revealed hypointensive lesions in segments III and VIII in the portal venous phase (arrows); C: Diffusion-weighted images with b 600 showed hyperintensity of the same lesions; D: On apparent diffusion coefficient map, the lesions showed diffusion restriction. LT: Liver transplant; MR: Magnetic resonance.
Figure 2 Abdominal CT images 3.
5 years after LT. Axial (A and B) and coronal (C) CT images in the portal venous phase, revealed multiple hypovascular lesions (arrows) compared to previous MR images in Figure 1. CT: Computed tomography; LT: Liver transplant; MR: Magnetic resonance.
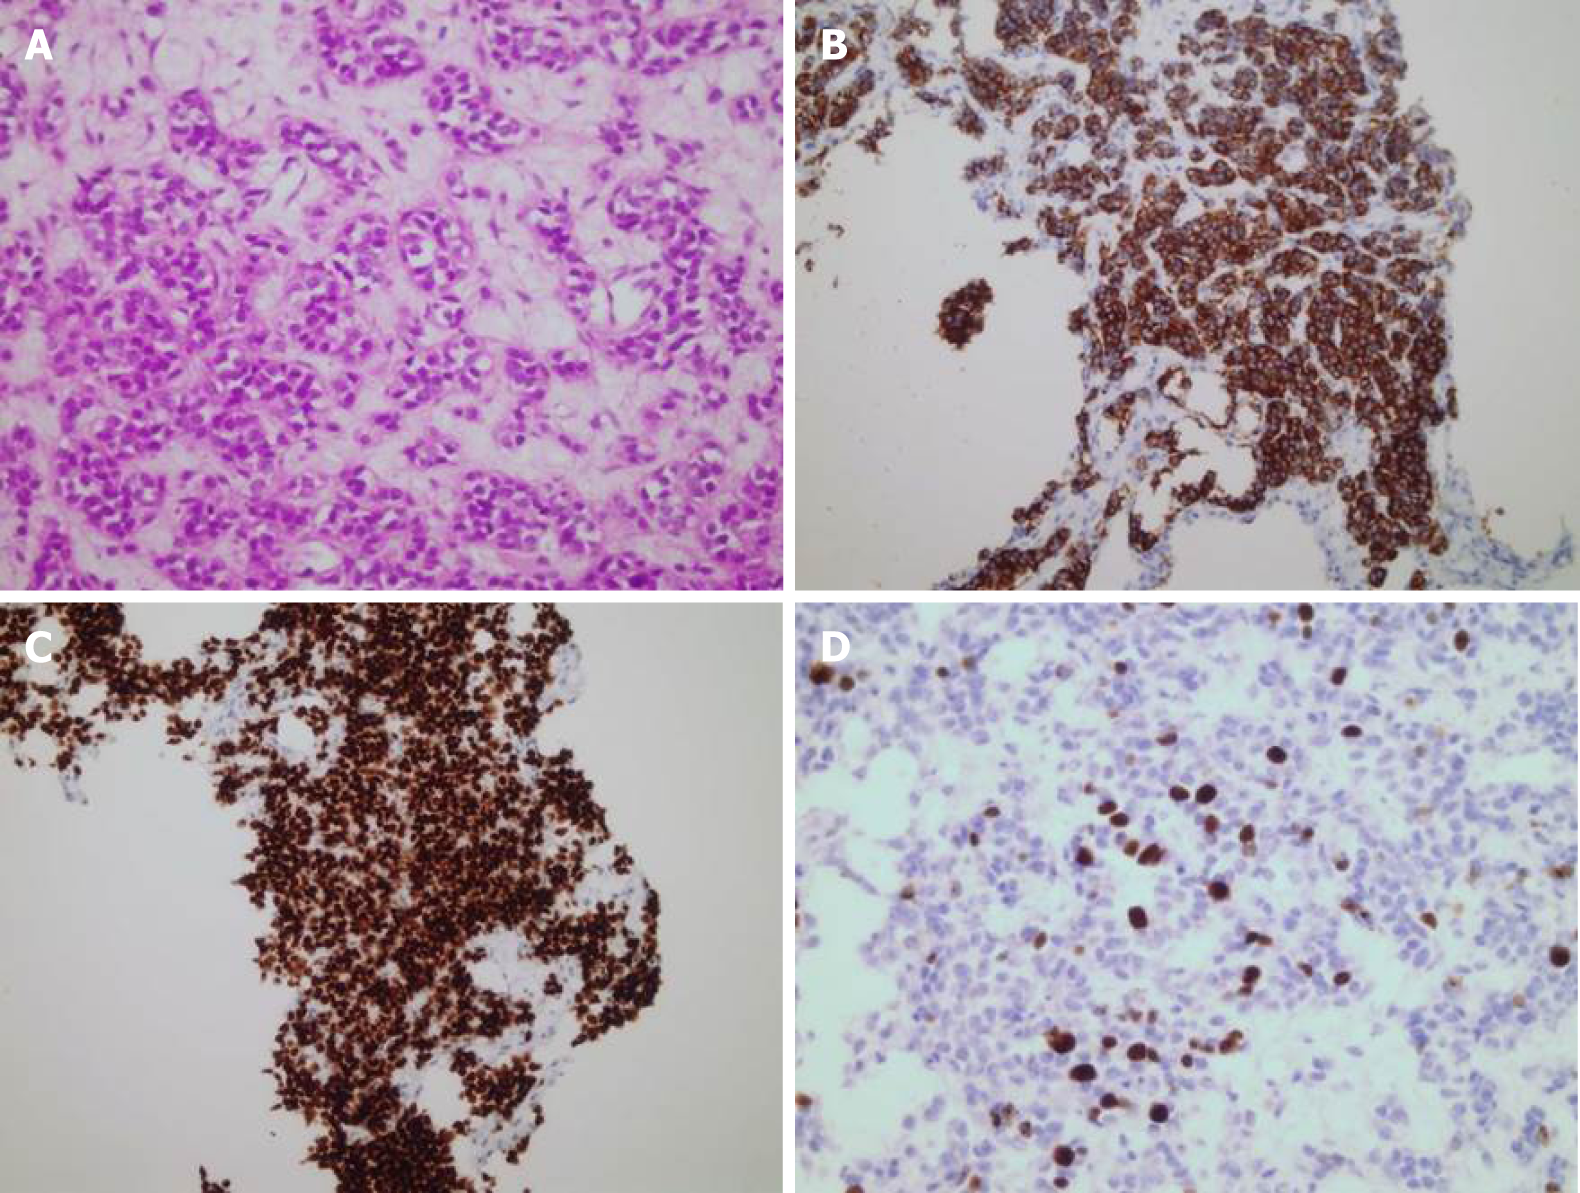
Figure 3 Liver biopsy and immunohistochemistry of neuroendocrine tumor.
A: Closely packed nests of well-differentiated neuroendocrine cells (hematoxylin and eosin staining; magnification 400 ×); B: Synaptophysin staining (magnification 200 ×); C: TTF-1 staining (magnification 200 ×); D: Ki67 (magnification 400 ×).
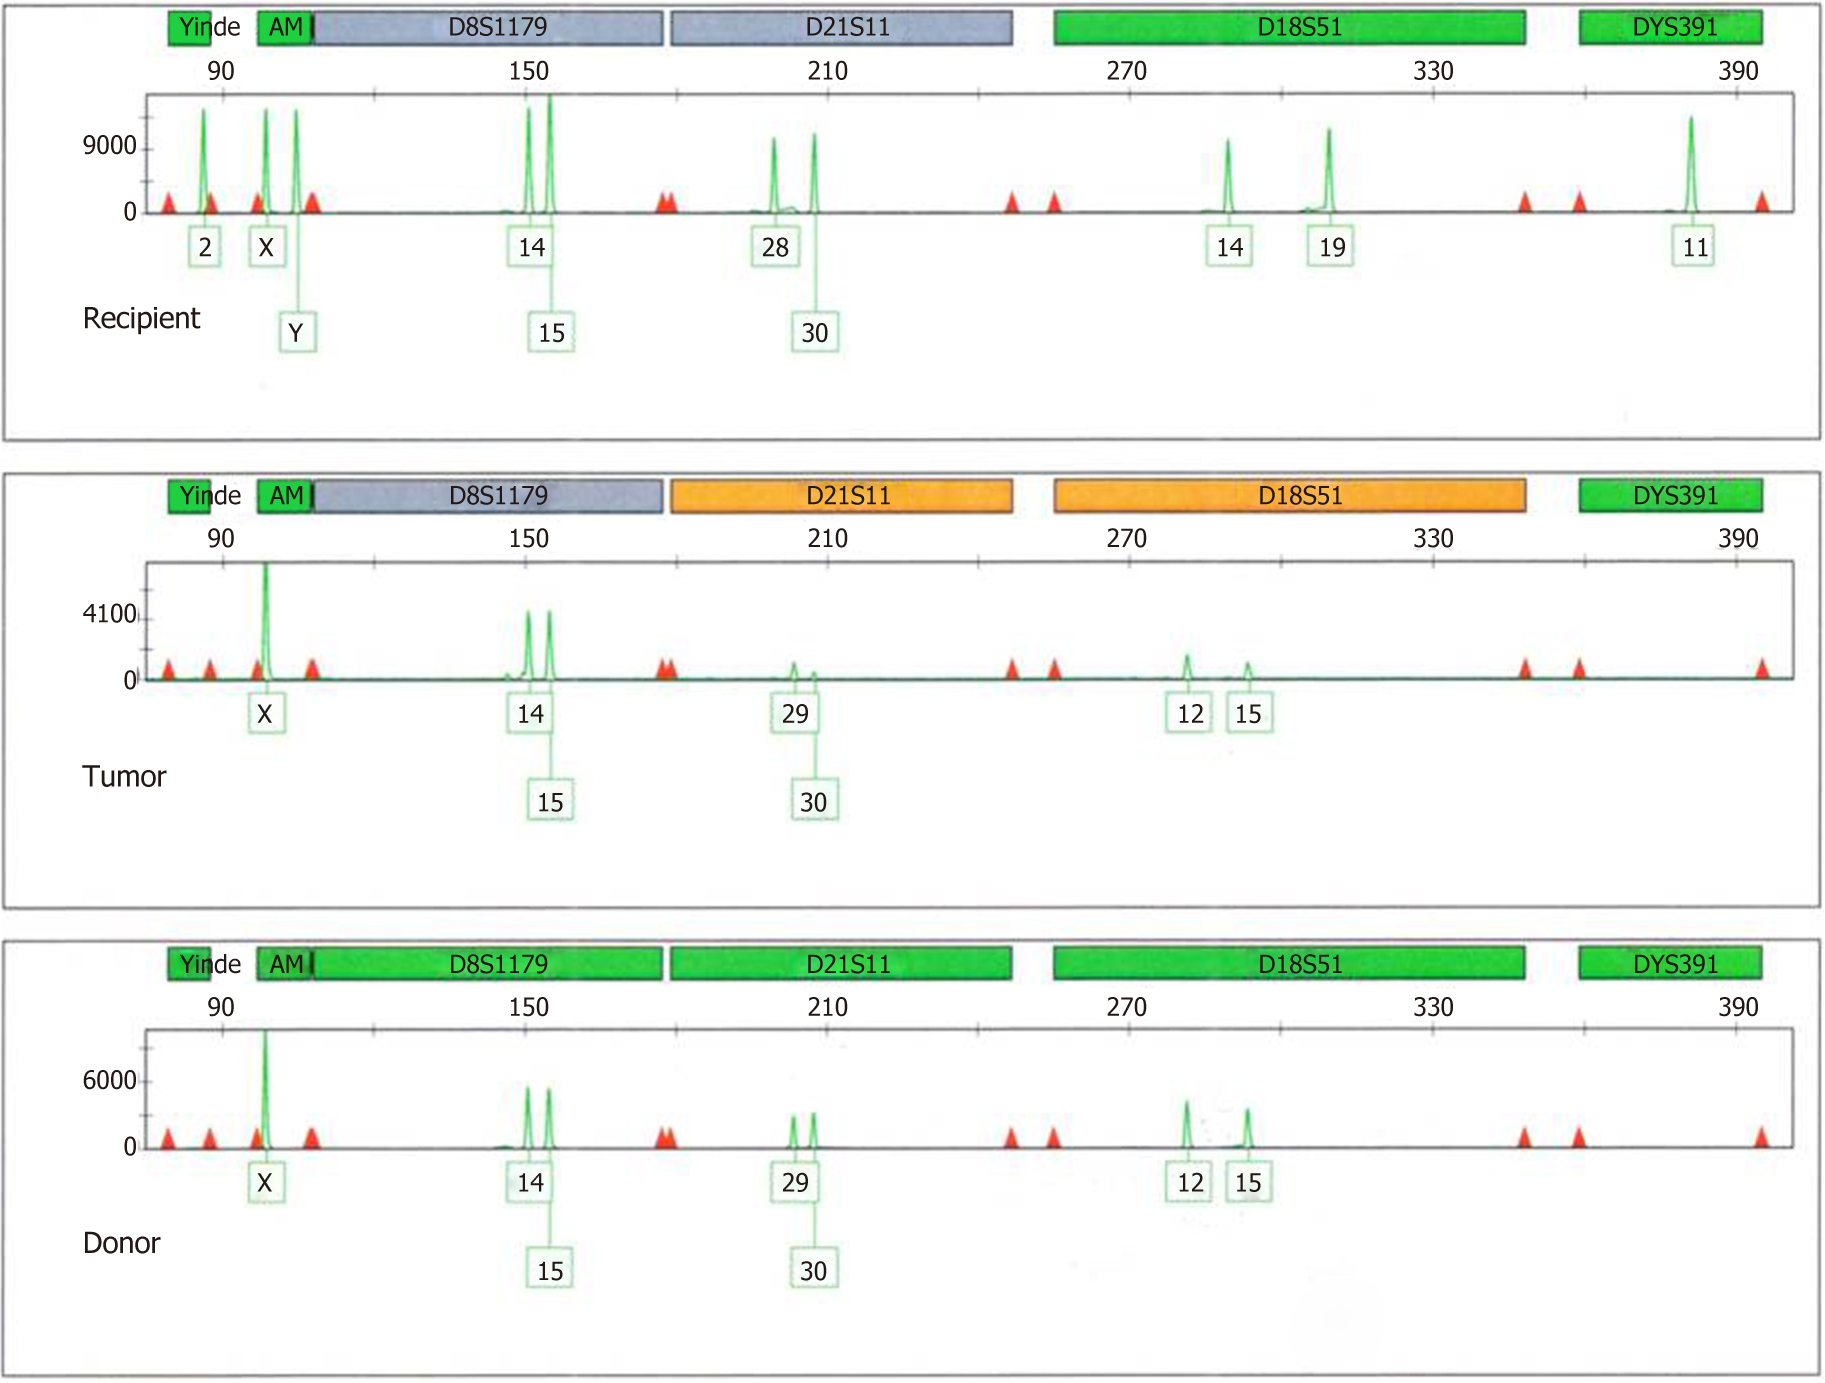
Figure 4 DNA profile of six markers (Yindel, Amelogenin, D8S1179, D21S11, D18S51, and DYS391) for recipient blood, tumor tissue, and donor sample.
- Citation: Mrzljak A, Kocman B, Skrtic A, Furac I, Popic J, Franusic L, Zunec R, Mayer D, Mikulic D. Liver re-transplantation for donor-derived neuroendocrine tumor: A case report. World J Clin Cases 2019; 7(18): 2794-2801
- URL: https://www.wjgnet.com/2307-8960/full/v7/i18/2794.htm
- DOI: https://dx.doi.org/10.12998/wjcc.v7.i18.2794


