Copyright
©The Author(s) 2019.
World J Clin Cases. Sep 26, 2019; 7(18): 2734-2745
Published online Sep 26, 2019. doi: 10.12998/wjcc.v7.i18.2734
Published online Sep 26, 2019. doi: 10.12998/wjcc.v7.i18.2734
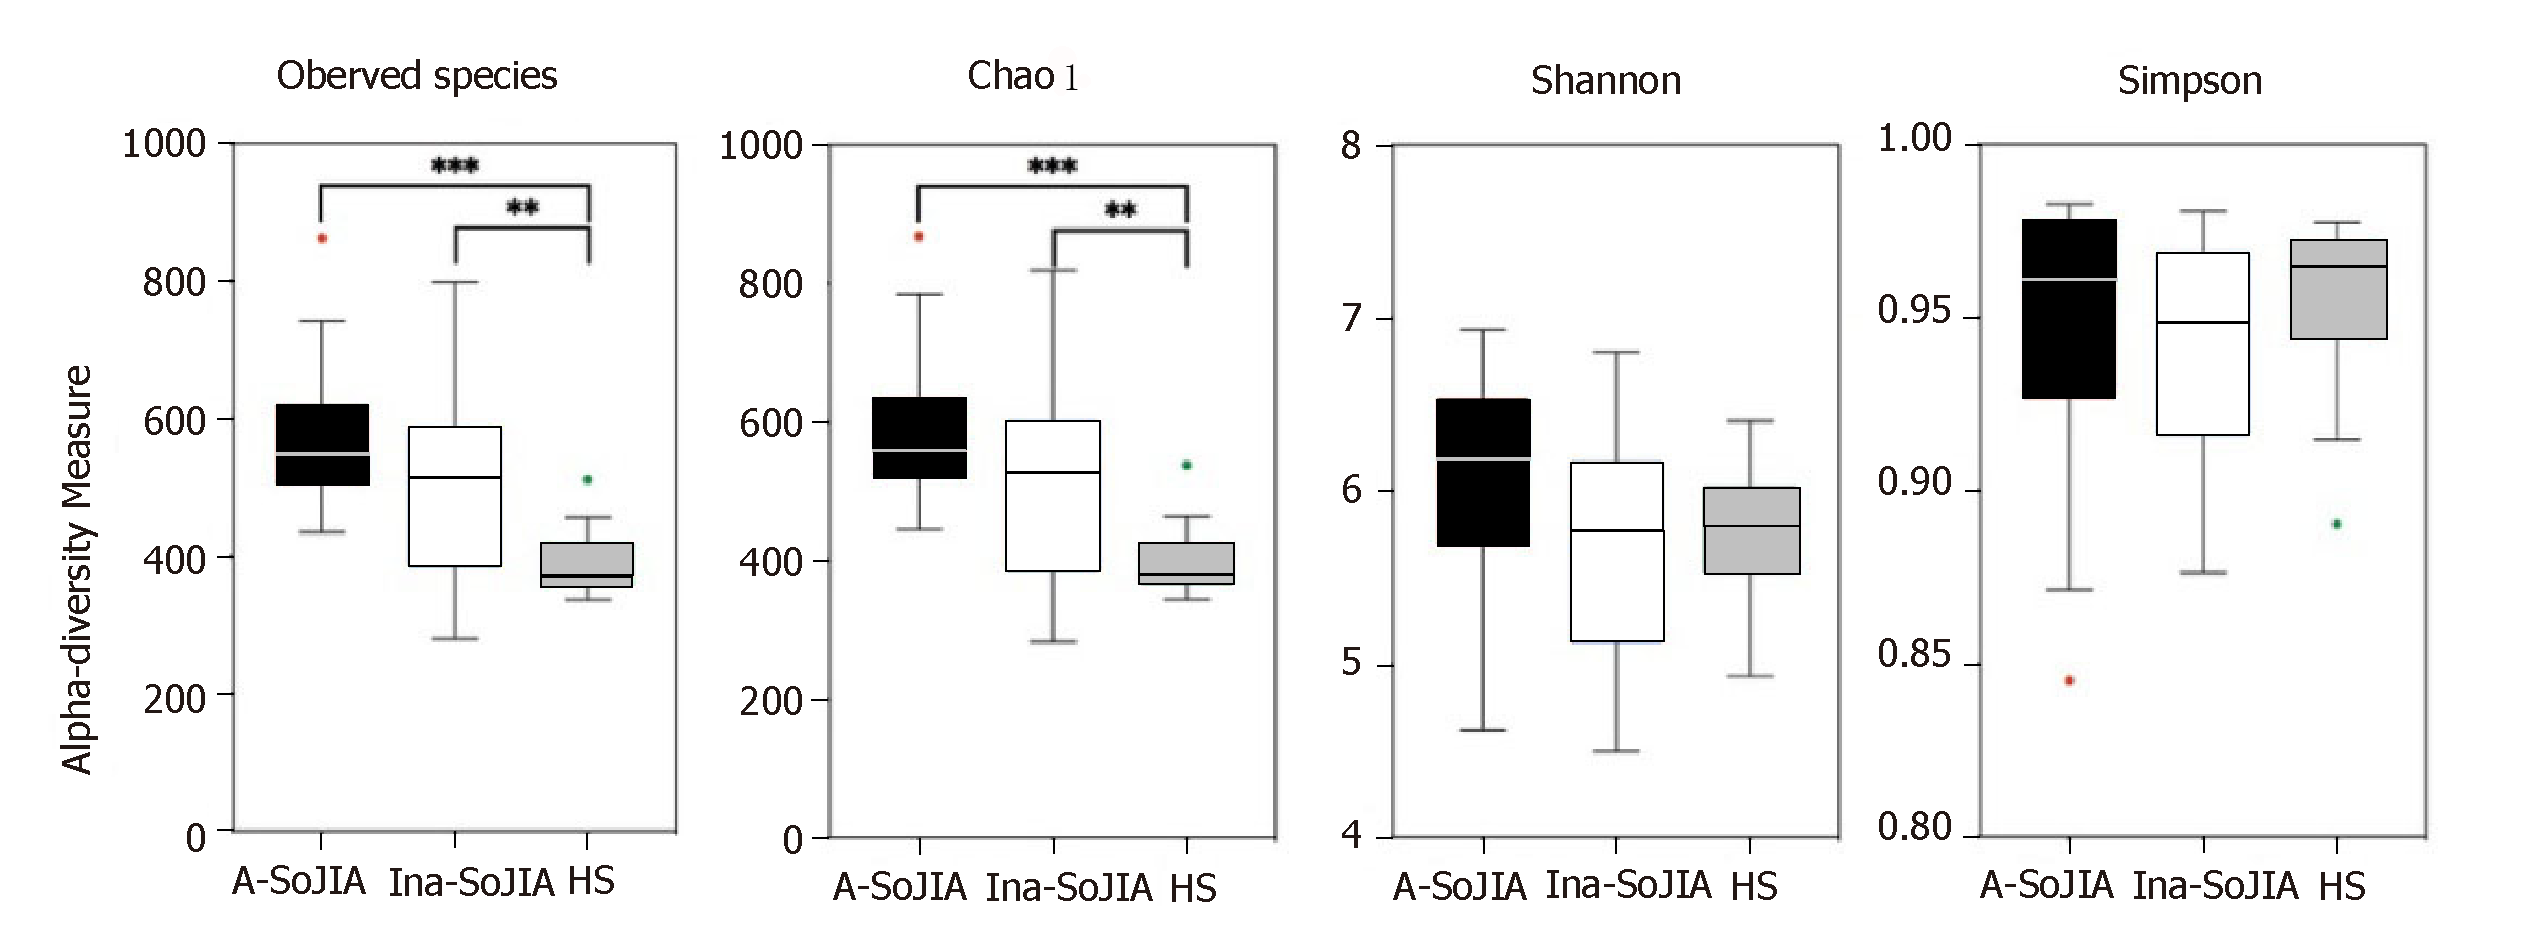
Figure 1 Box plots of observed species, Chao1 index, and Shannon and Simpson indices of microbiota for healthy subjects and systemic-onset juvenile idiopathic arthritis patients with different disease activities.
Medians and interquartile ranges are shown. The significance of differences was calculated using the Kruskal-Wallis test with Bonferroni correction. aP < 0.001, A-SoJIA vs HS in observed species; bP < 0.01, Ina-SoJIA vs HS in observed species; cP < 0.001, A-SoJIA vs HS in Chao1; dP < 0.01, Ina-SoJIA vs HS in Chao1. SoJIA: Systemic-onset juvenile idiopathic arthritis; A-SoJIA: Active-SoJIA; Ina-SoJIA: Inactive-SoJIA; HS: Healthy subjects.
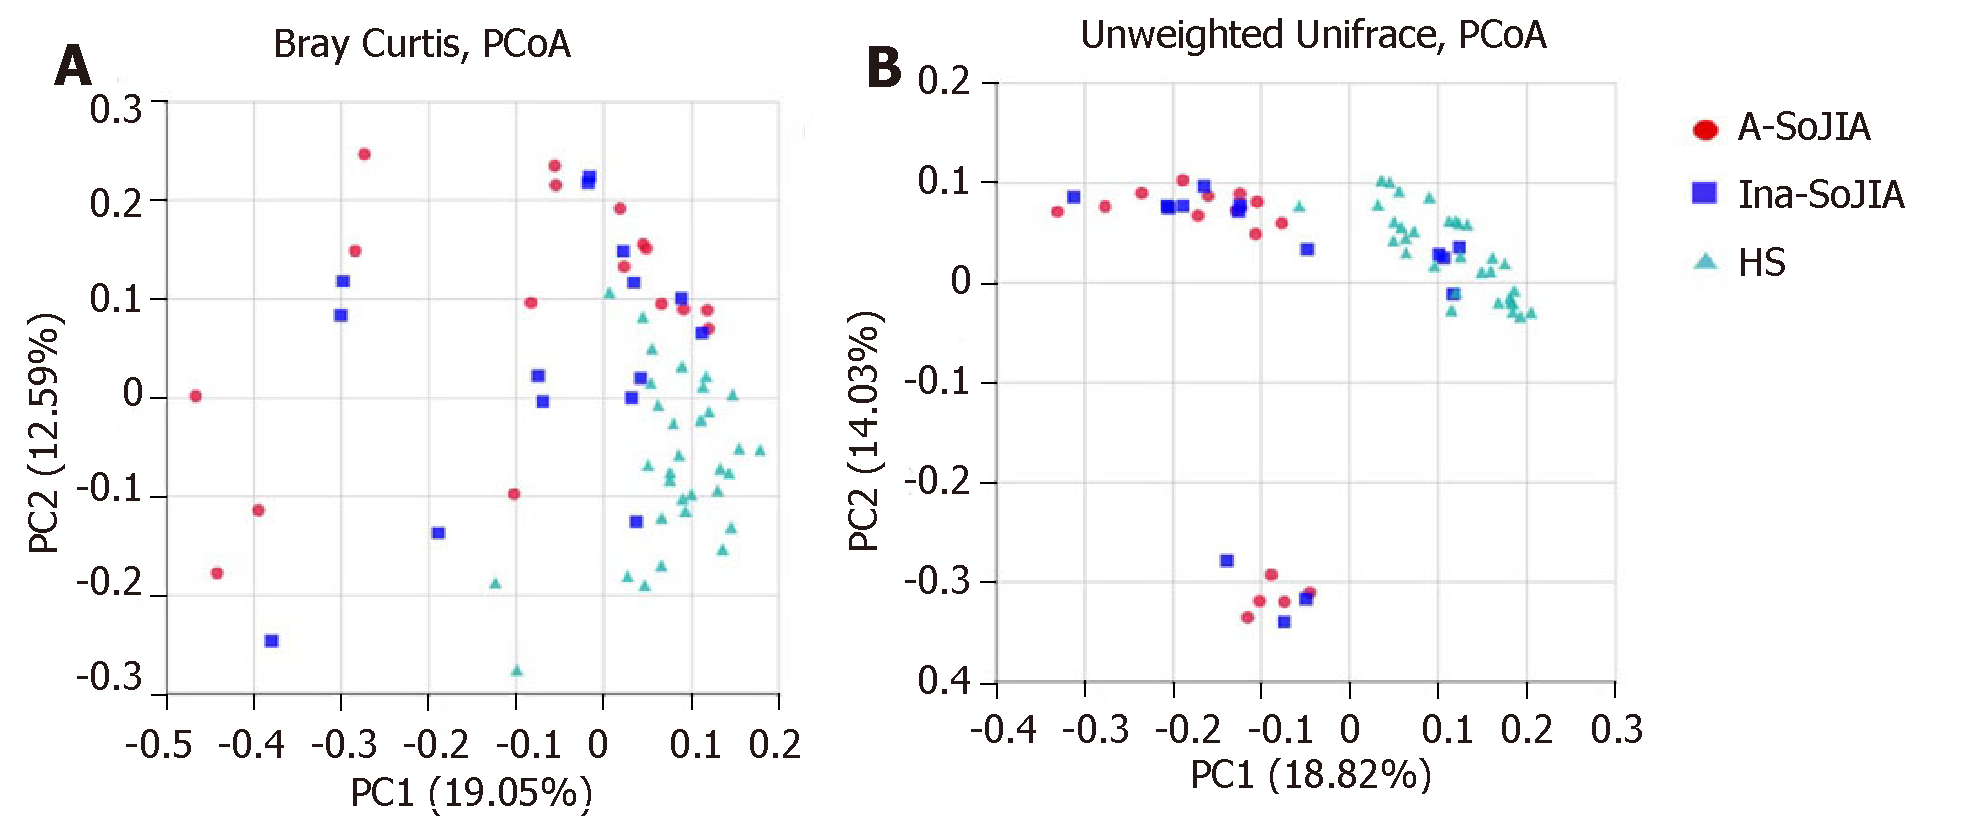
Figure 2 Principal coordinate analysis based on the overall structure of the stool microbiota in all samples.
A: Principal coordinate analysis (PCoA) of Bray-Curtis dissimilarities; B: PCoA of unweighted UniFrac dissimilarities. Each data point represents an individual sample. Red: Active-SoJIA; Blue: Inactive-SoJIA; Green: Healthy subject samples.
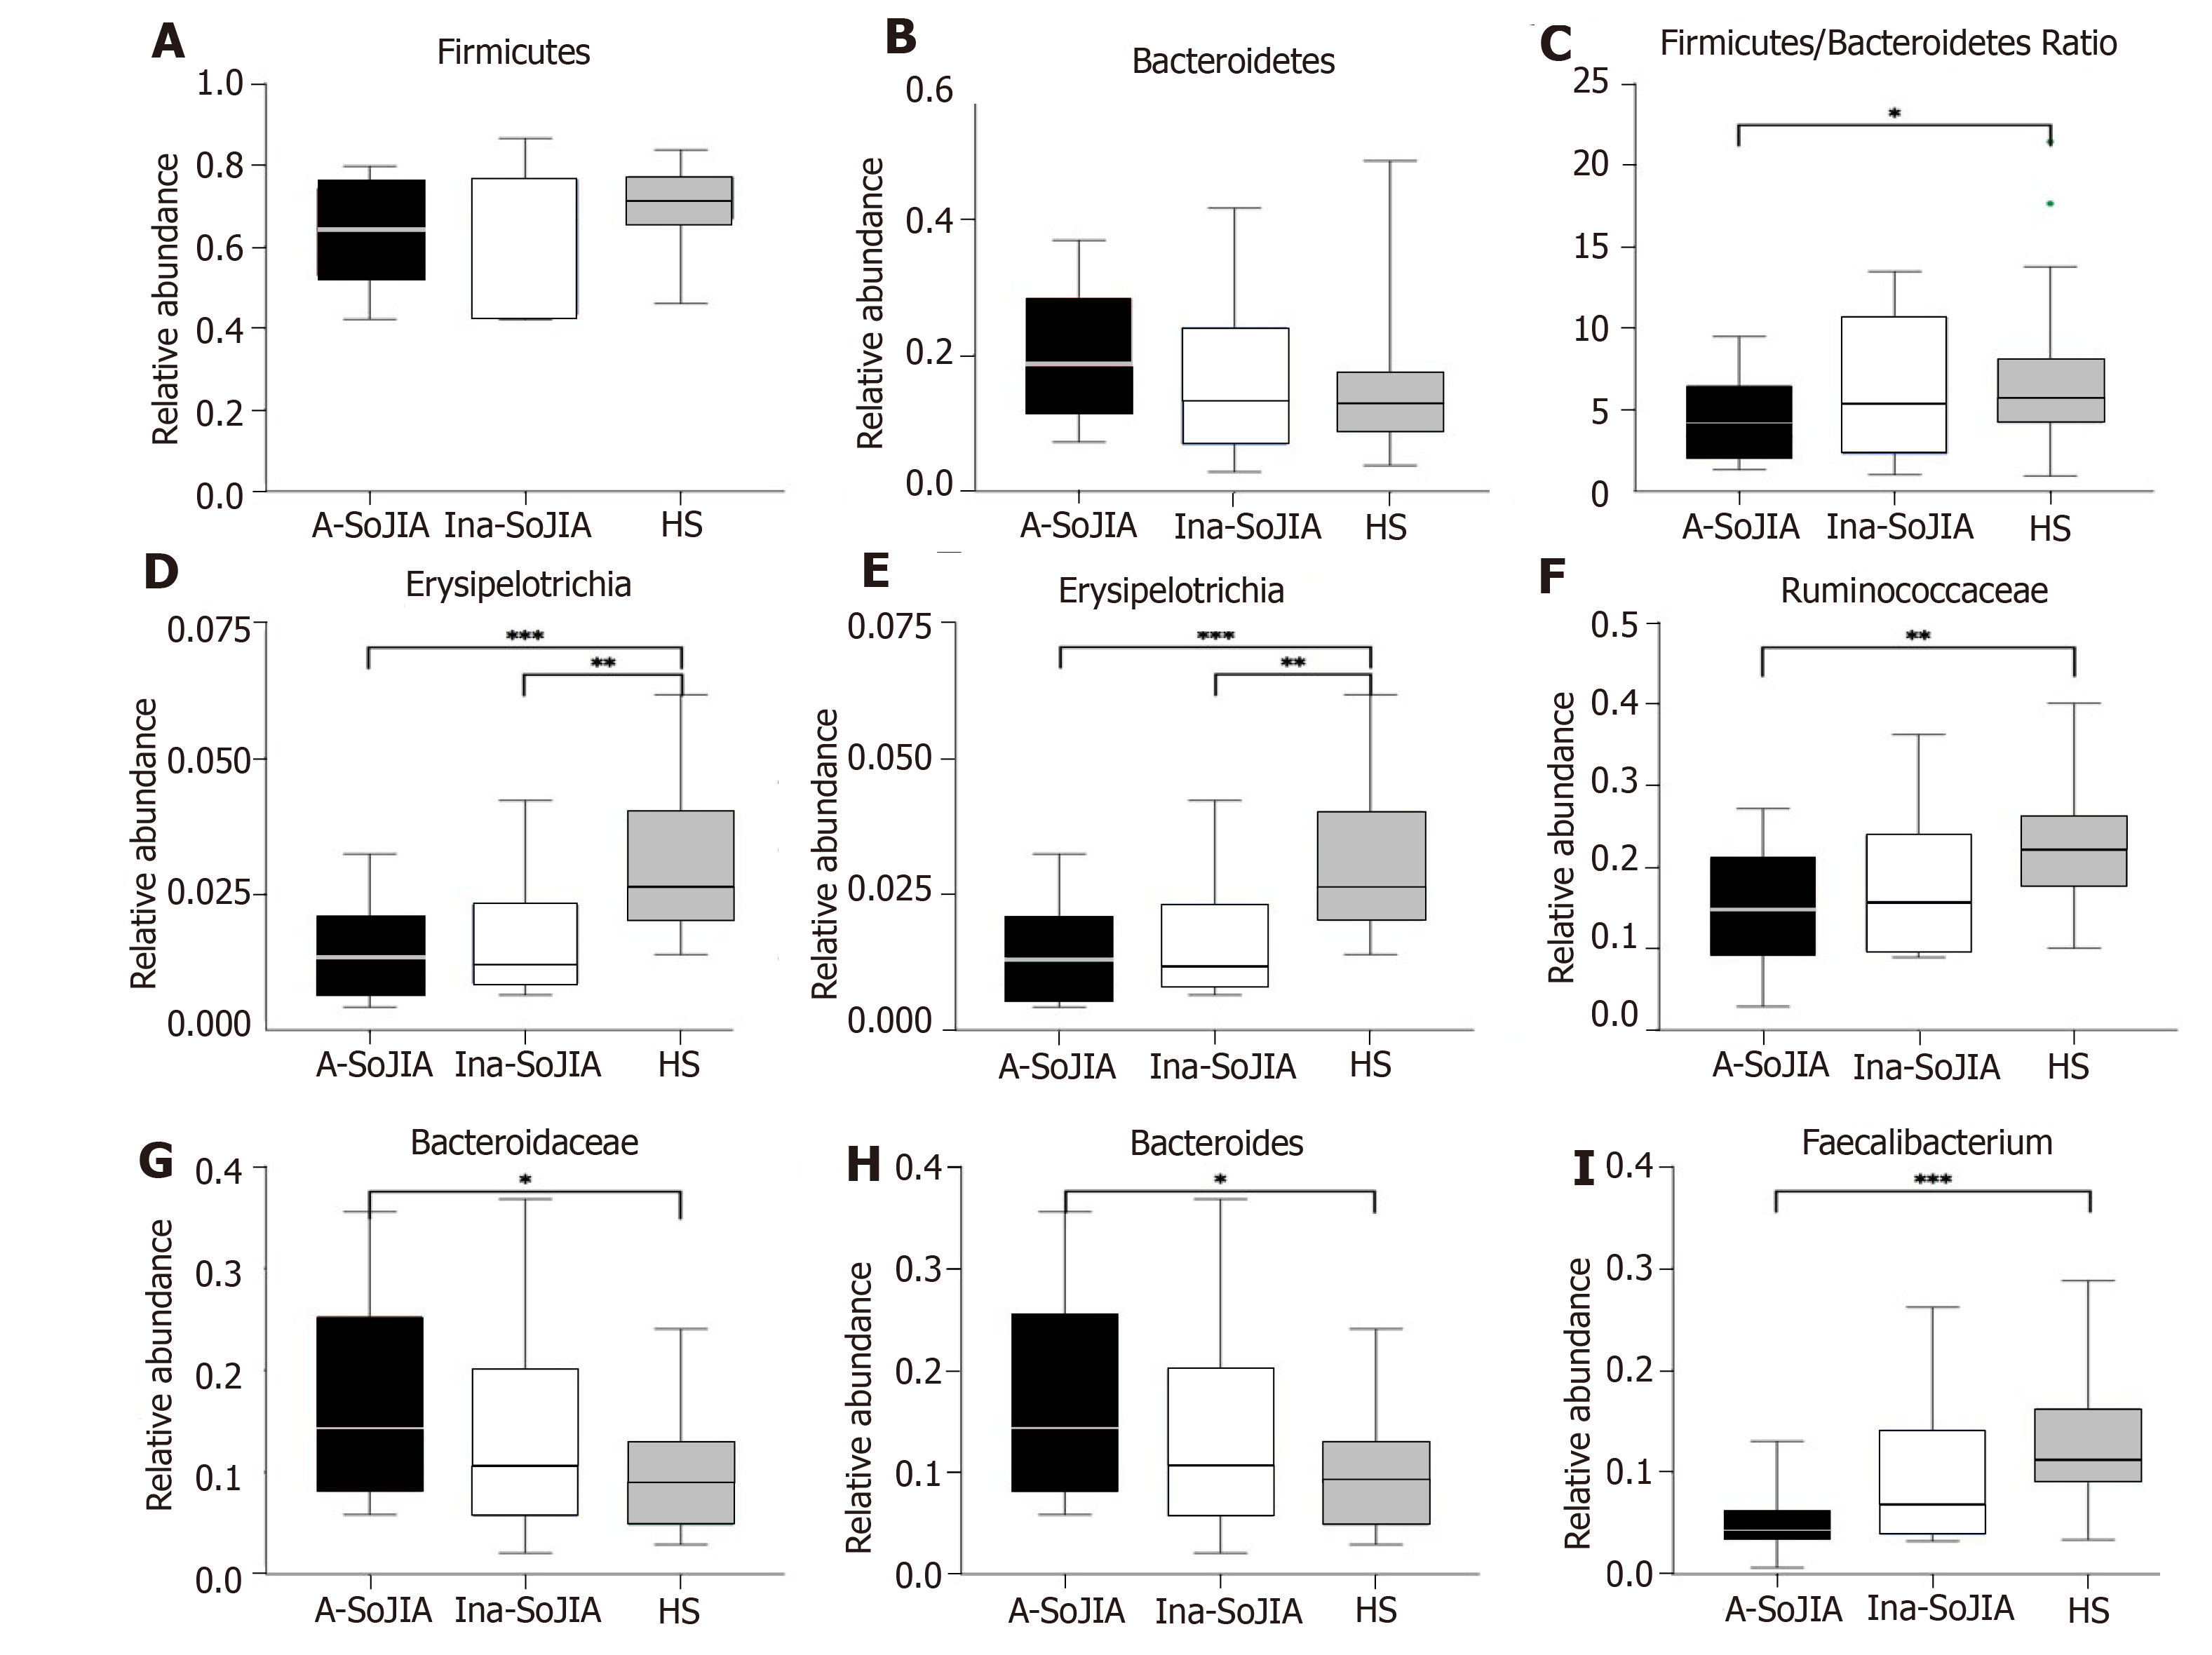
Figure 3 Relative abundances of fecal bacterial components in systemic-onset juvenile idiopathic arthritis and healthy subjects groups.
A: Box plots of Firmicutes; B: Box plots of Bacteroidetes; C: Box plots of Firmicutes/Bacteroidetes ratio; D-I: Box plots of statistically significantly different bacteria at levels below phylum. Significance was calculated by the Kruskal-Wallis test with Bonferroni correction.
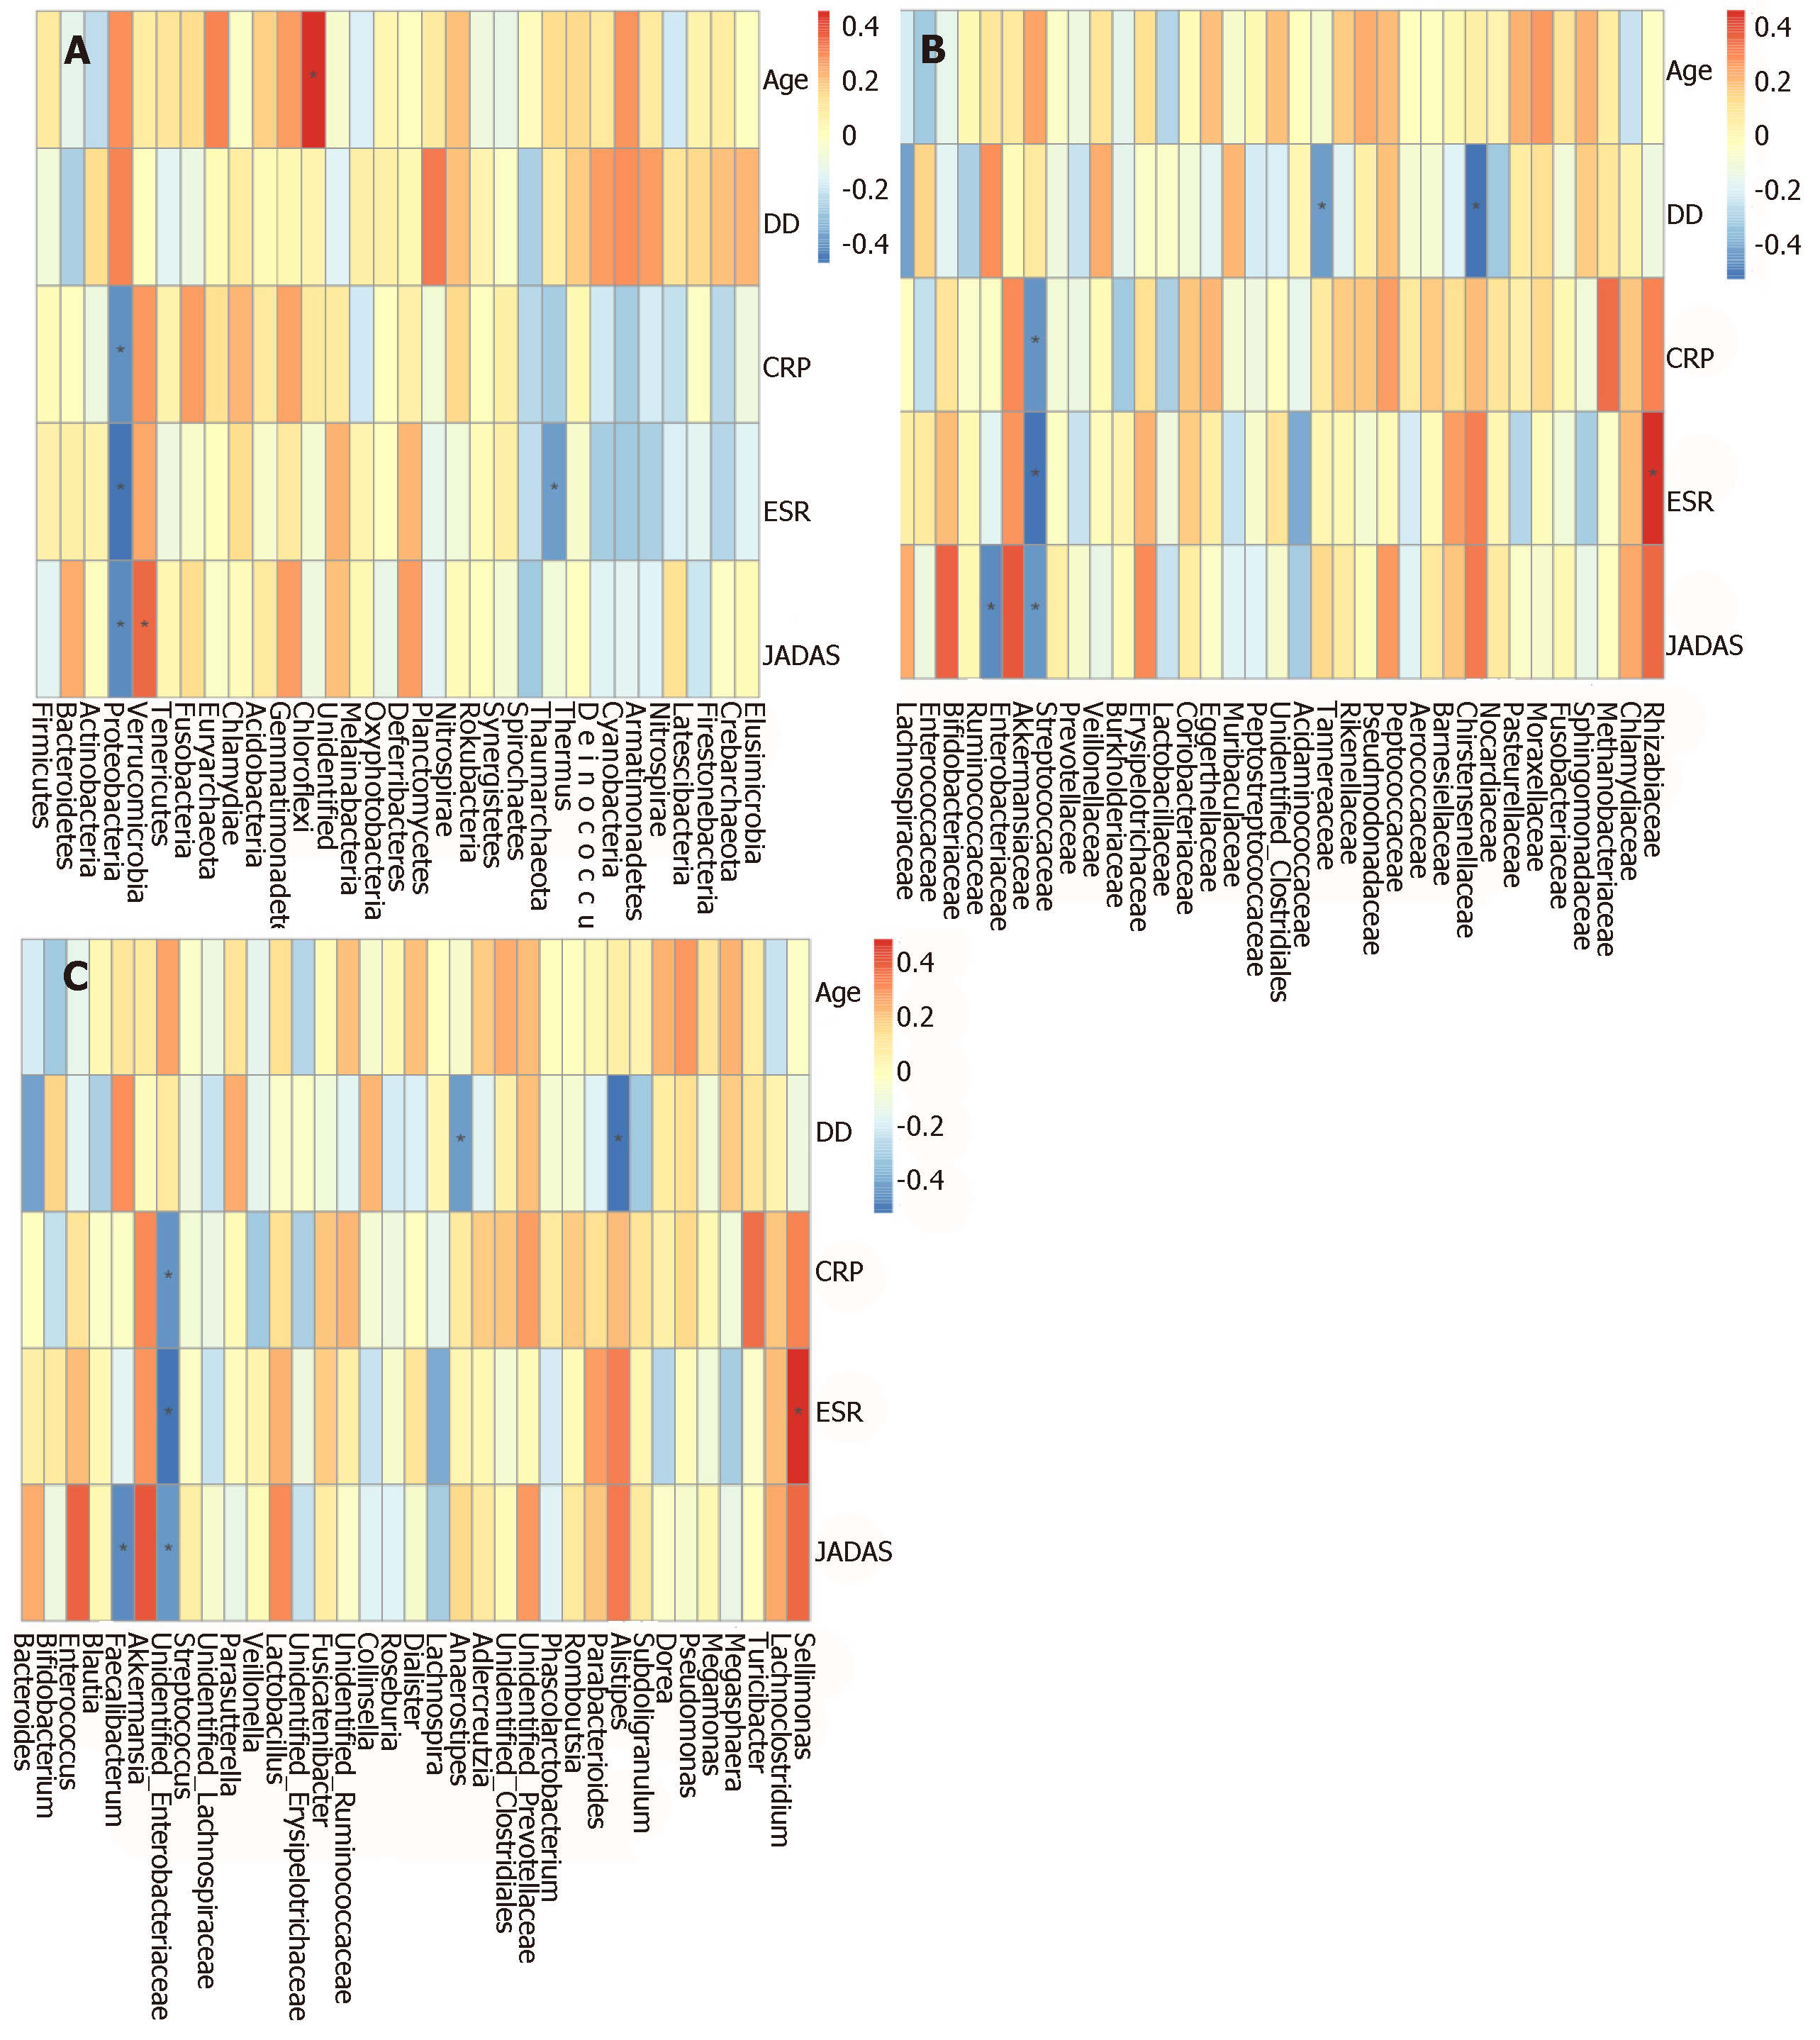
Figure 4 Associations between gut microbiota profile and clinicopathological features in systemic-onset juvenile idiopathic arthritis patients at the (A) phylum, (B) family, and (C) genus levels.
DD: Disease duration; CRP: C-reactive protein; ESR: Erythrocyte sedimentation rate; JADAS: Juvenile arthritis disease activity score.
- Citation: Dong YQ, Wang W, Li J, Ma MS, Zhong LQ, Wei QJ, Song HM. Characterization of microbiota in systemic-onset juvenile idiopathic arthritis with different disease severities. World J Clin Cases 2019; 7(18): 2734-2745
- URL: https://www.wjgnet.com/2307-8960/full/v7/i18/2734.htm
- DOI: https://dx.doi.org/10.12998/wjcc.v7.i18.2734


