Copyright
©The Author(s) 2019.
World J Clin Cases. Aug 26, 2019; 7(16): 2238-2246
Published online Aug 26, 2019. doi: 10.12998/wjcc.v7.i16.2238
Published online Aug 26, 2019. doi: 10.12998/wjcc.v7.i16.2238
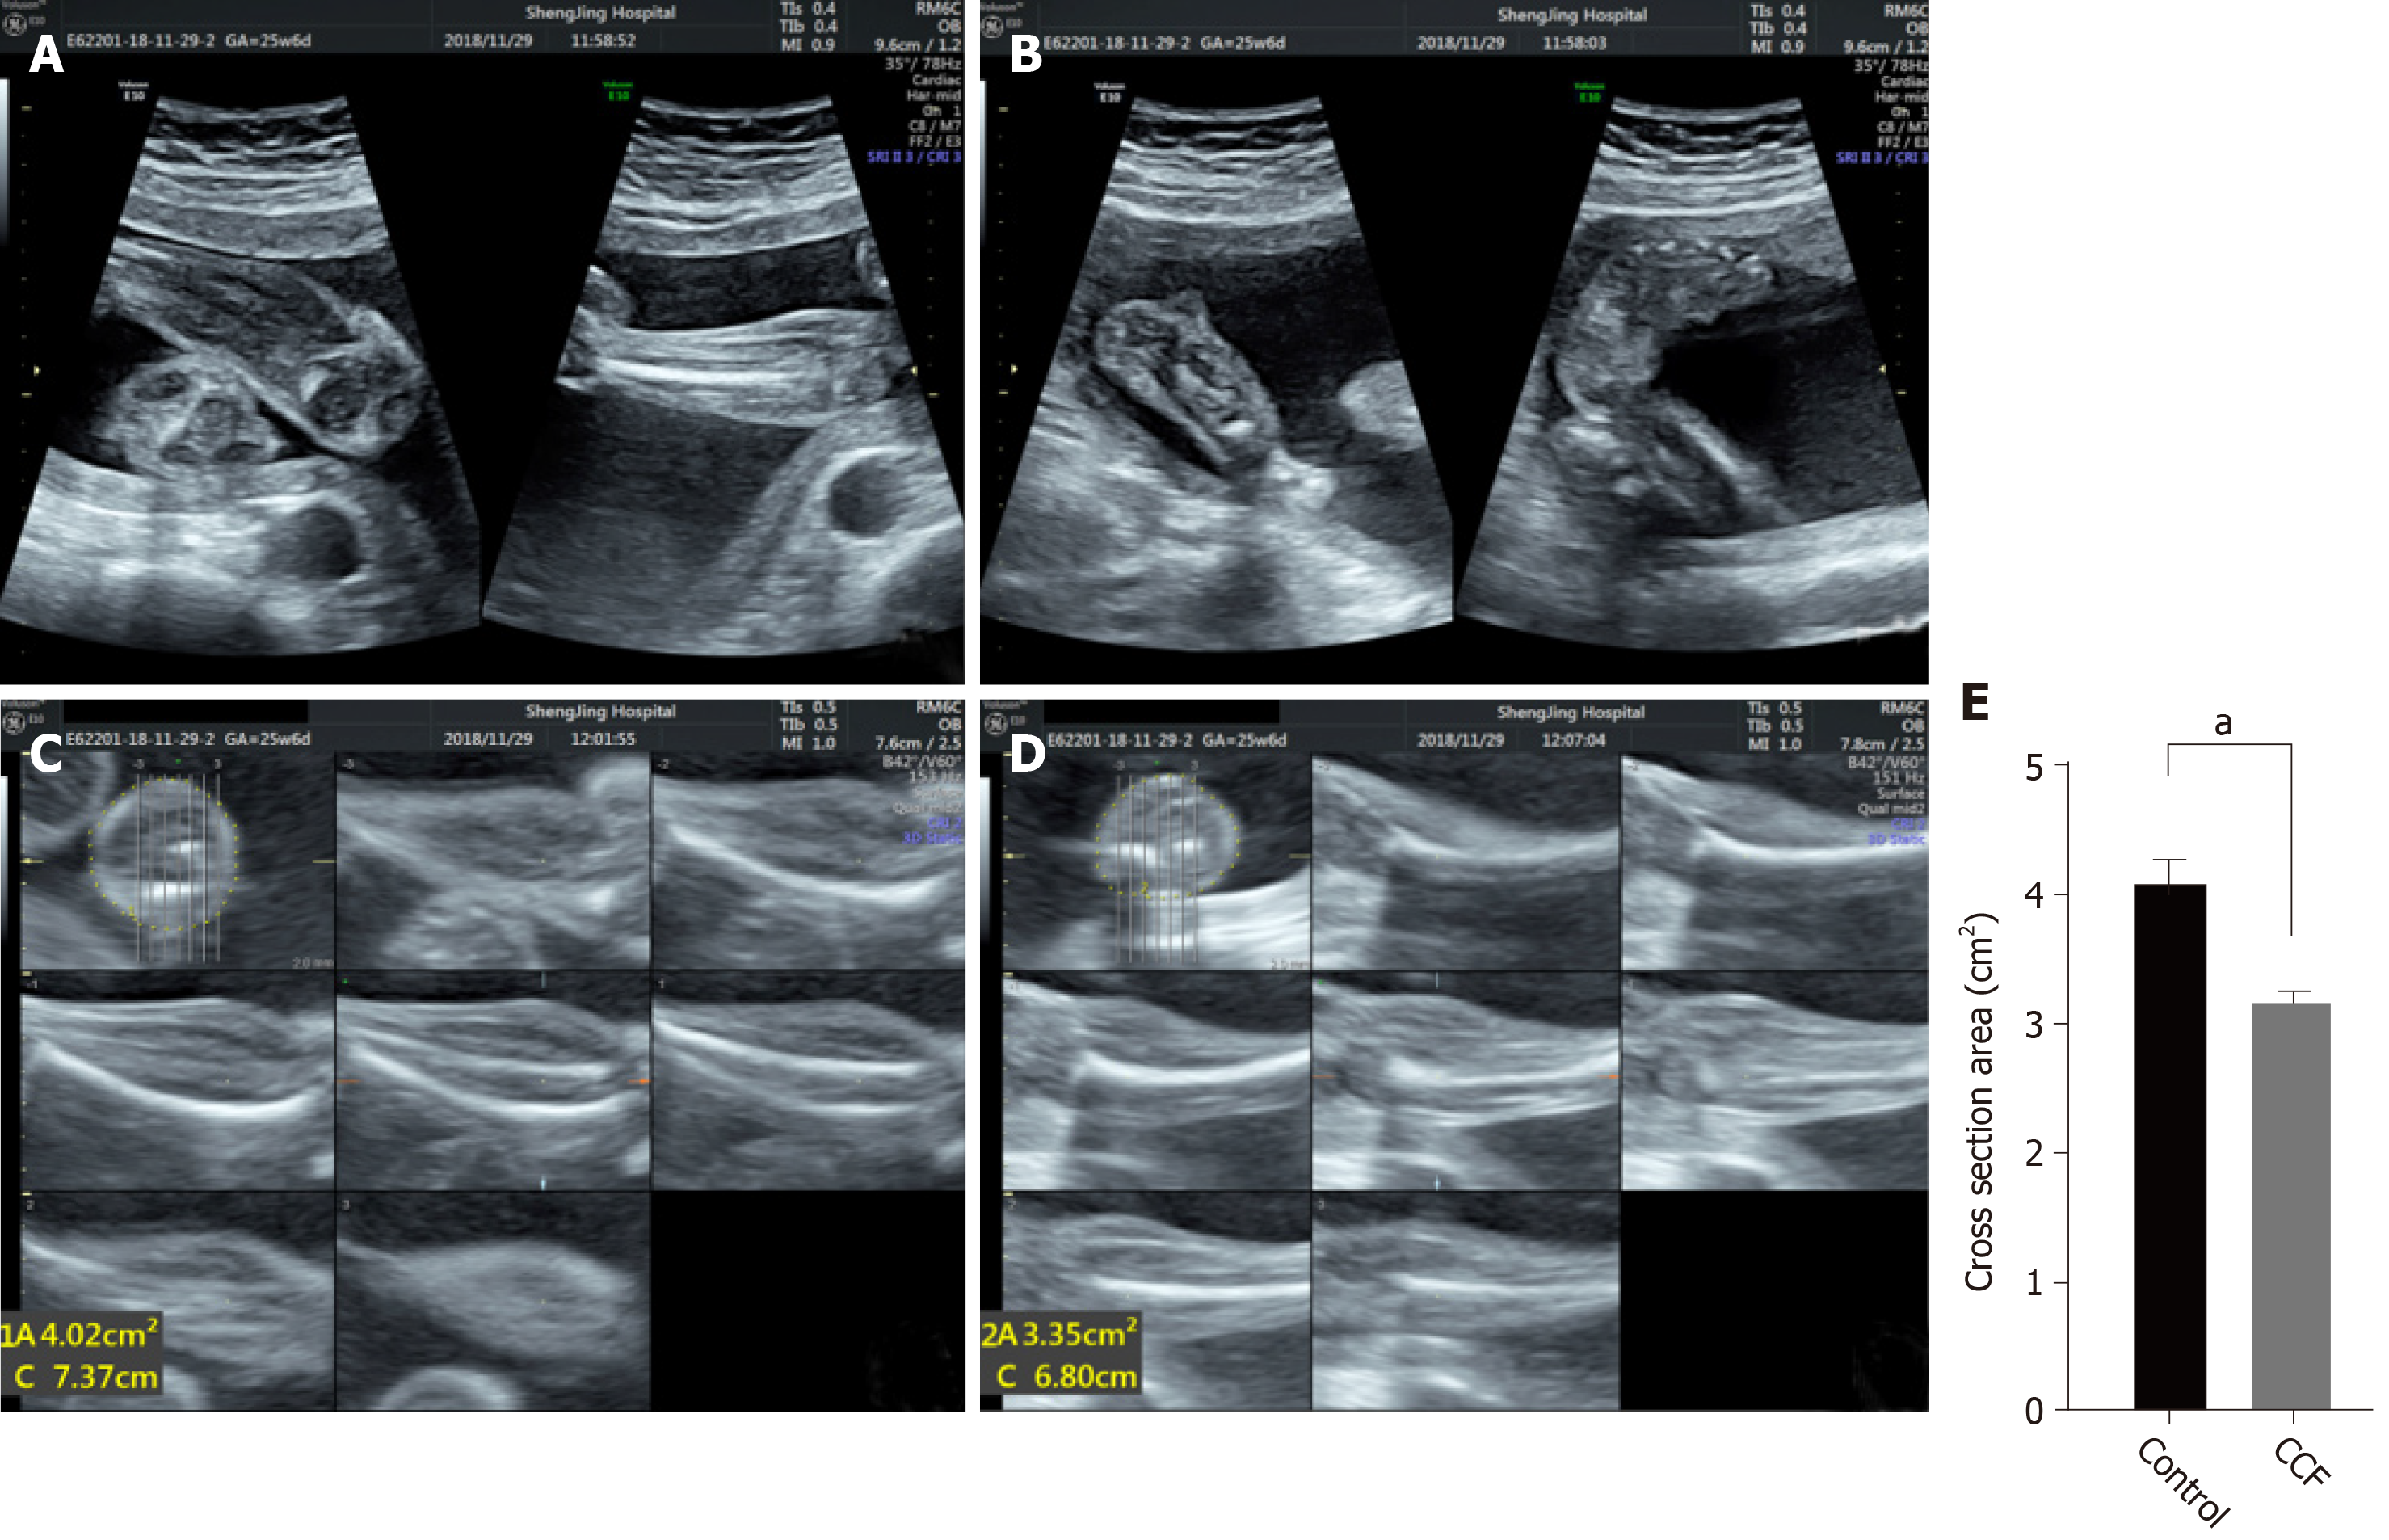
Figure 1 Identification with 2D or 3D ultrasound of muscle atrophy in fetus with clubfoot.
The 2D ultrasound image of calves (A) and feet (B). The left side shows the normal condition and the right side the clubfoot condition. The 3D tomographic ultrasound imaging [normal (C); clubfoot (D)] fixed the positioning line at the largest cross-section perpendicular to the tibia (center of the nine-square image), and measurement of the area was done at the cross-section image (upper left of the nine-square image); E: Quantitative data and statistical analysis of cross-section area in paired fetal calves. aP < 0.05 vs control.
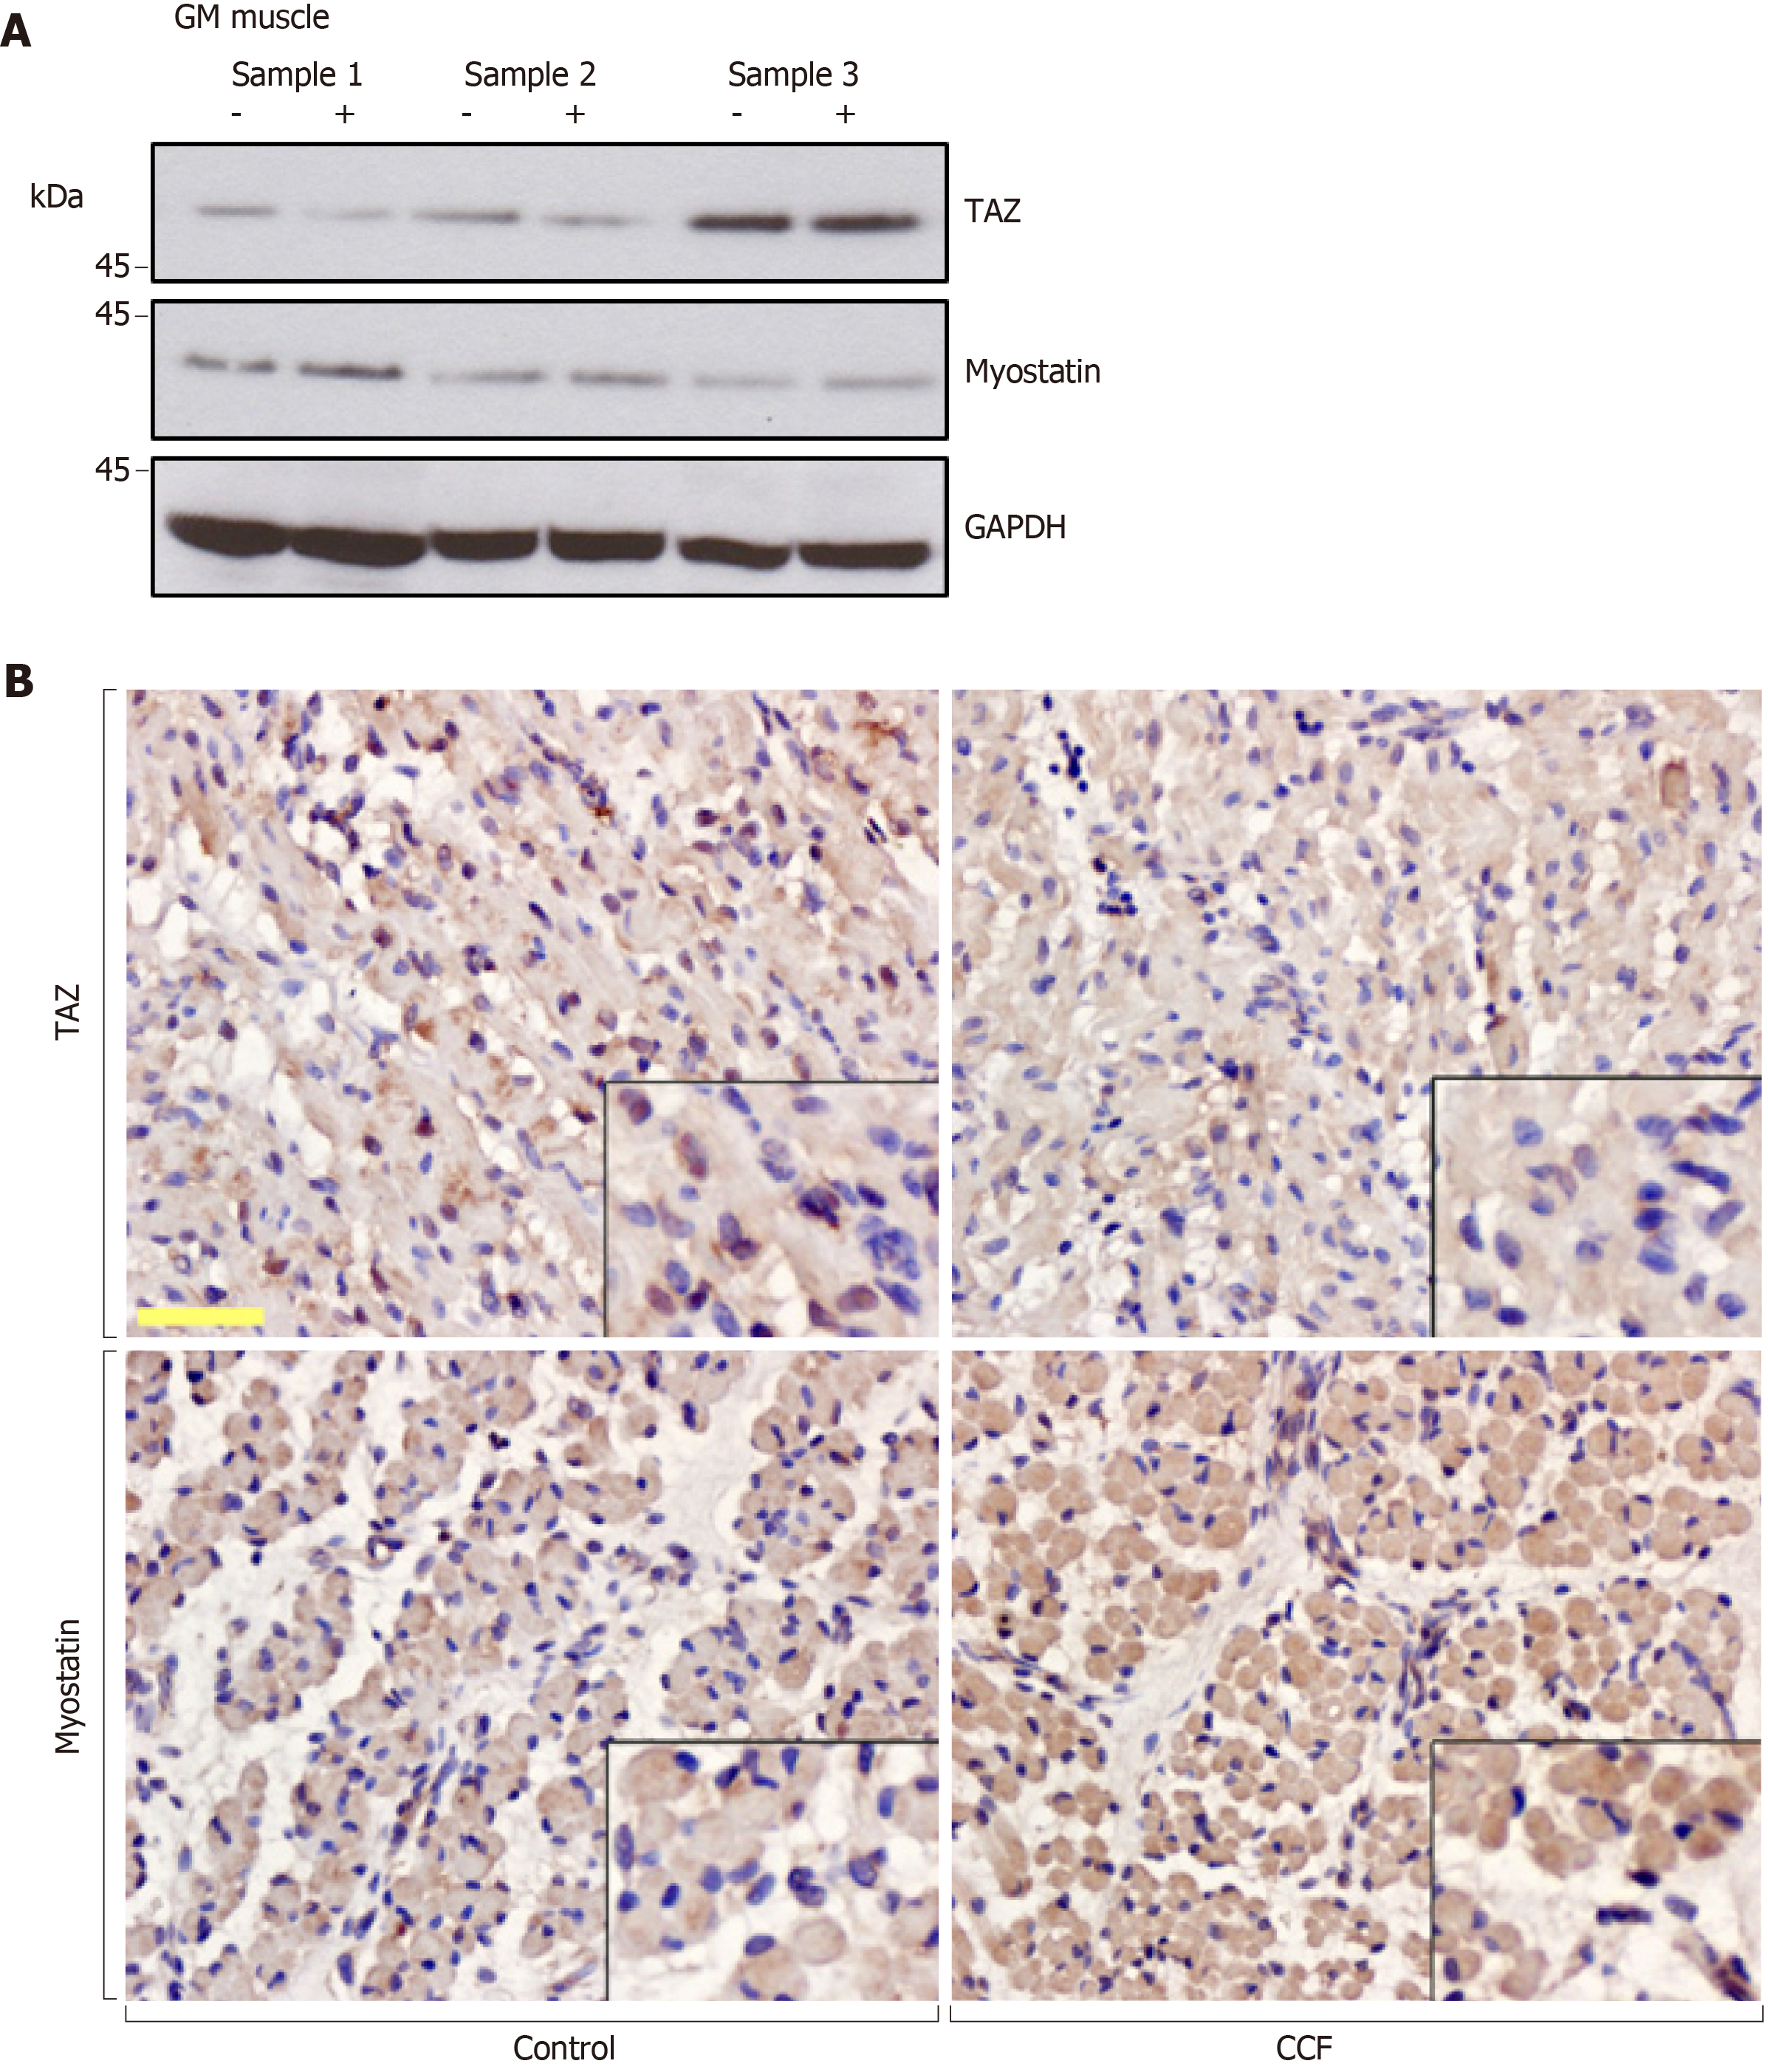
Figure 2 Expression of TAZ and myostatin in gastrocnemius muscles of fetus with congenital neurogenic clubfoot.
A: Paired muscle specimens from three different fetuses are shown: normal limb (−); varus limb (+). Western blotting shows protein expression; GAPDH was used as the loading control; B: Immunohistochemical staining showed muscle fiber morphology and expression and location of TAZ and myostatin. Bar: 100 μm.
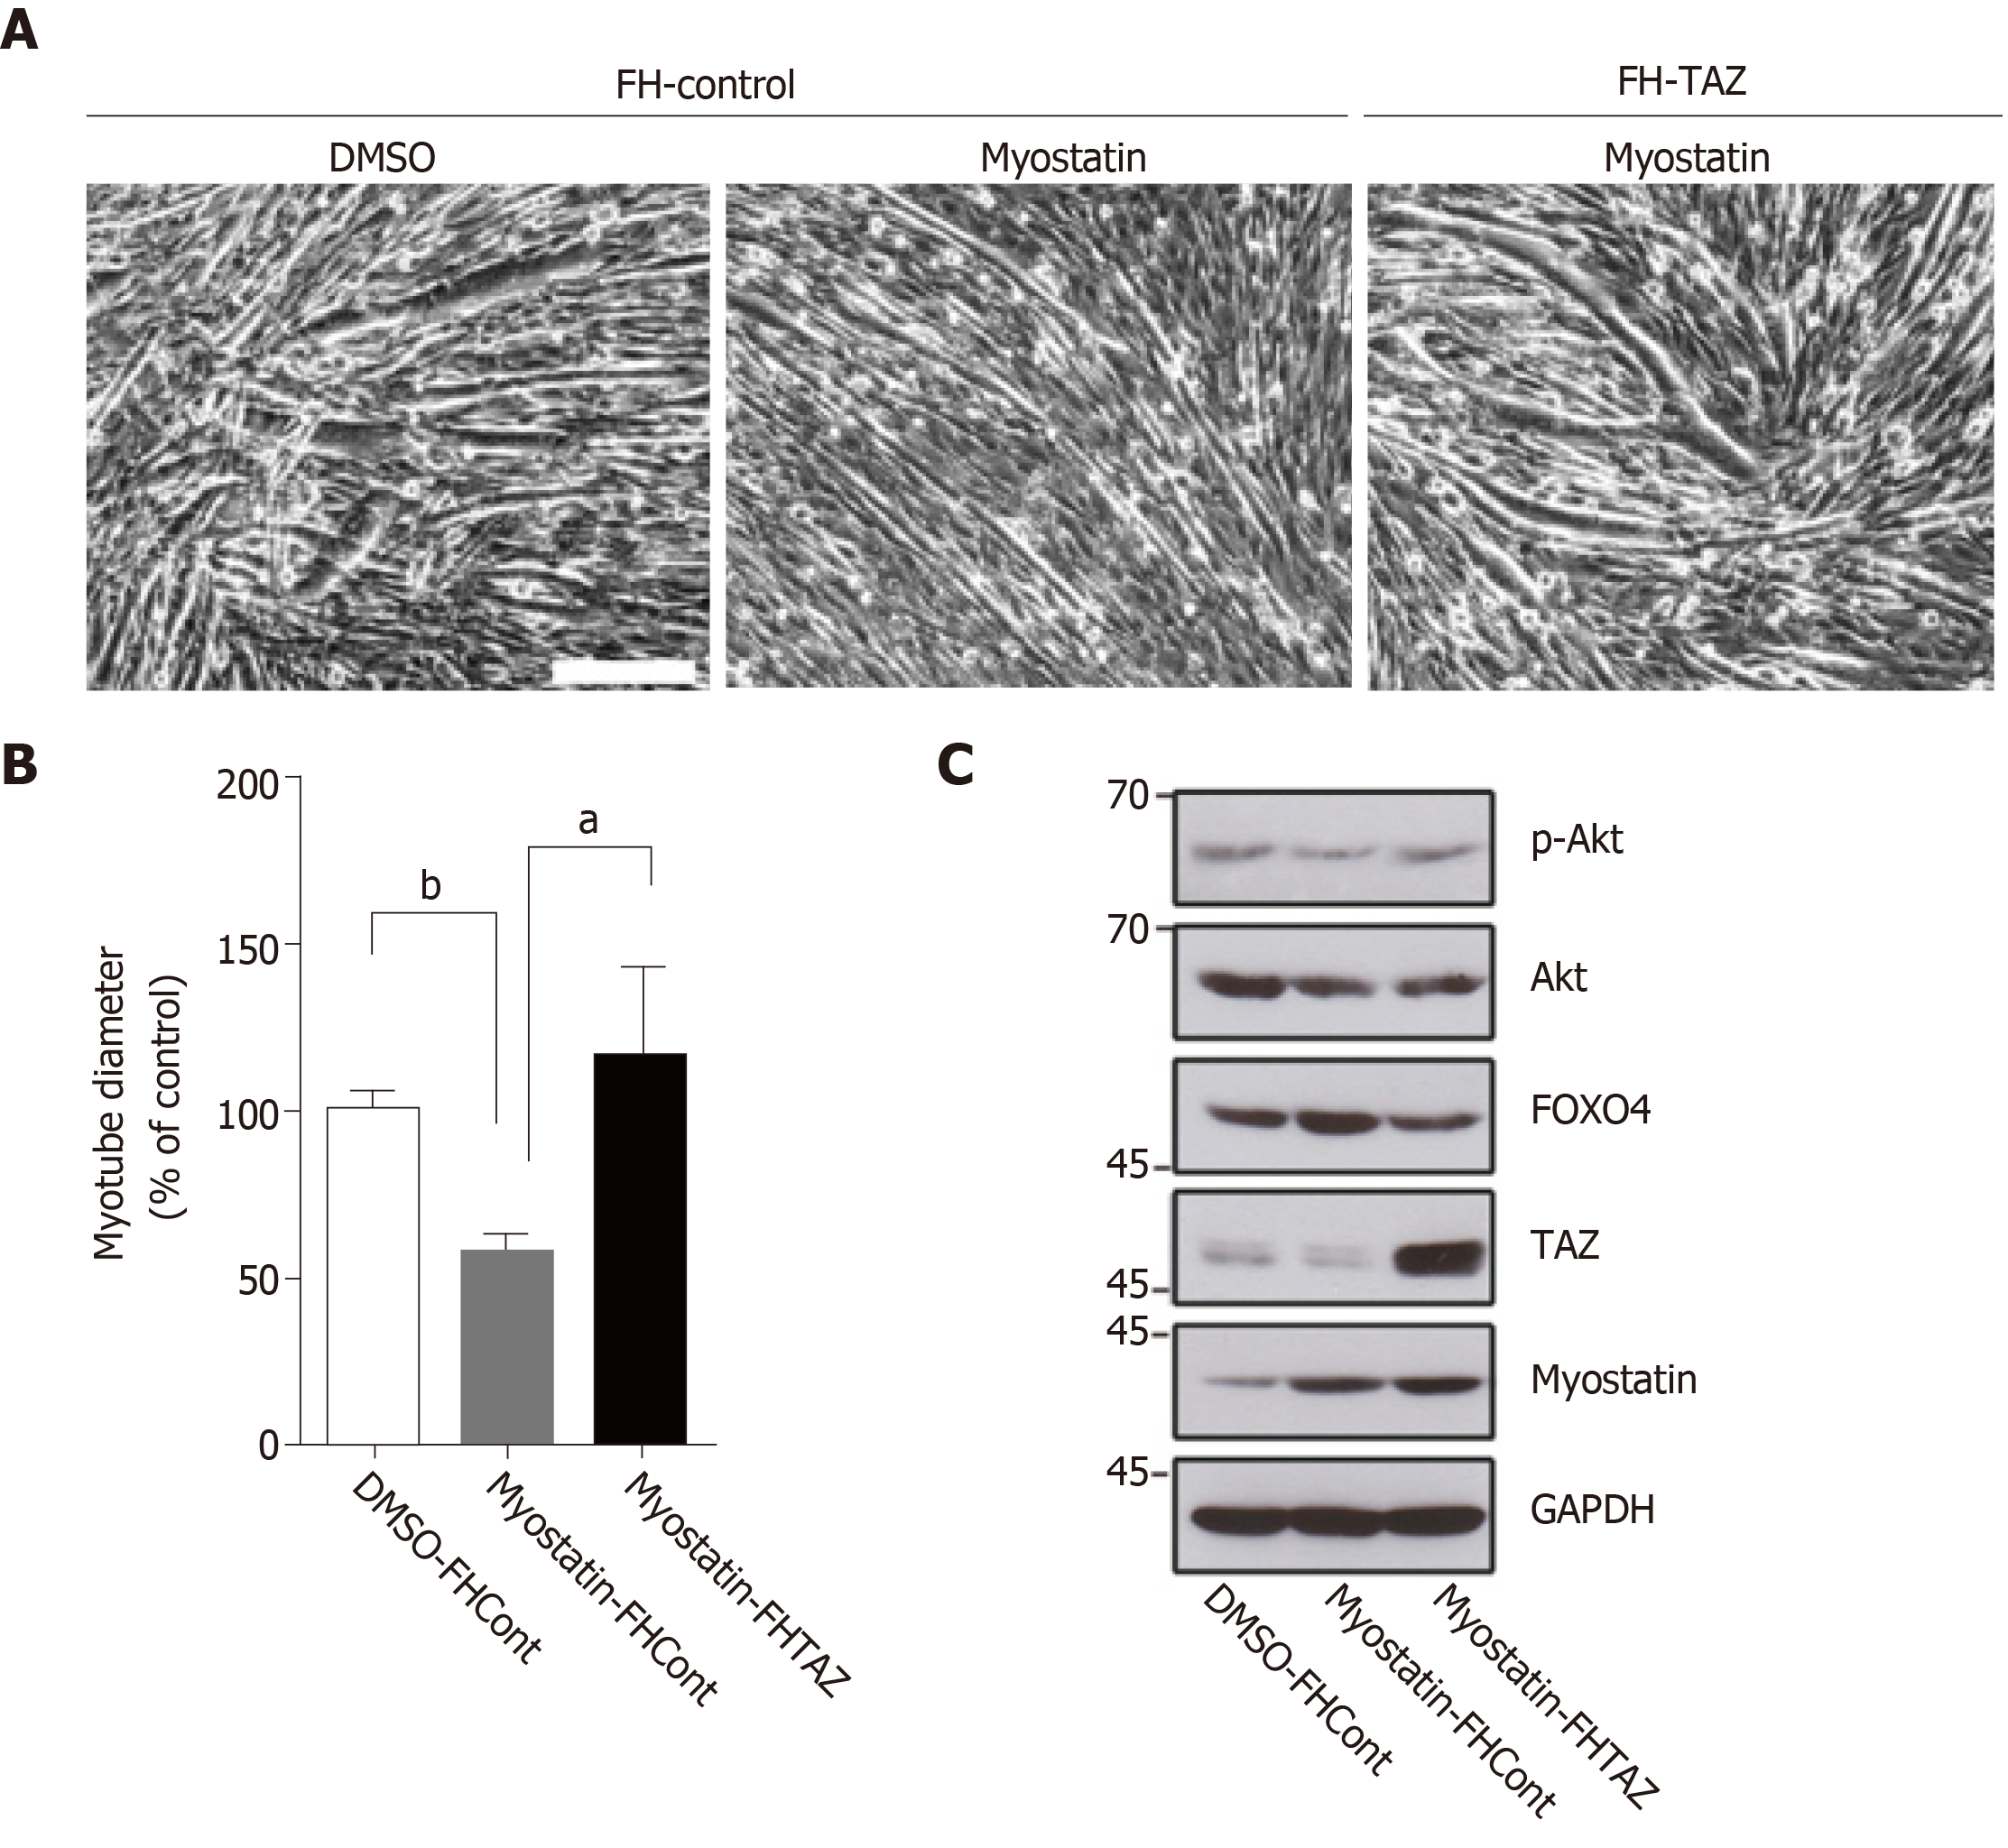
Figure 3 Myotube formation in each group of C2C12 cells and protein expression.
A: Images of the myotube formation. Bar: 100 μm; B: Quantitative data and statistical analysis of myotube diameter in each group. aP < 0.05, bP < 0.01; C: Western blotting showing protein expression; GAPDH was used as the loading control.
- Citation: Sun JX, Yang ZY, Xie LM, Wang B, Bai N, Cai AL. TAZ and myostatin involved in muscle atrophy of congenital neurogenic clubfoot. World J Clin Cases 2019; 7(16): 2238-2246
- URL: https://www.wjgnet.com/2307-8960/full/v7/i16/2238.htm
- DOI: https://dx.doi.org/10.12998/wjcc.v7.i16.2238


