Copyright
©The Author(s) 2019.
World J Clin Cases. May 26, 2019; 7(10): 1161-1168
Published online May 26, 2019. doi: 10.12998/wjcc.v7.i10.1161
Published online May 26, 2019. doi: 10.12998/wjcc.v7.i10.1161
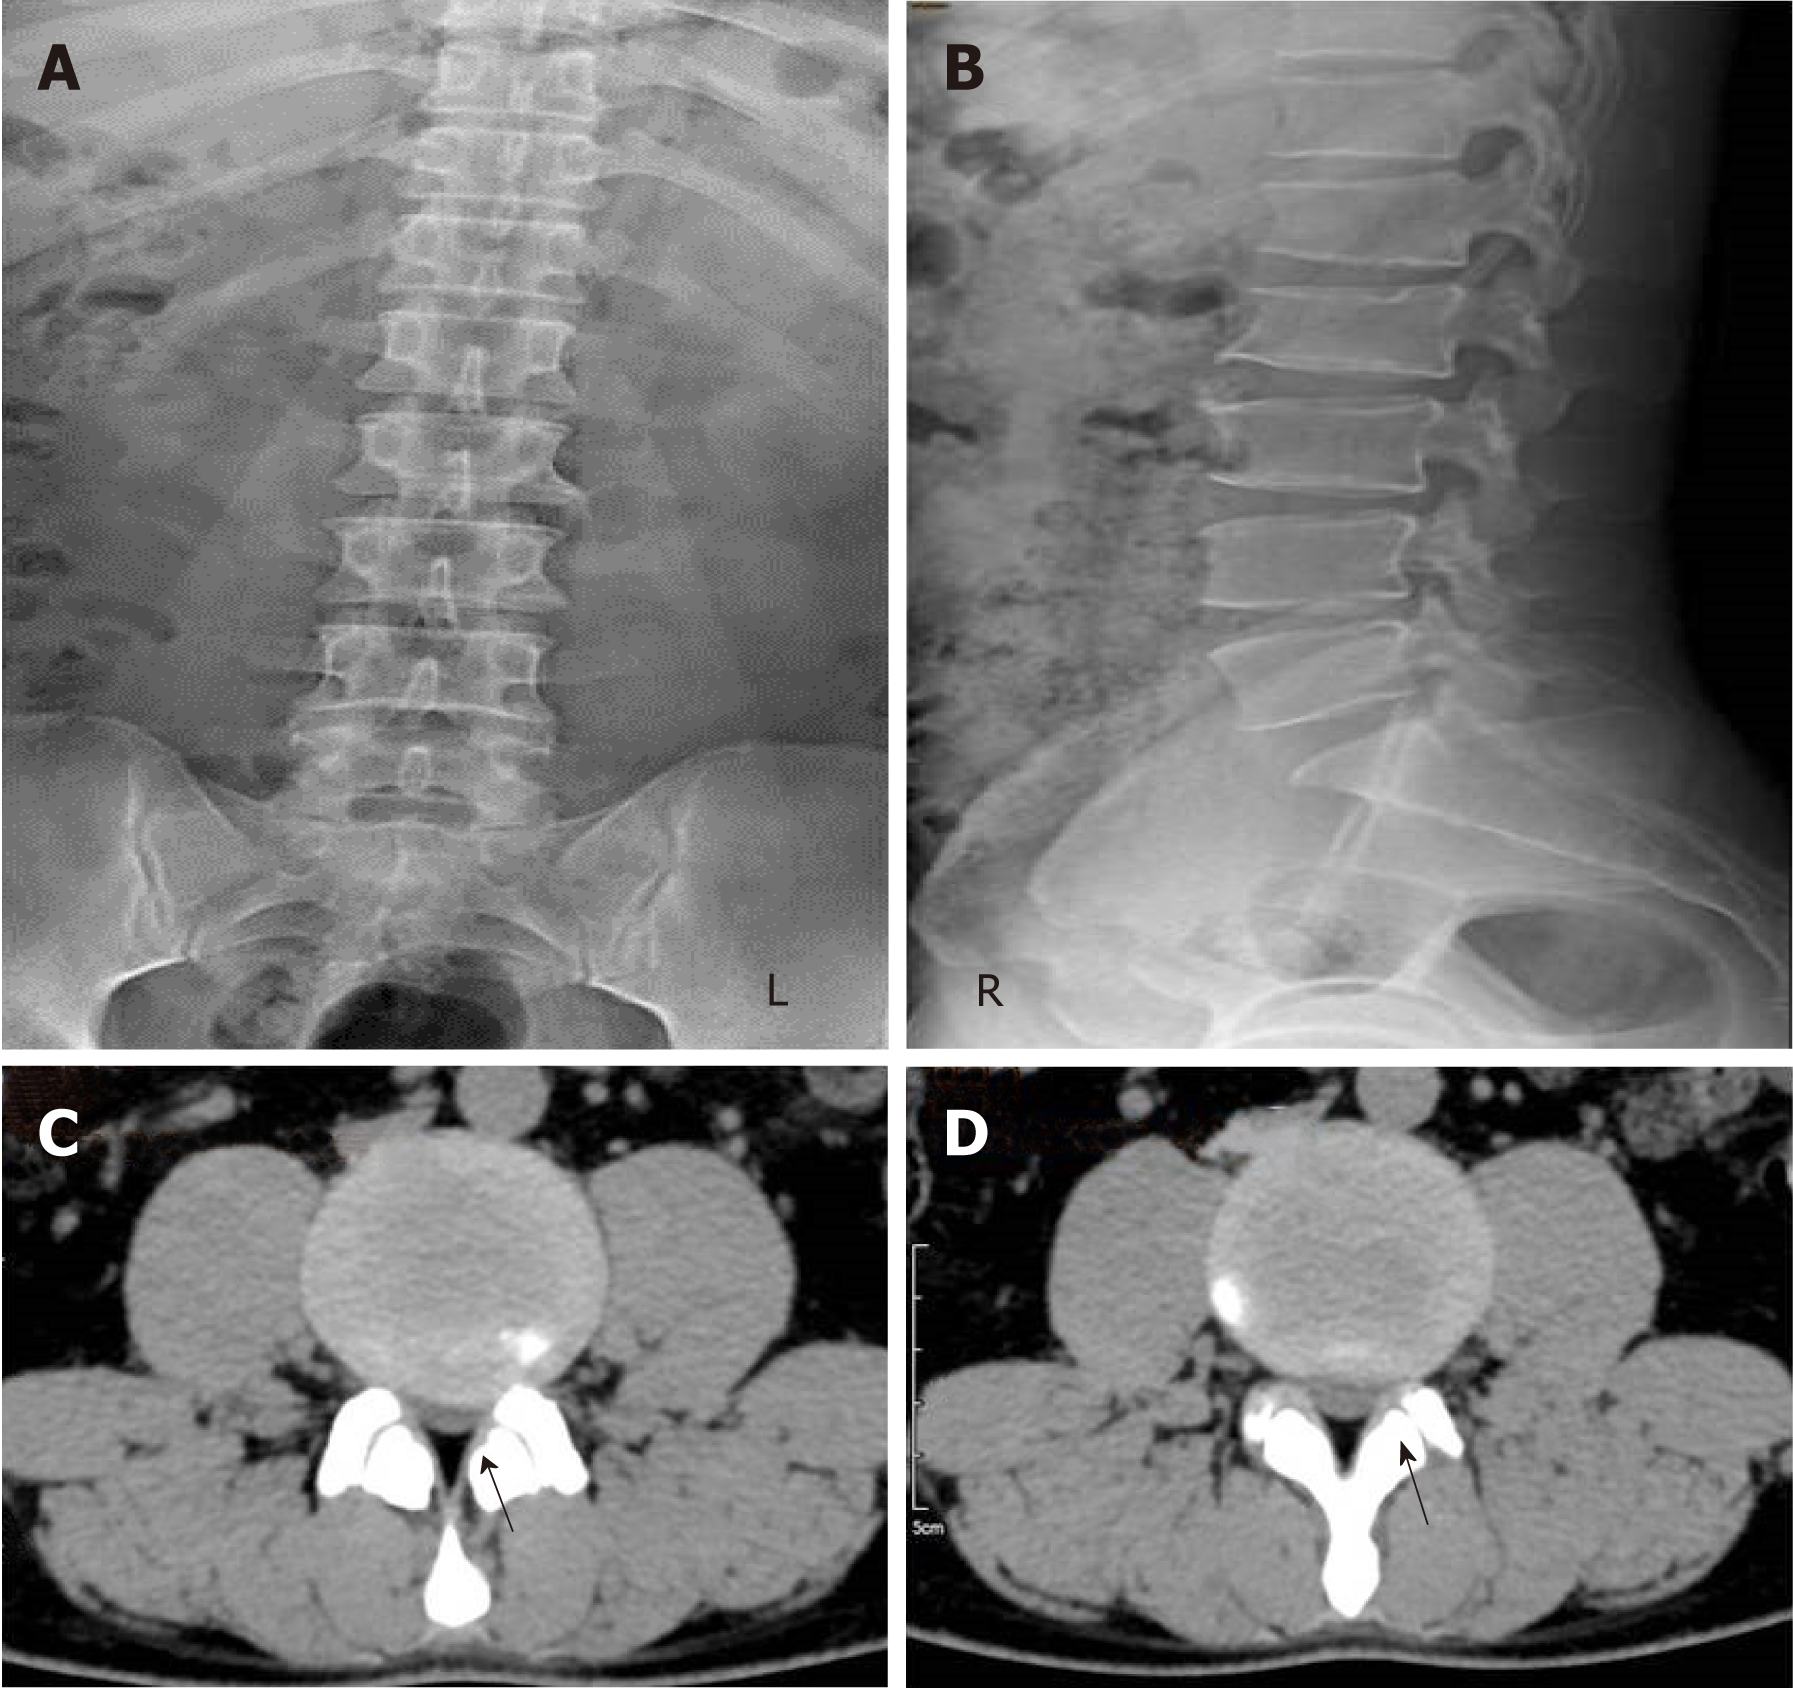
Figure 1 X-ray and computed tomography transverse images of the patient.
A and B: X-ray images showing small curvature of the lumbar spine; C: Computed tomography (CT) image suggesting L3-4 disc herniation (black arrow, left margin type); D: CT image suggesting L4-5 disc herniation (black arrow, left margin type).
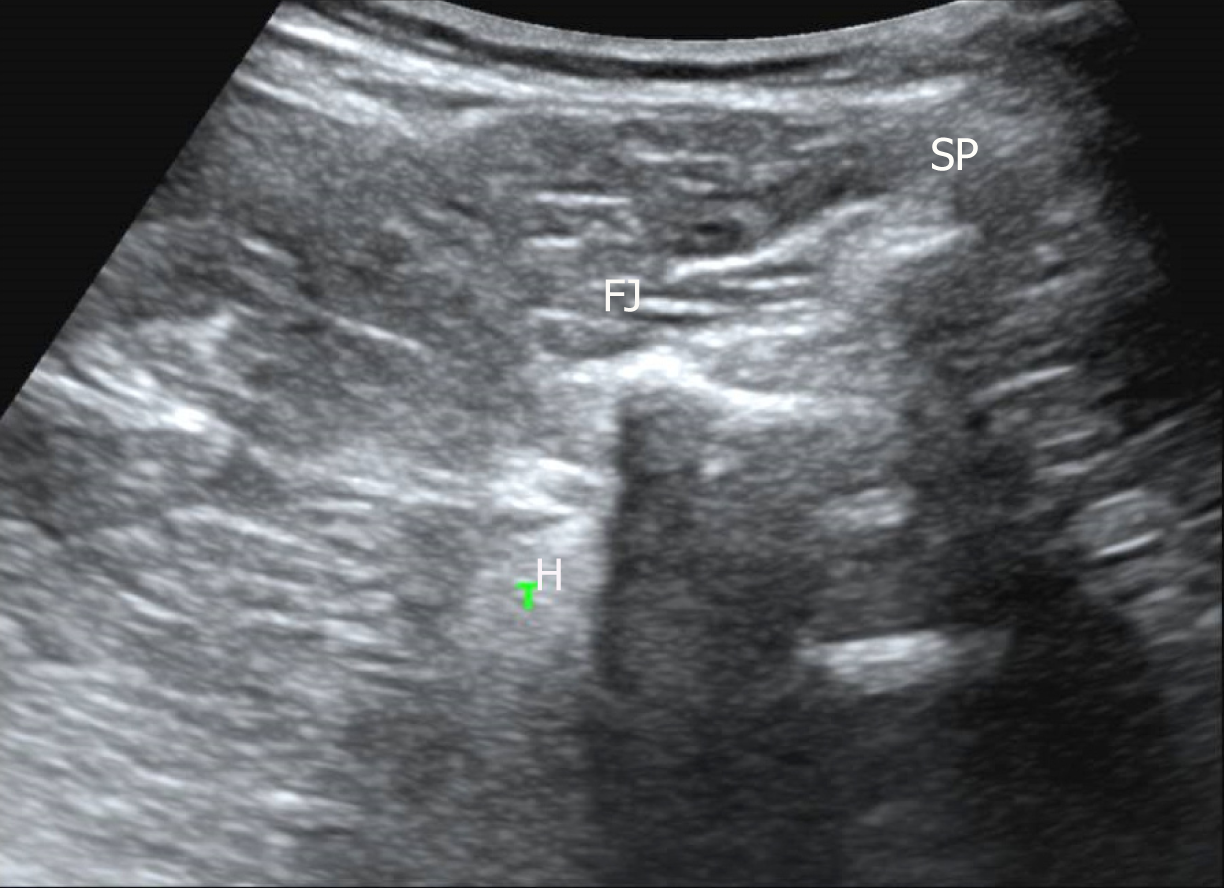
Figure 2 Transverse ultrasound image of the lumbar spine.
SP: Spinous process; FJ: Facet joint; HZ: Hyperechoic area.
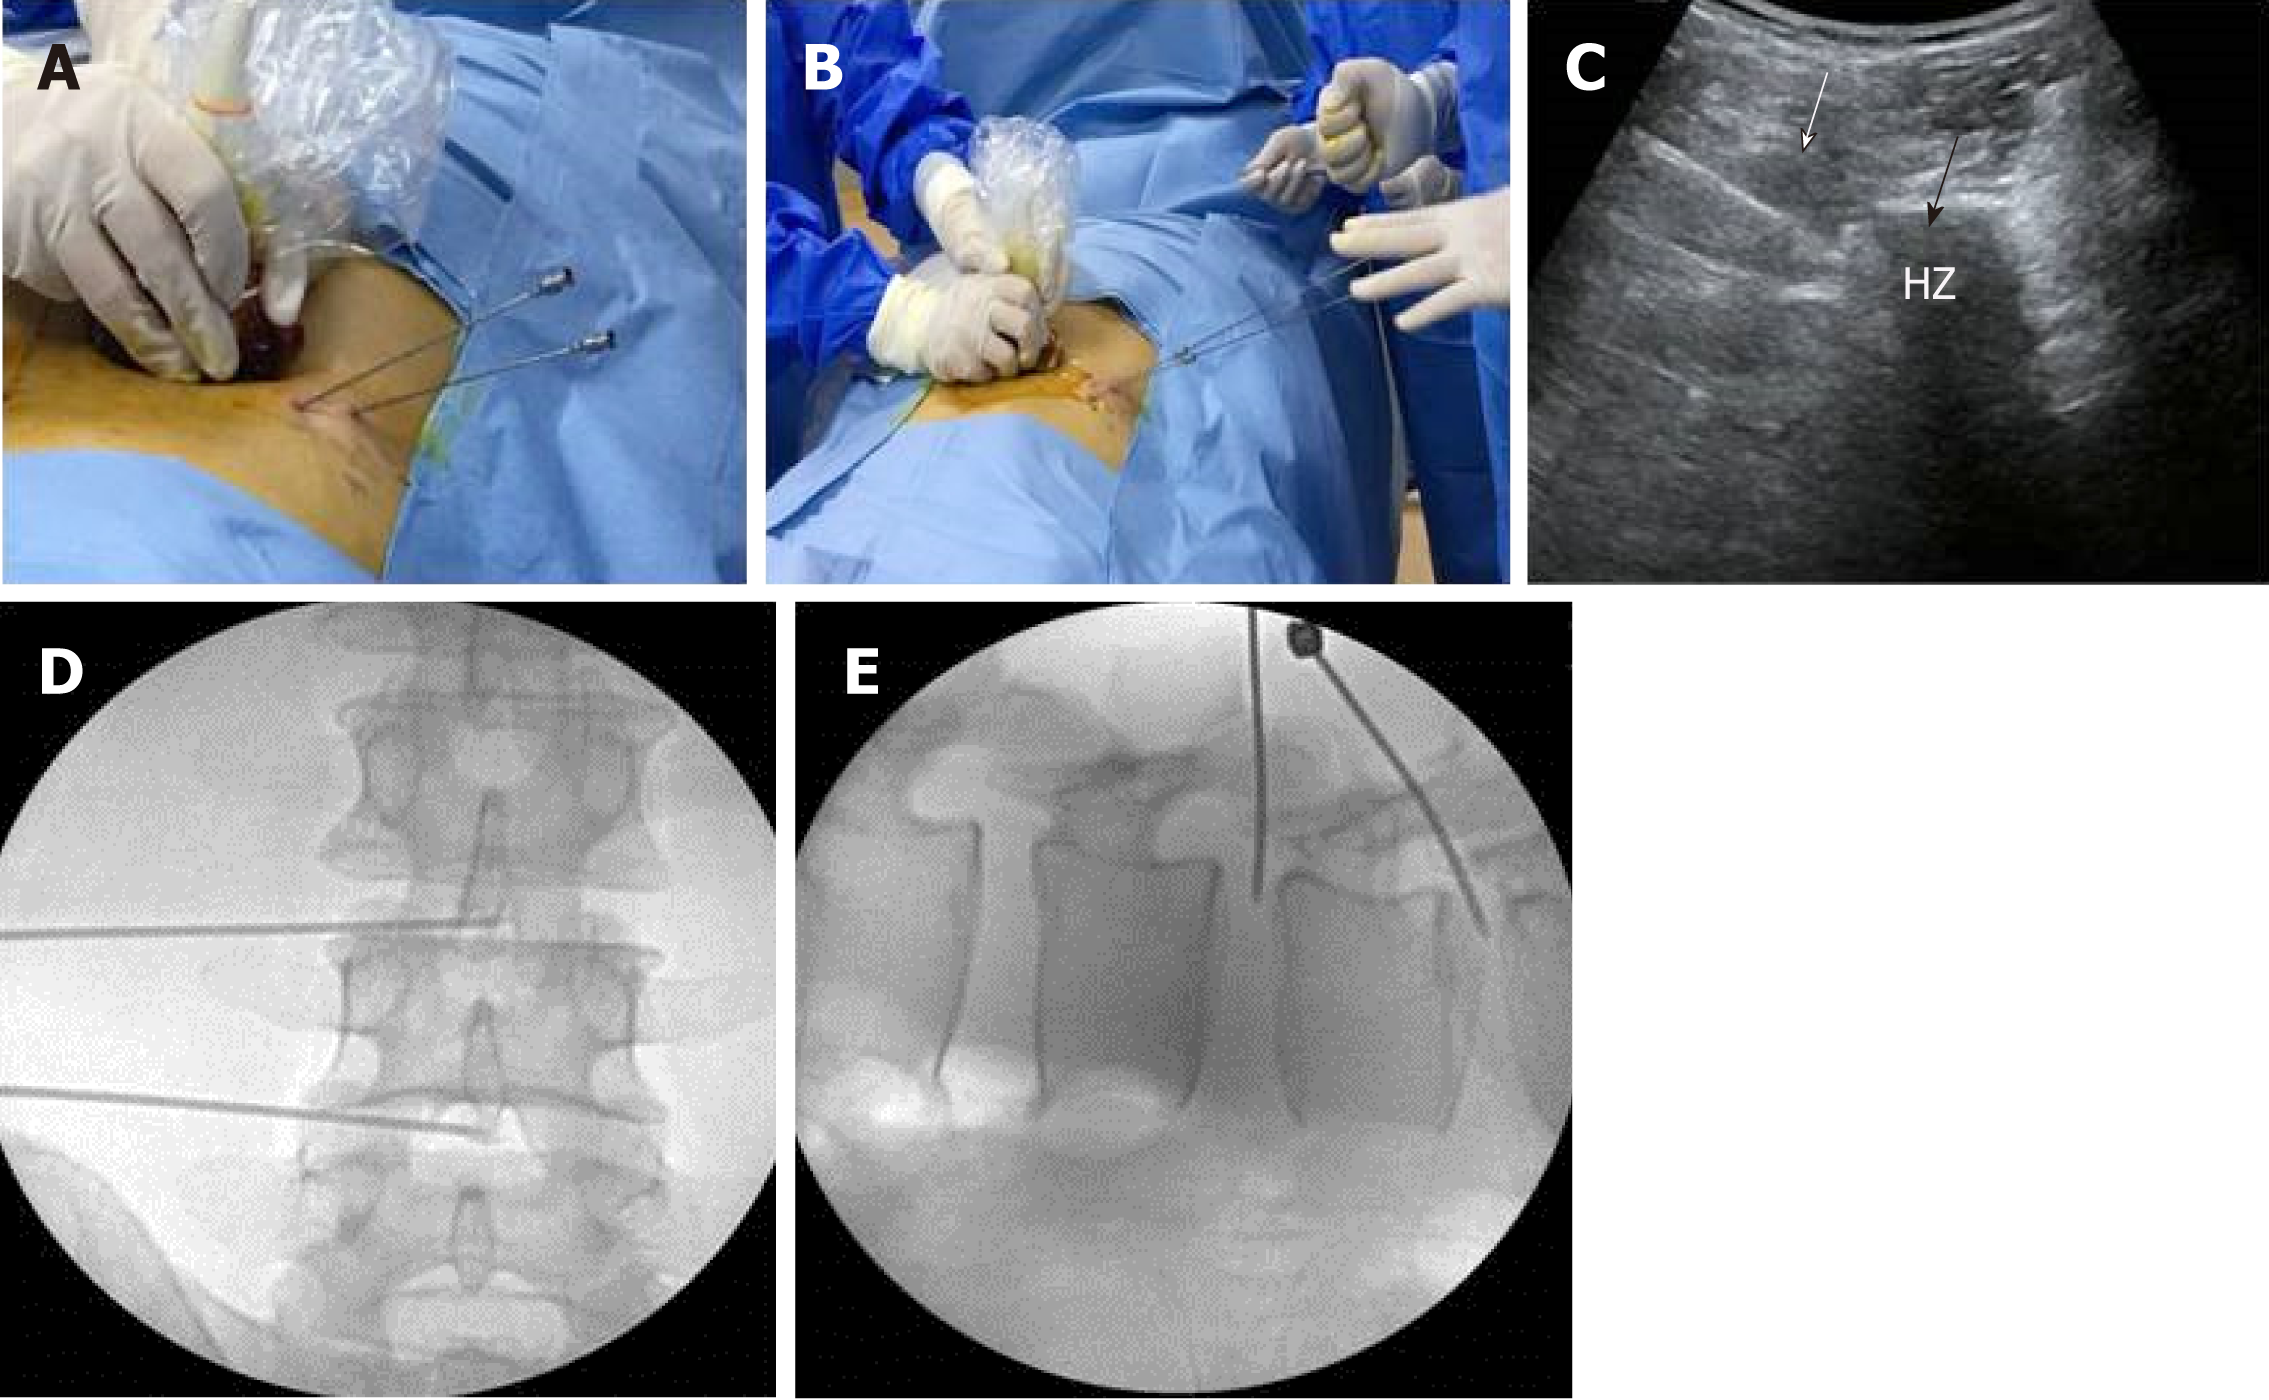
Figure 3 Puncture process of the two spinal needles.
A: Ultrasound (US)-guided insertion of the two needles; B: Guidewires were then inserted through the two needles; C: US image of one needle (black arrow indicates the tip of the needle; white arrow indicates the track of the needle); D: Position of the needles in the anteroposterior X-ray image; E: Position of the needles in the lateral X-ray image.
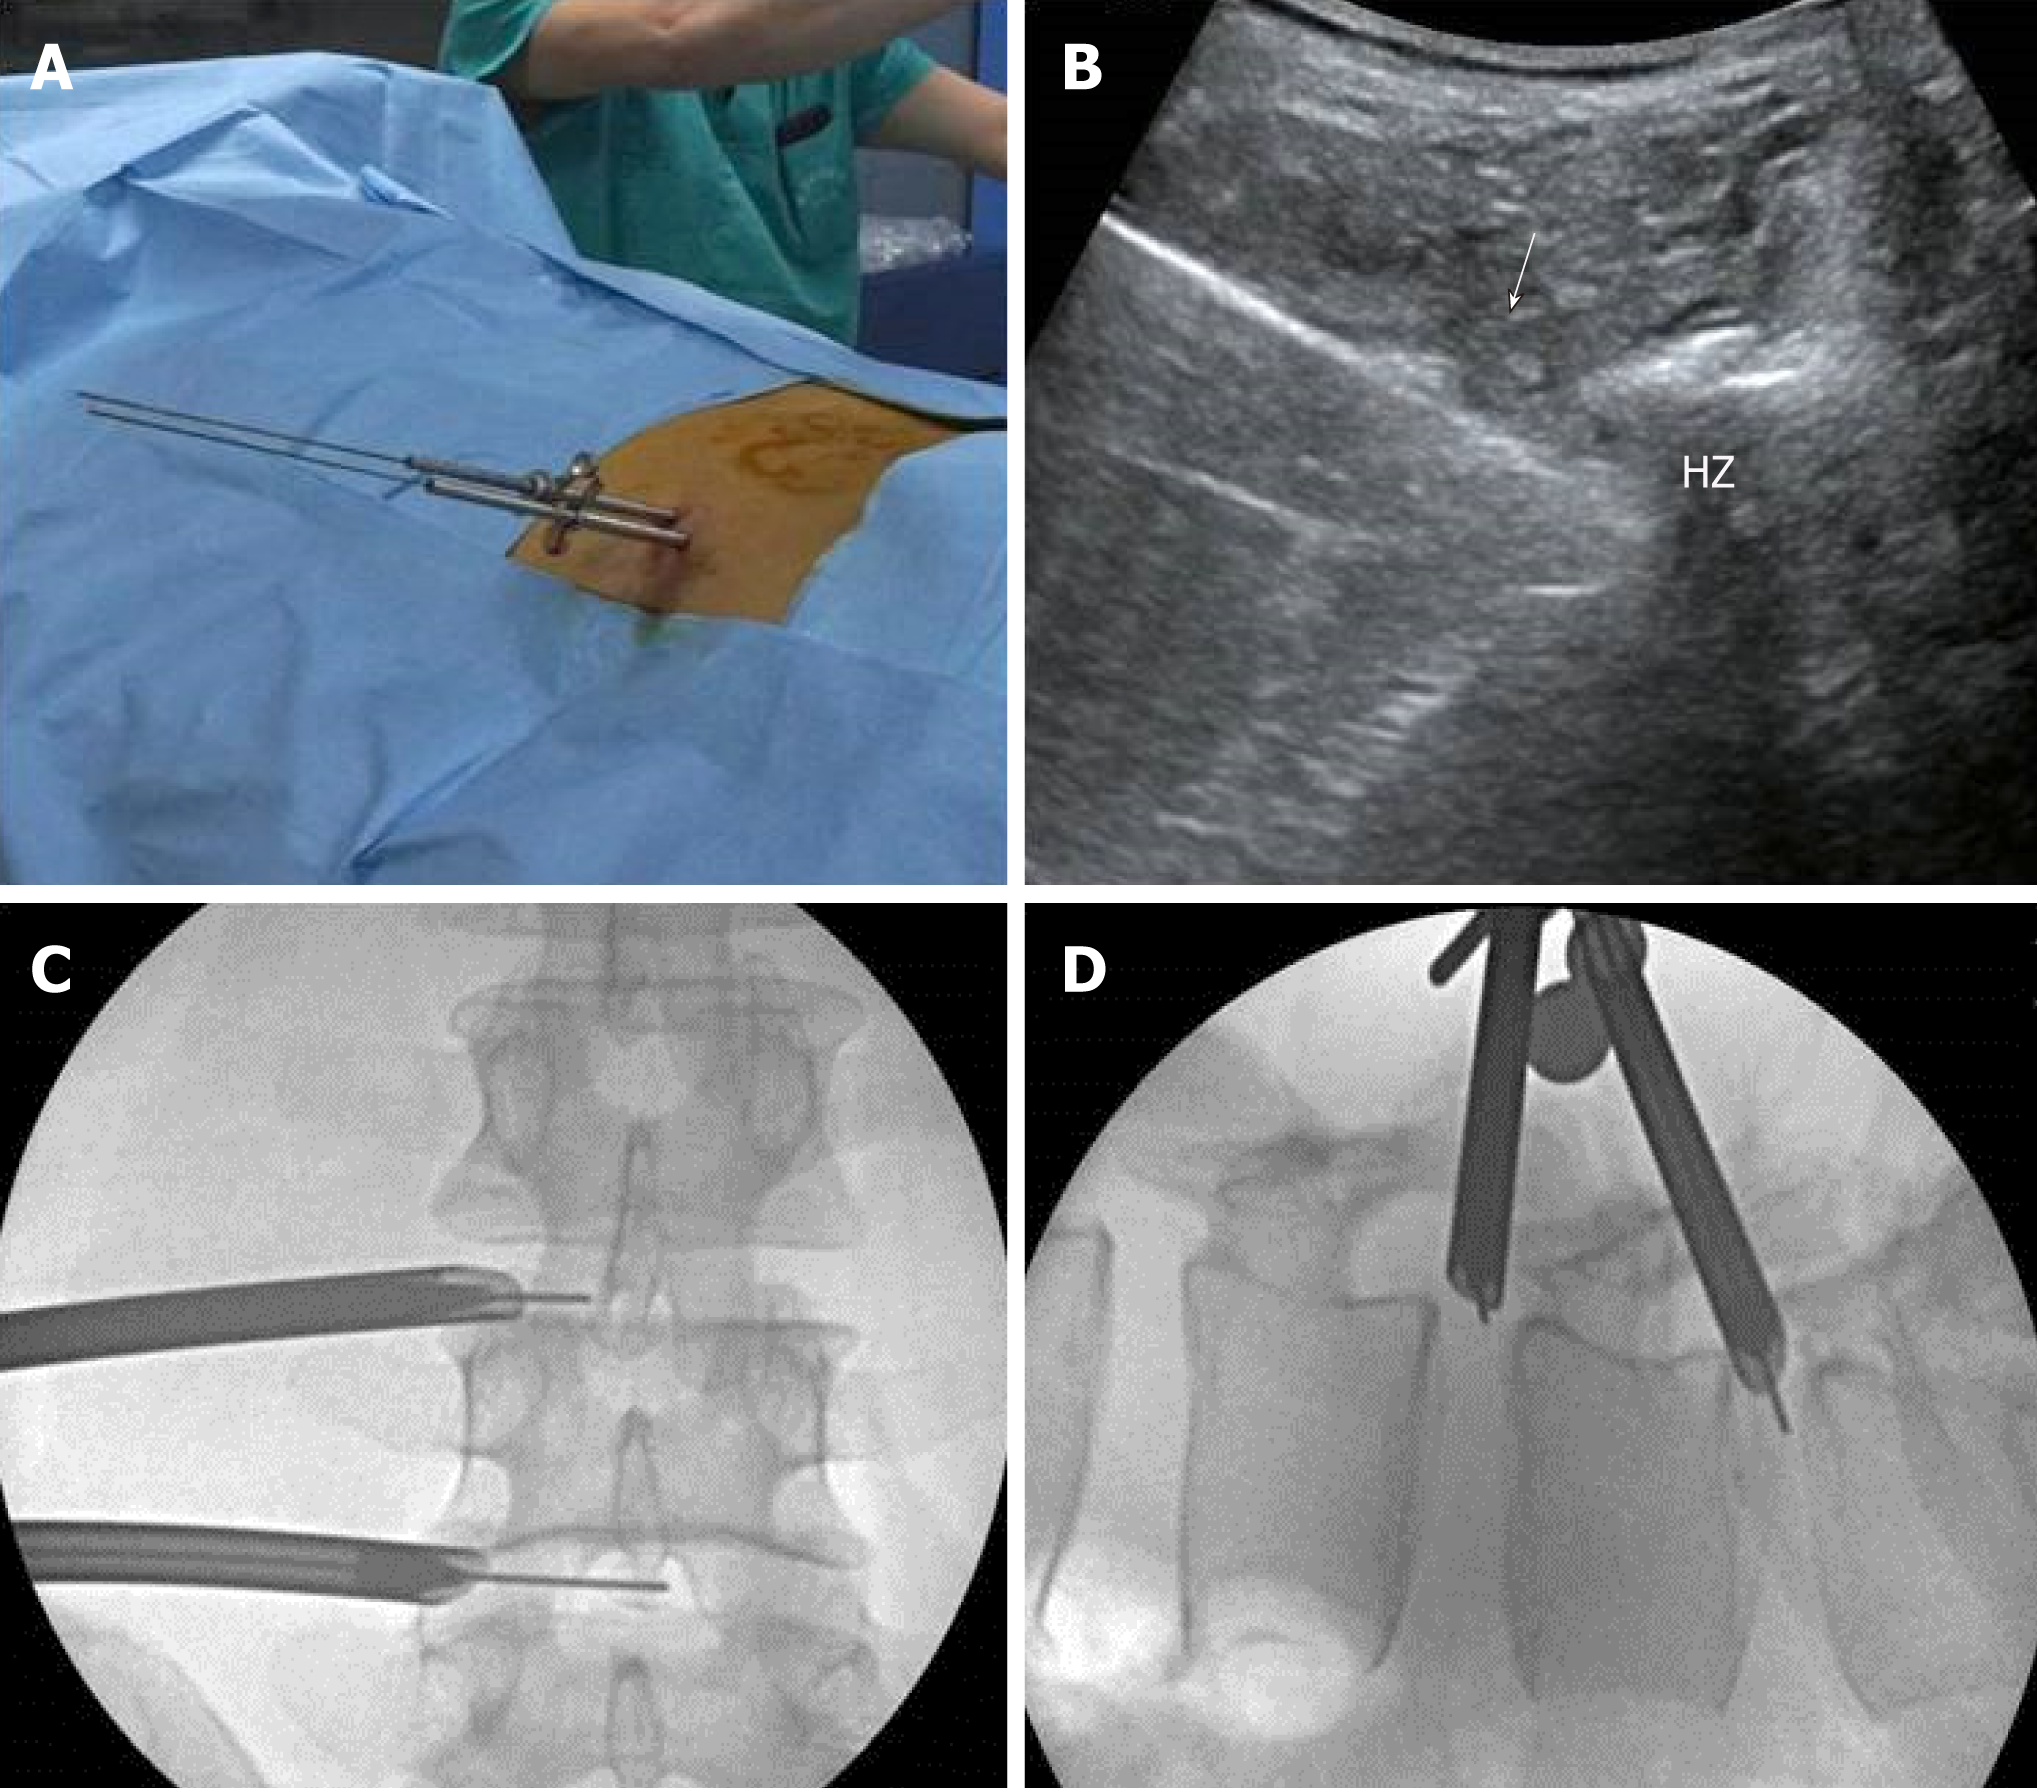
Figure 4 Cannulation process of the two endoscope outer sheaths.
A: The endoscope outer sheaths were inserted through the guidance wire; B: Ultrasound (US) image of one sheath (white arrow indicates the track of the sheath; the tip of the sheath was hidden in the US shadow and could not be displayed); C: Position of the sheaths in the anteroposterior X-ray image; D: Position of the sheaths in the lateral X-ray image.
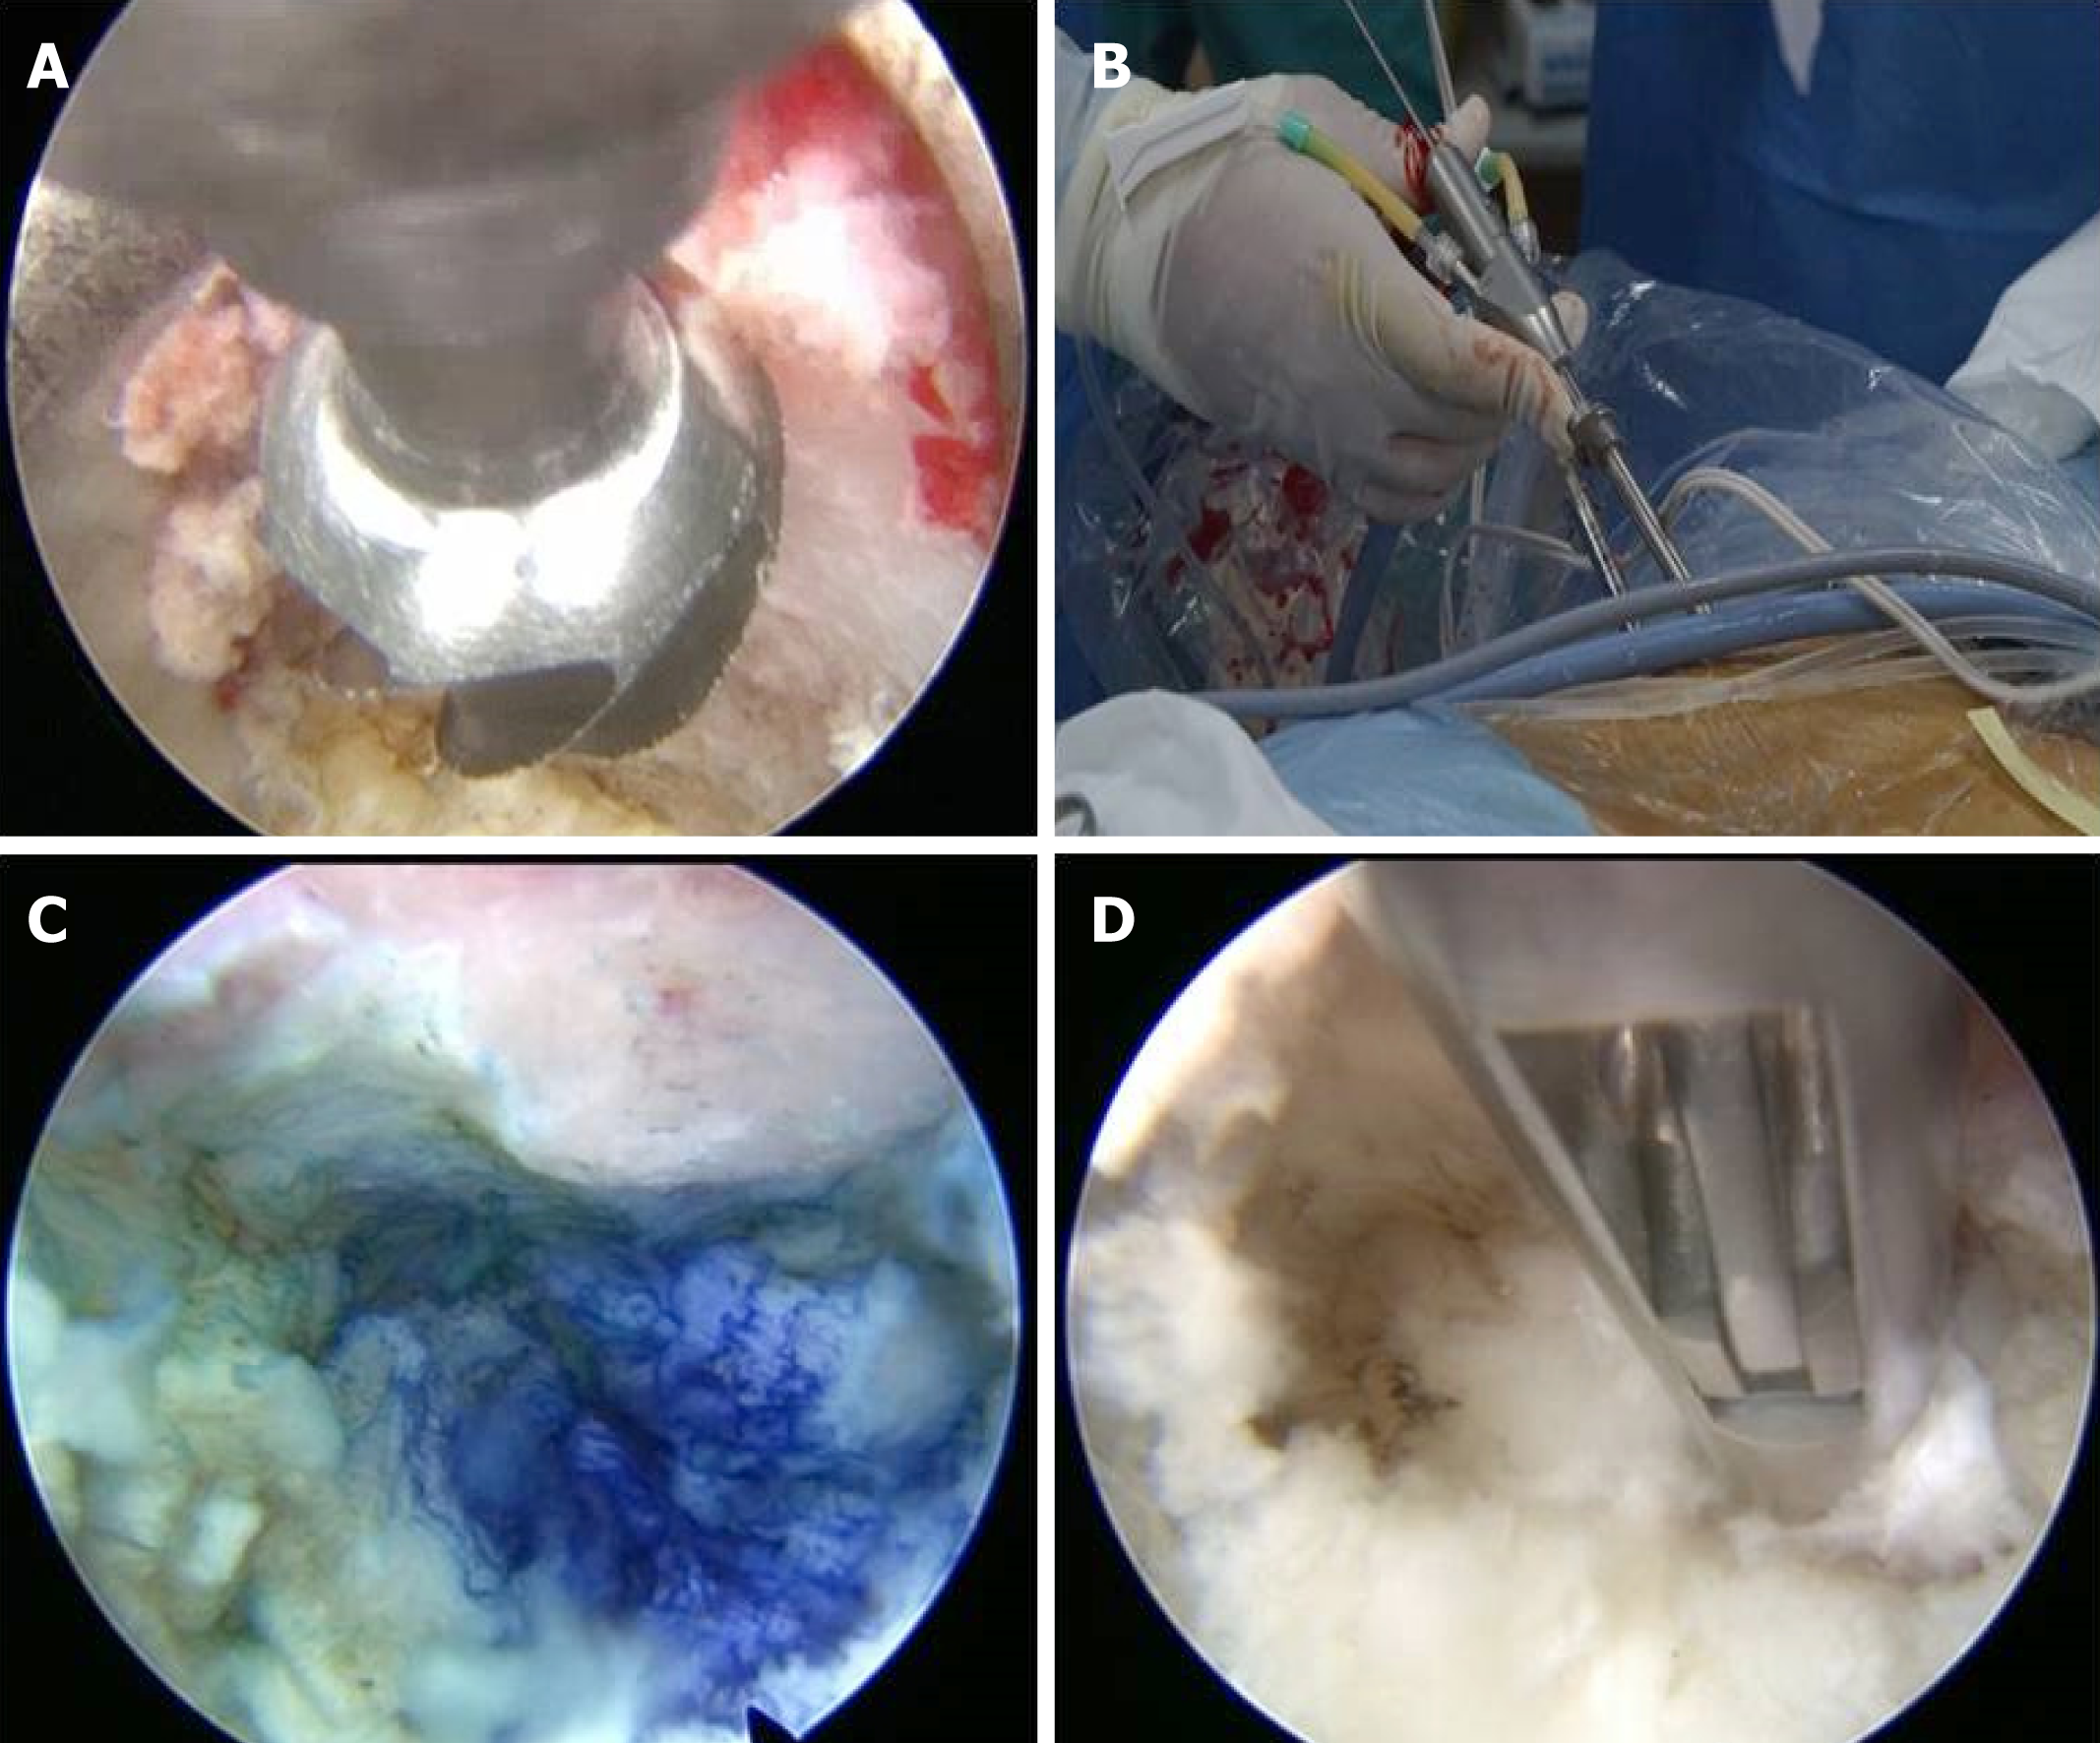
Figure 5 Percutaneous endoscopic lumbar discectomy for lumbar disc herniation at two levels.
A: Partial hypertrophied facetectomy was performed using a 3.0-mm endoscopic lateral bur; B: Percutaneous endoscopic lumbar discectomy was performed for lumbar disc herniation at two levels at the same time; C: Direct visualization of the blue dye in the protruding intervertebral disc through the endoscope; D: The protruding intervertebral disc was removed to decompress the spinal nerve.
Figure 6 Straight leg elevations before and after percutaneous endoscopic lumbar discectomy.
A: Straight leg elevation was 40 degrees before percutaneous endoscopic lumbar discectomy (PELD); B: Straight leg elevation increased to 90 degrees after PELD.
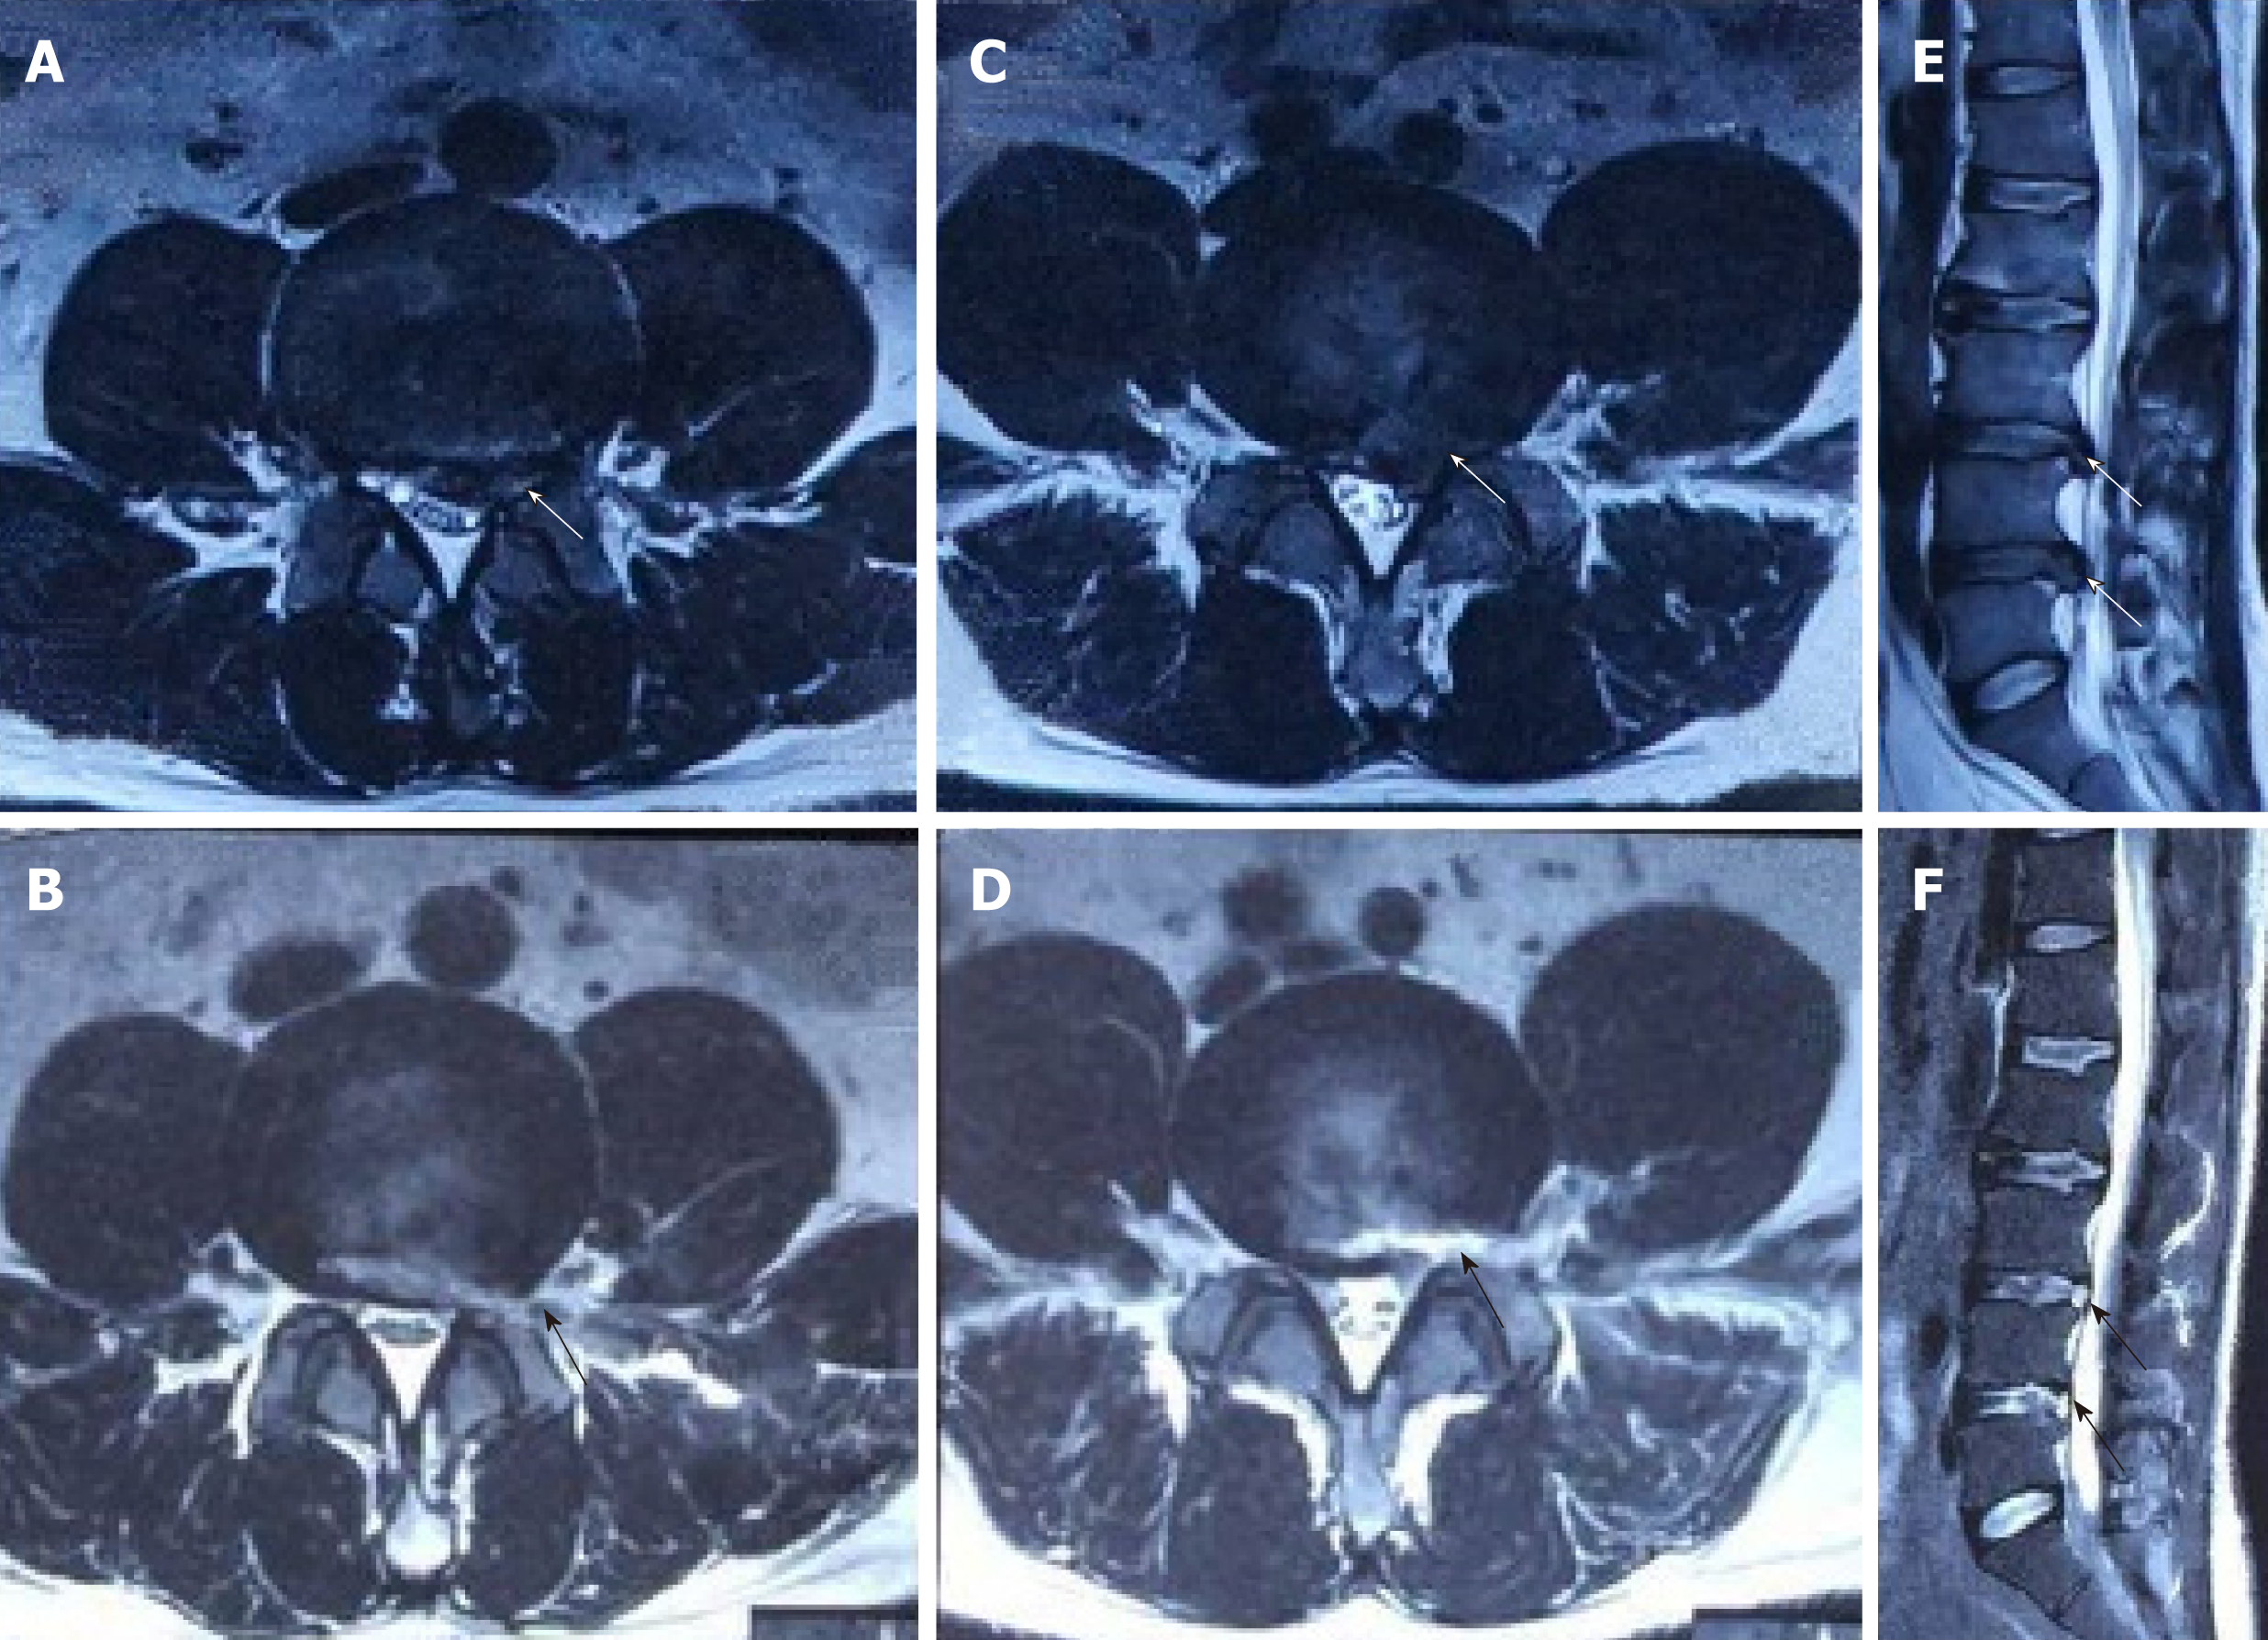
Figure 7 Lumbar spine magnetic resonance imaging before and after percutaneous endoscopic lumbar discectomy.
A: Transverse section suggesting L3-4 disc herniation (white arrow, left margin type); B: Same section 1 day after percutaneous endoscopic lumbar discectomy (PELD) (black arrow indicates disappearance of the herniation); C: Transverse section suggesting L4-5 disc herniation (white arrow, left margin type); D: Same section 1 day after PELD (black arrow indicates disappearance of the herniation); E: Sagittal section suggesting L3-4 and L4-5 disc herniations (white arrows); F: Same section 1 d after PELD (black arrows indicate disappearance of the herniations).
- Citation: Zhang MB, Yan LT, Li SP, Li YY, Huang P. Ultrasound guidance for transforaminal percutaneous endoscopic lumbar discectomy may prevent radiation exposure: A case report. World J Clin Cases 2019; 7(10): 1161-1168
- URL: https://www.wjgnet.com/2307-8960/full/v7/i10/1161.htm
- DOI: https://dx.doi.org/10.12998/wjcc.v7.i10.1161


