Copyright
©The Author(s) 2018.
World J Clin Cases. Sep 6, 2018; 6(9): 301-307
Published online Sep 6, 2018. doi: 10.12998/wjcc.v6.i9.301
Published online Sep 6, 2018. doi: 10.12998/wjcc.v6.i9.301
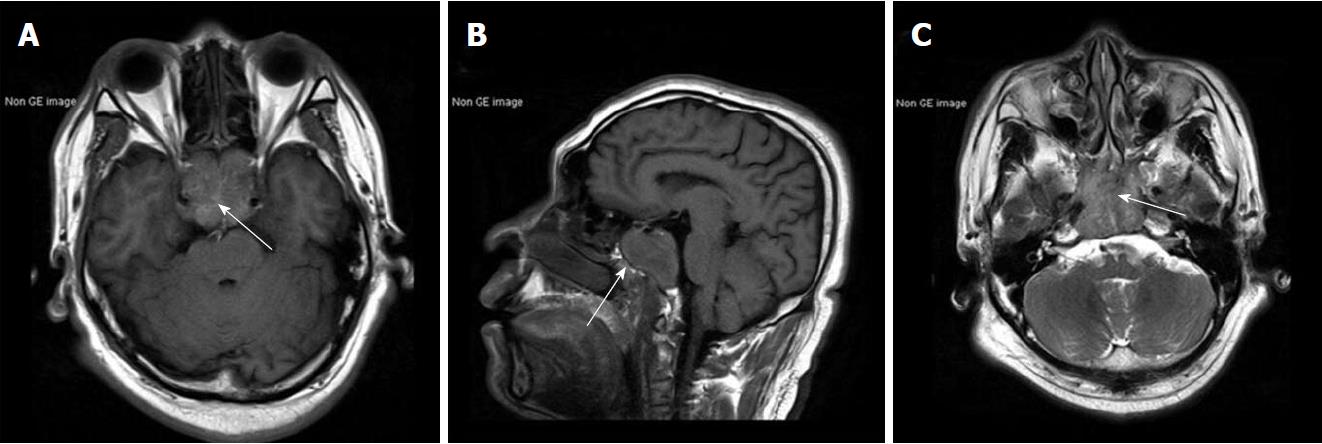
Figure 1 Brain magnetic resonance images.
A: Axial T1-weighted magnetic resonance imaging (MRI) showing isointense mass (white arrow) with encasement of the bilateral carotid arteries; B: Sagittal T1-weighted MRI showing sphenoid sinuses involvement (white arrow); C: Axial T2-weighted MRI showing hyperintense central areas suggest cyst degeneration or central necrosis (white arrow).
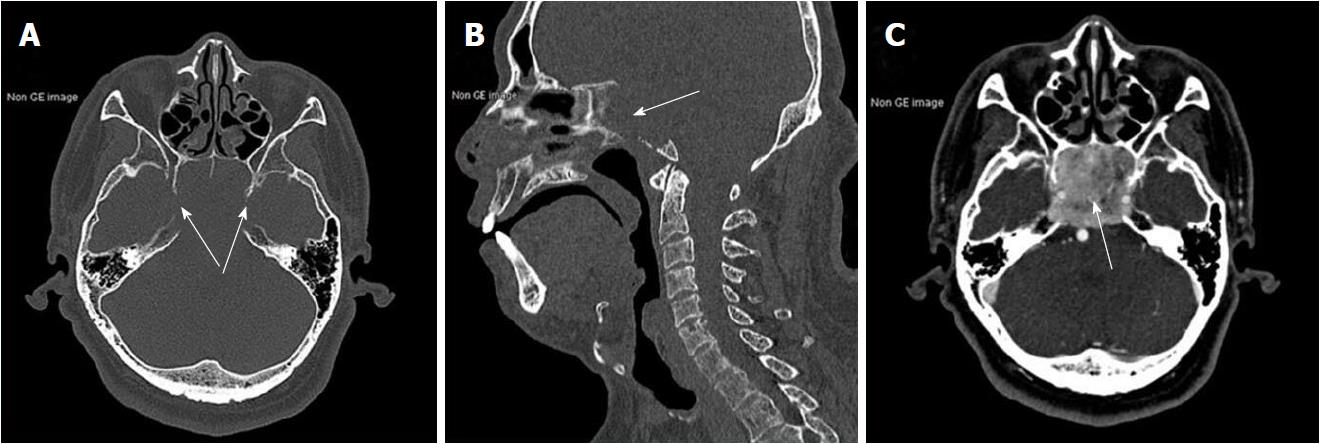
Figure 2 Brain computed tomography scans.
A: Axial computed tomography (CT); B: Sagittal CT showing obvious osteolysis at the cranial base with clivus and bilateral petrous apexes (white arrow); C: Axial CT angiogram showing obvious enhancement (white arrow) after intravenous contrast injection.
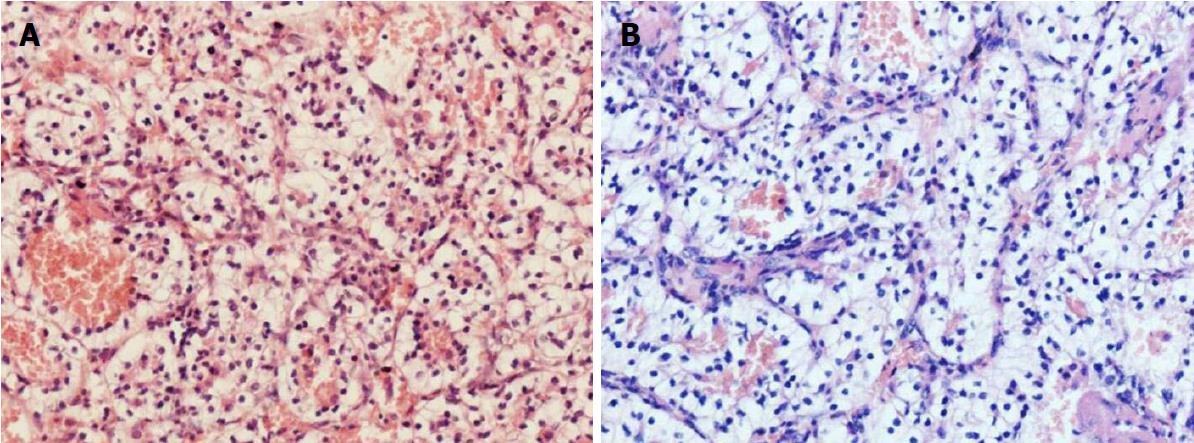
Figure 3 Histological findings.
A: H and E stain of the clival lesion, 200 ×; B: H and E stain of the left renal mass, 200 × showing clear cells with alveolar growth and separated by reticular separation of thin wall vessels. The two lesions demonstrated similar histopathologic features.
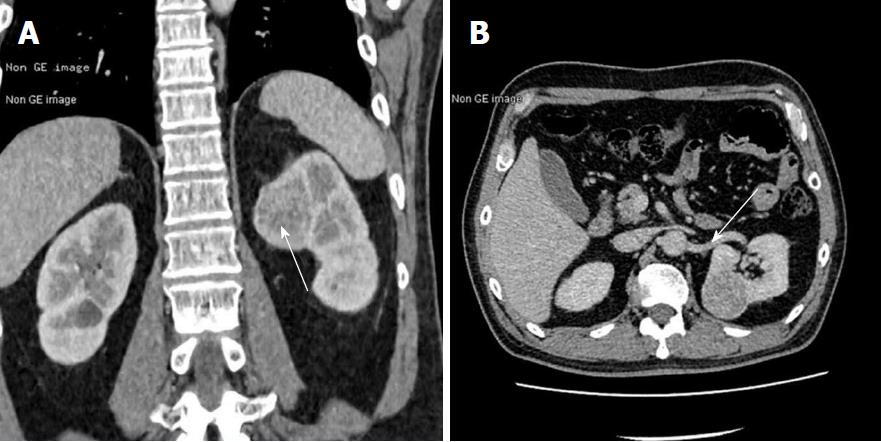
Figure 4 Contrast-enhanced computed tomography scans of abdomen.
A: Coronal contrast-enhanced computed tomography (CT) showing slightly inhomogeneous enhancing round-like mass (white arrow) located at the upper pole of the left kidney; B: Axial contrast-enhanced CT showing no tumor thrombus in the left renal vein (white arrow) and retroperitoneal lymphadenopathy revealed.
- Citation: Zhang WQ, Bao Y, Qiu B, Wang Y, Li ZP, Wang YB. Clival metastasis of renal clear cell carcinoma: Case report and literature review. World J Clin Cases 2018; 6(9): 301-307
- URL: https://www.wjgnet.com/2307-8960/full/v6/i9/301.htm
- DOI: https://dx.doi.org/10.12998/wjcc.v6.i9.301


