Copyright
©The Author(s) 2018.
World J Clin Cases. Nov 6, 2018; 6(13): 650-658
Published online Nov 6, 2018. doi: 10.12998/wjcc.v6.i13.650
Published online Nov 6, 2018. doi: 10.12998/wjcc.v6.i13.650
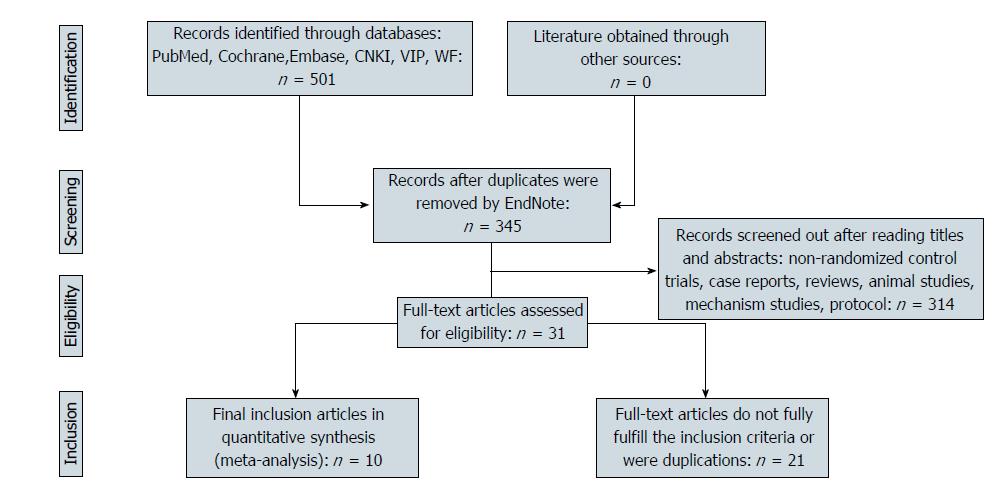
Figure 1 Flow diagram of included studies in the meta-analysis (up to April 2018).
CNKI: China National Knowledge Infrastructure; VIP: China Science and Technology Journal Database; WF: Wanfang Database.
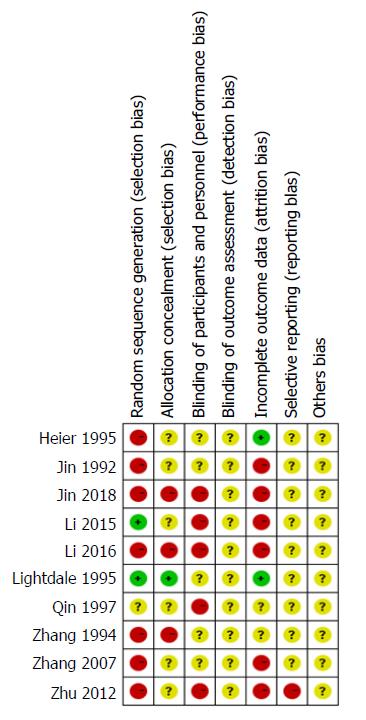
Figure 2 Risk of bias summary: review authors’ judgements regarding risk of bias item for each included study.
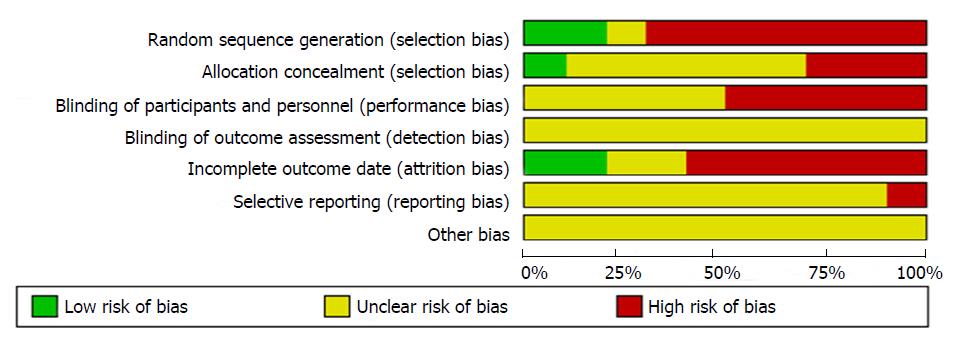
Figure 3 Risk of bias graph: review authors’ judgements regarding risk of bias items presented as percentages across all included studies.
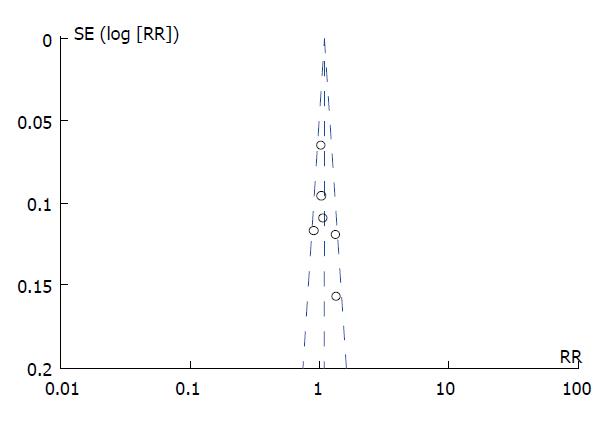
Figure 4 The funnel plot of the significant remission rate between photodynamic therapy combined with chemotherapy and photodynamic therapy/chemotherapy alone in middle-advanced upper gastrointestinal carcinomas.
RR: Risk ratio.
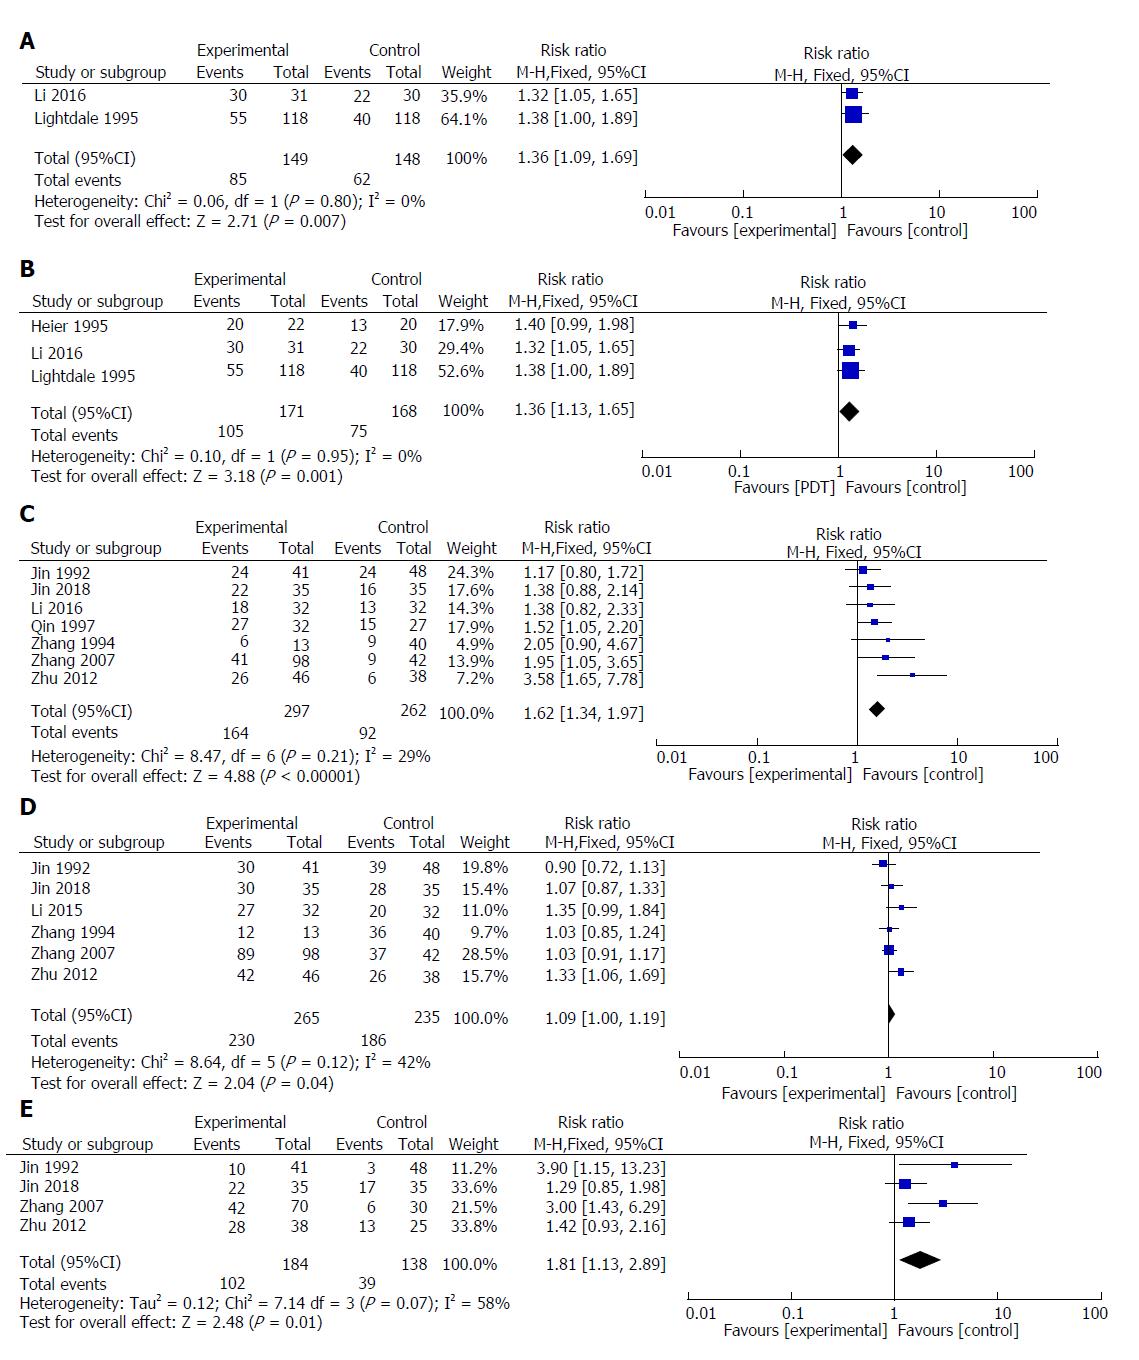
Figure 5 Forest plots of the risk ratio.
A: Significant remission rate associated with middle-advanced stage upper gastrointestinal carcinomas; B: Effective rate associated with middle-advanced stage upper gastrointestinal carcinomas; C: Significant remission rate associated with middle-advanced stage upper gastrointestinal carcinomas; D: Effective rate associated with middle-advanced stage upper gastrointestinal carcinomas; E: One-year survival rate associated with middle-advanced stage upper gastrointestinal carcinomas. The box represents the RR point estimate of each study, and its area is proportional to the weight of the estimate. Horizontal lines represent the 95%CI. RR: Risk ratio; CI: Confidence interval.
- Citation: Chen B, Xiong L, Chen WD, Zhao XH, He J, Zheng YW, Kong FH, Liu X, Zhang ZJ, Miao XY. Photodynamic therapy for middle-advanced stage upper gastrointestinal carcinomas: A systematic review and meta-analysis. World J Clin Cases 2018; 6(13): 650-658
- URL: https://www.wjgnet.com/2307-8960/full/v6/i13/650.htm
- DOI: https://dx.doi.org/10.12998/wjcc.v6.i13.650


