Copyright
©The Author(s) 2018.
World J Clin Cases. Sep 26, 2018; 6(10): 373-383
Published online Sep 26, 2018. doi: 10.12998/wjcc.v6.i10.373
Published online Sep 26, 2018. doi: 10.12998/wjcc.v6.i10.373
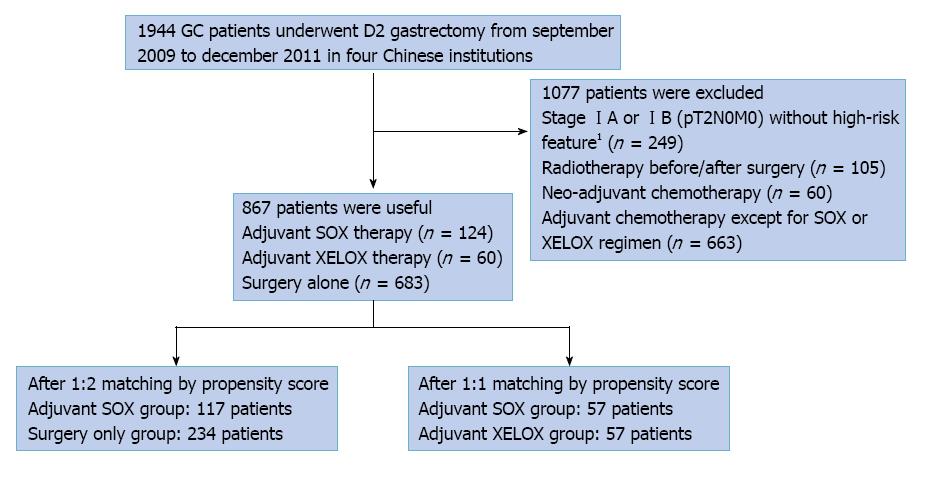
Figure 1 Flowchart of the study population.
GC: Gastric cancer; SOX: S-1 plus oxaliplatin.1High-risk features include poorly differentiated or higher grade cancer,lymphovascular invasion, neural invasion, or ï¼50 years of age.
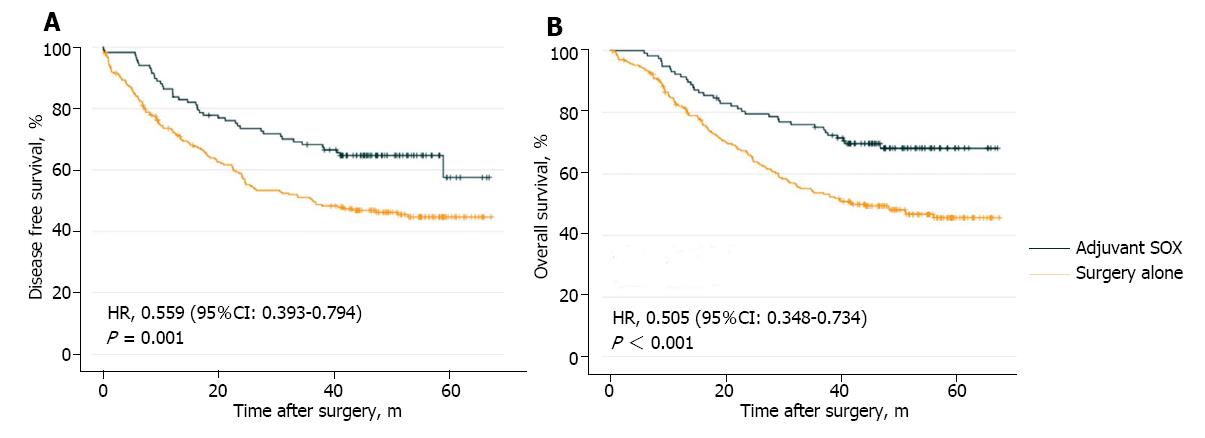
Figure 2 Kaplan-Meier curves for disease-free survival (A) and overall survival (B) between matched patients in the surgery alone group and adjuvant S-1 plus oxaliplatin group.
SOX: S-1 plus oxaliplatin; HR: Hazard ratio.
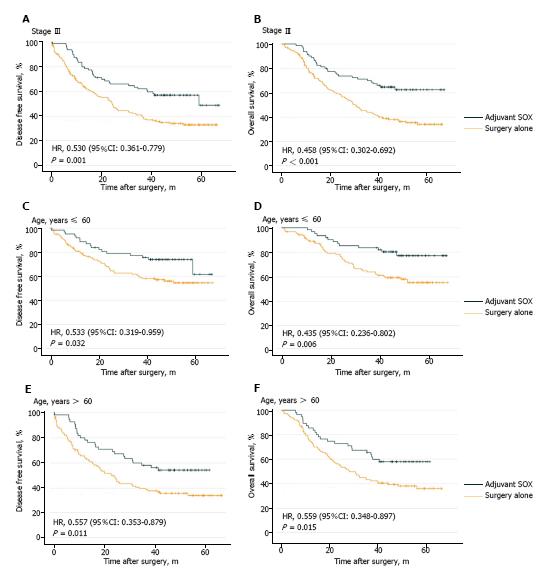
Figure 3 Kaplan-Meier curves for disease-free survival and overall survival of subgroups between matched patients in the surgery alone group and adjuvant S-1 plus oxaliplatin group.
A: Disease-free survival (DFS) in matched patients with stage III; B: Overall survival (OS) in matched patients with stage III; C: DFS in matched patients who ≤ 60 years old; D: OS in matched patients who ≤ 60 years old; E: DFS in matched patients who > 60 years old; F: OS in matched patients who > 60 years old. SOX: S-1 plus oxaliplatin; HR: Hazard ratio.
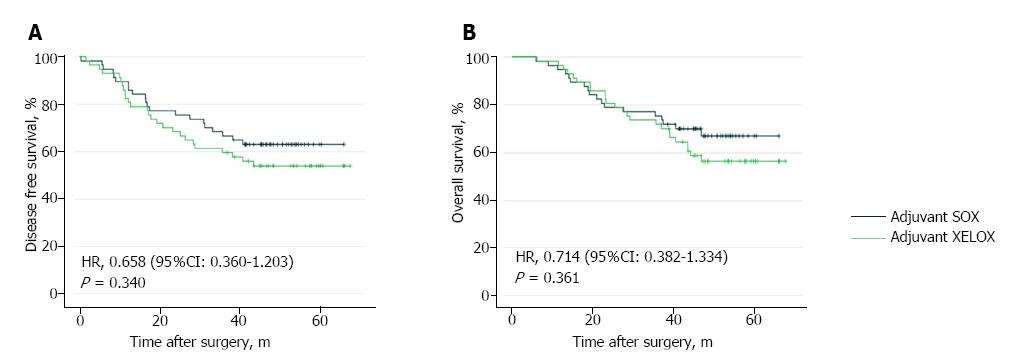
Figure 4 Kaplan-Meier curves for disease-free survival (A) and overall survival (B) between matched patients in the adjuvant S-1 plus oxaliplatin group and adjuvant capecitabine plus oxaliplatin group.
SOX: S-1 plus oxaliplatin; XELOX: Capecitabine plus oxaliplatin; HR: Hazard ratio.
- Citation: Ren DF, Zheng FC, Zhao JH, Shen GS, Ahmad R, Zhang SS, Zhang Y, Kan J, Dong L, Wang ZY, Zhao FX, Zhao JD. Adjuvant chemotherapy with S-1 plus oxaliplatin improves survival of patients with gastric cancer after D2 gastrectomy: A multicenter propensity score-matched study. World J Clin Cases 2018; 6(10): 373-383
- URL: https://www.wjgnet.com/2307-8960/full/v6/i10/373.htm
- DOI: https://dx.doi.org/10.12998/wjcc.v6.i10.373


