Copyright
©The Author(s) 2015.
World J Clin Cases. Sep 16, 2015; 3(9): 793-806
Published online Sep 16, 2015. doi: 10.12998/wjcc.v3.i9.793
Published online Sep 16, 2015. doi: 10.12998/wjcc.v3.i9.793
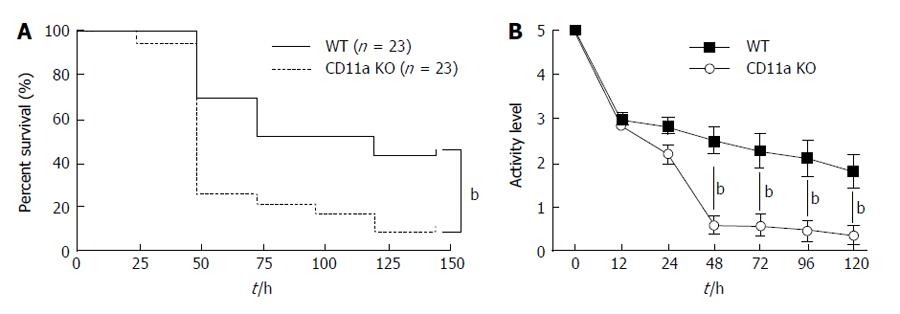
Figure 1 The outcome and activity level of CD11a knockout mice in polymicrobial sepsis.
A: The outcome of polymicrobial sepsis in wild-type (WT) and CD11a knockout mice. Statistical significance was evaluated using Log-rank test (P = 0.0024). The activity level of WT and CD11a mice following polymicrobial sepsis is shown; B: Activity was numbered from 0 to 5 based on responsiveness and appetite as described in Methods. Statistical analysis was performed using two-way analysis of variance with Bonferroni post hoc analysis. In both (A) and (B), bP < 0.01, respectively. KO: Knockout.
Figure 2 Leukocyte migration to the peritoneal cavity.
A: Total numbers of peritoneal leukocytes in both wild-type (WT) and CD11a knockout (KO) mice at 6 h after cecal ligation and puncture (CLP) were compared. Statistical analysis was performed using two-tailed Student’s t-test; B: The peritoneal emigration ratio defined as in the manuscript were shown at 6 and 12 h after CLP. Data represent mean ± SD of 4 mice. Statistical analysis was performed using one-way analysis of variance with Tukey’s post hoc analysis; C: The peritoneal emigration ratio was shown at 6 h after CLP in both isotype-control injected WT group and CD11a blocking antibody M17/4 injected WT group. Data represent mean ± SD of 4 mice. Statistical analysis was performed using two-tailed student’s t-test. aP < 0.05.
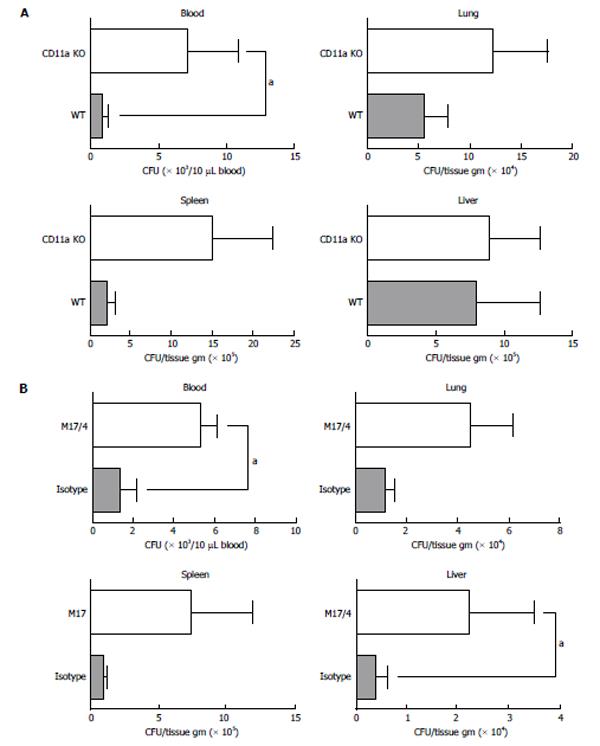
Figure 3 Tissue bacterial load.
A: The comparison between wild-type and CD11a knockout (KO) mice. The tissue bacterial load was studied and shown as mean ± SD of 8 mice. Statistical analysis was performed using two-tailed Mann-Whitney test; B: The comparison between isotype-control injected group and CD11a blocking antibody M17/4 injected group. The tissue bacterial load was studied and shown as mean ± SD of 8 mice. Statistical analysis was performed using two-tailed Mann-Whitney test. aP < 0.05.
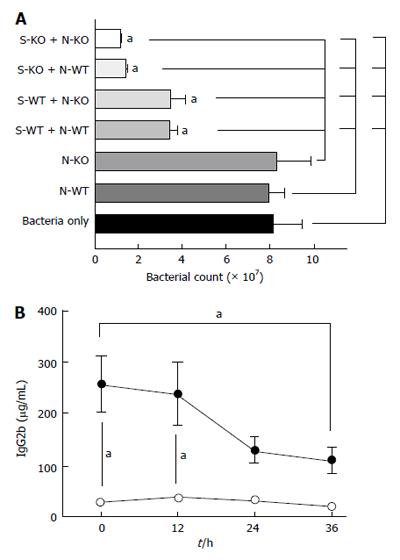
Figure 4 Bacterial killing and IgG2b level.
A: Bacterial killing assay was performed using bacteria obtained from cecal culture as described in the methods. Data represent mean ± SD of 3 independent experiments. Statistical analysis was performed using one-way analysis of variance with Tukey post hoc analysis. aP < 0.05; B: Serum IgG2b level was shown. Statistical analysis was performed using one-way variance of analysis with Tukey post hoc analysis. aP < 0.05, respectively of the comparison between wild-type vs CD11a knockout (KO) mice at the same time point, or comparison among wild-type or CD11a KO mice. N-WT: Wild-type neutrophils; N-KO: CD11a KO neutrophils; S-WT: Wild-type serum; S-KO: CD11a KO serum.
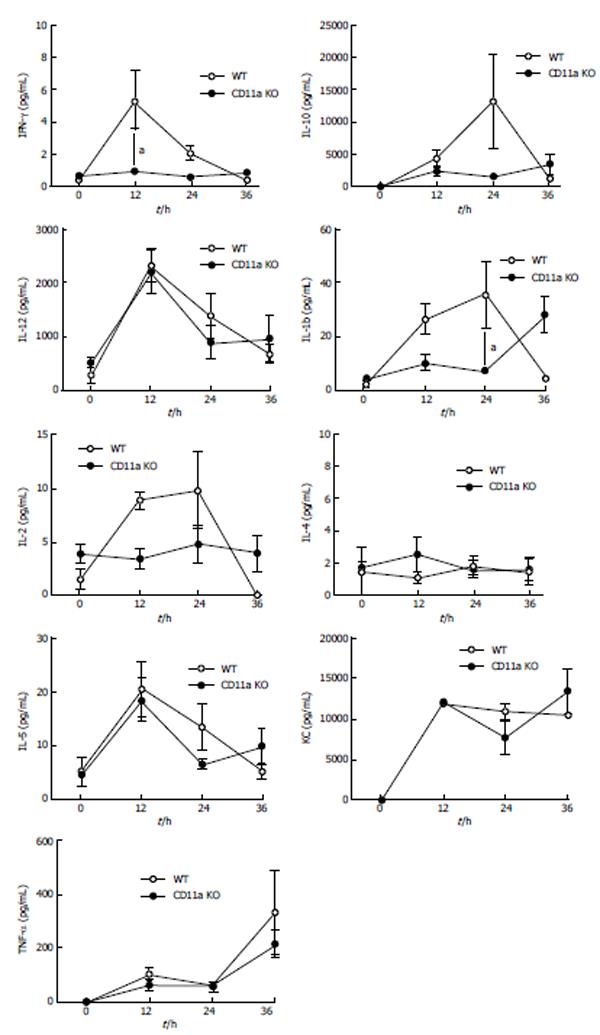
Figure 5 Serum cytokine profiles in polymicrobial sepsis.
The cytokine profiles of wild-type (WT) and CD11a knockout mice were compared. The data represents mean ± SD of 8 mice. Statistical analysis was performed using two-way analysis of variance with Tukey post hoc analysis. aP < 0.05.
Figure 6 Tissues interleukin-6 mRNA level.
Interleukin-6 (IL-6) expression at various tissues was examined using real-time quantitative polymerase chain reaction (A-C). Data represent mean ± SD of 4 independent experiments. Statistical analysis was performed using two-way analysis of variance with Tukey post hoc analysis. a < 0.05 and bP < 0.01, respectively.
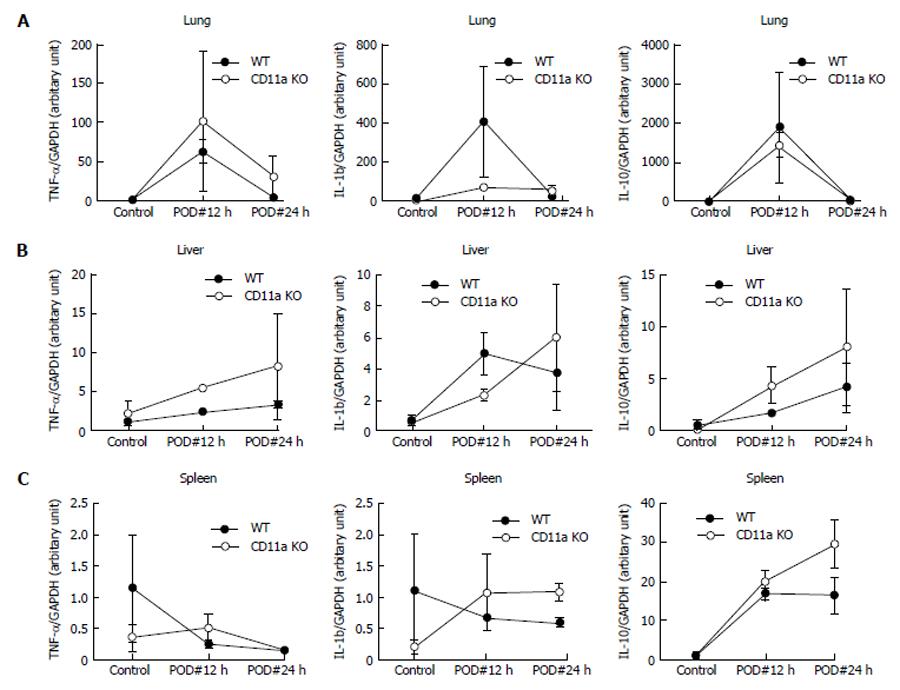
Figure 7 Tissues tumor necrosis factor-α, interleukin-1b and interleukin-10 levels.
Various tissues of IL-6 expression were examined using real-time quantitative polymerase chain reaction. Data represent mean ± SD of 4 independent experiments. Statistical analysis was performed using two-way analysis of variance with Tukey post hoc analysis. IL: Interleukin; TNF: Tumor necrosis factor; GAPDH: Glyceraldehyde-3-phosphate dehydrogenase.
Figure 8 Clevased caspase-3 expression in spleen at different time point.
Cleaved caspase-3 and β-actin expression was examined at 12 and 24 h after cecal ligation and puncture procedure. The density of bands was determined three times using Image J and plotted. Statistical analysis was performed using one-way analysis of variance with Tukey post hoc analysis. aP < 0.05.
Figure 9 Apoptosis in spleen.
A and B: Apoptosis in spleen was examined using (A) tunnel staining and (B) cleaved-caspase-3 staining. The number of positive cells was counted per 40 × magnification field of the same size. Eight different regions were counted. Data show mean ± SD statistical analysis was performed using one-way analysis of variance with Tukey post hoc analysis. aP < 0.05; C: In hematoxylin and eosin staining, apoptotic cells are indicated using arrows.
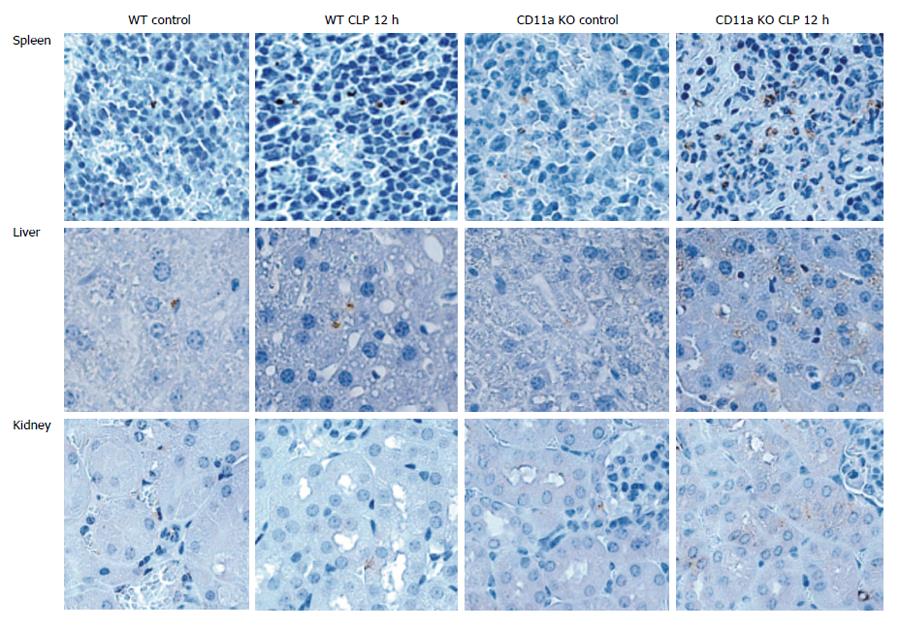
Figure 10 Neutrophil recruitment to tissues.
Neutrophil recruitment to tissues was studied by examining myeloperoxidase staining. Cells stained with brown show myeloperoxidase positive cells, largely representing neutrophils. In figures, control means no cecal ligation and puncture surgery, and cecal ligation and puncture (CLP) 12 h is 12 h after cecal ligatation and puncture model.
Figure 11 Neutrophil recruitment to the lung.
A: Leukocyte recruitment to the alveolar space was examined by BAL. The number of leukocytes in BAL was shown. Statistical analysis was performed using two-tailed Student’s t test. There was no statistical significance (P = 0.1158); B and C: Neutrophil recruitment to the lung was examined by measuring myeloperoxidase level. In the figure, control means no cecal ligation and puncture surgery, and CLP means cecal ligation and puncture model. Data represent mean ± SD of 4 different samples. Statistical analysis was performed using one-way analysis of variance with Tukey post hoc analysis. aP < 0.05. Isotype means isotype control antibody. M17/4 is anti-CD11a blocking antibody. KO: Knockout; CLP: Cecal ligation and puncture; MPO: Myeloperoxidase; WT: Wild type.
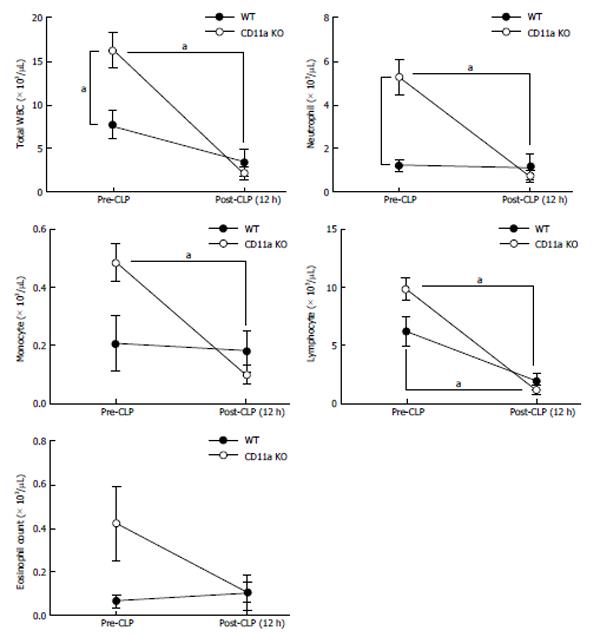
Figure 12 The changes of peripheral leukocyte counts in septic mice.
The number of leukocytes was examined. The data represent mean ± SD of 4 independent experiments. Statistical analysis was performed using one-way analysis of variance with Tukey’s post hoc analysis. aP < 0.05.
- Citation: Liu JR, Han X, Soriano SG, Yuki K. Leukocyte function-associated antigen-1 deficiency impairs responses to polymicrobial sepsis. World J Clin Cases 2015; 3(9): 793-806
- URL: https://www.wjgnet.com/2307-8960/full/v3/i9/793.htm
- DOI: https://dx.doi.org/10.12998/wjcc.v3.i9.793


