Copyright
©The Author(s) 2015.
World J Clin Cases. Jun 16, 2015; 3(6): 519-524
Published online Jun 16, 2015. doi: 10.12998/wjcc.v3.i6.519
Published online Jun 16, 2015. doi: 10.12998/wjcc.v3.i6.519
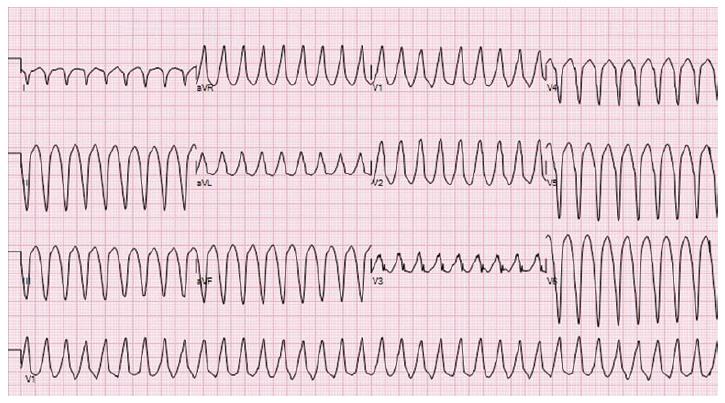
Figure 1 12-lead electrocardiogram (5 mm/mV) during ventricular tachycardia.
The QRS shows a right bundle morphology with superior axis, suggesting a left ventricular apical source.
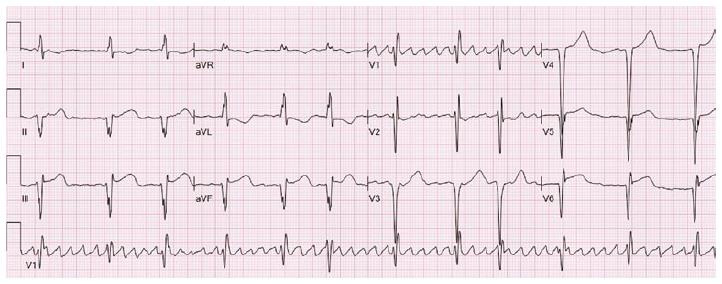
Figure 2 12-lead electrocardiogram (10 mm/mV) following direct current cardioversion.
ST segment elevation is seen in the inferolateral leads.
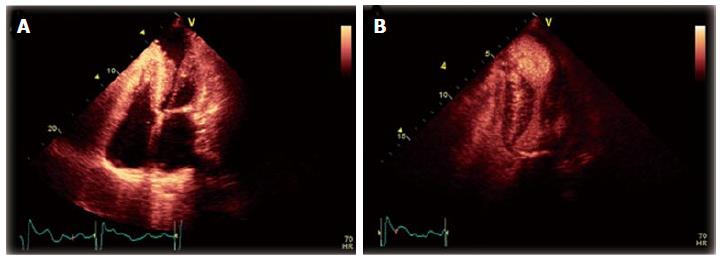
Figure 3 Transthoracic echocardiogram.
A: Transthoracic echocardiogram (TTE), apical four-chamber view, demonstrating concentric left ventricular hypertrophy with mid-cavitary obliteration at end-systole, as well as a large left-ventricular apical aneurysm (LVAA); B: TTE apical two-chamber view, with ultrasound contrast demonstrating stasis within the LVAA with a circular flow pattern, as well as decreased perfusion of the apex.
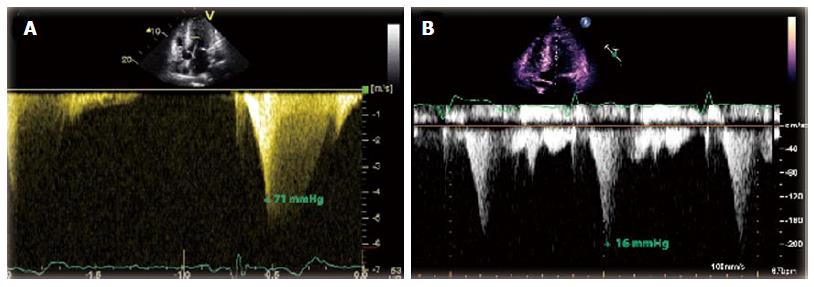
Figure 4 Transthoracic echocardiogram continuous Doppler.
A: Transthoracic echocardiogram continuous Doppler flow across the left ventricle. The mid-cavitary gradient at rest from two years prior to the left-ventricular apical aneurysm (LVAA) formation (71 mmHg) is shown; B: Over time, flow across the mid-cavitary obliteration decreased and the peak pressure declined after the formation of the LVAA (16 mmHg).
Figure 5 Contrast-enhanced cardiovascular magnetic resonance.
A: Long-axis four-chamber cardiovascular magnetic resonance in systole showing concentric left ventricle hypertrophy with mid-cavitary obstruction and large apical aneurysm; B: Late gadolinium enhancement (LGE) image of the left-ventricular apical aneurysm consistent with myocardial scarring (arrows) with extension of LGE into the inferolateral segments (a pattern typically seen in Anderson-Fabry Disease).
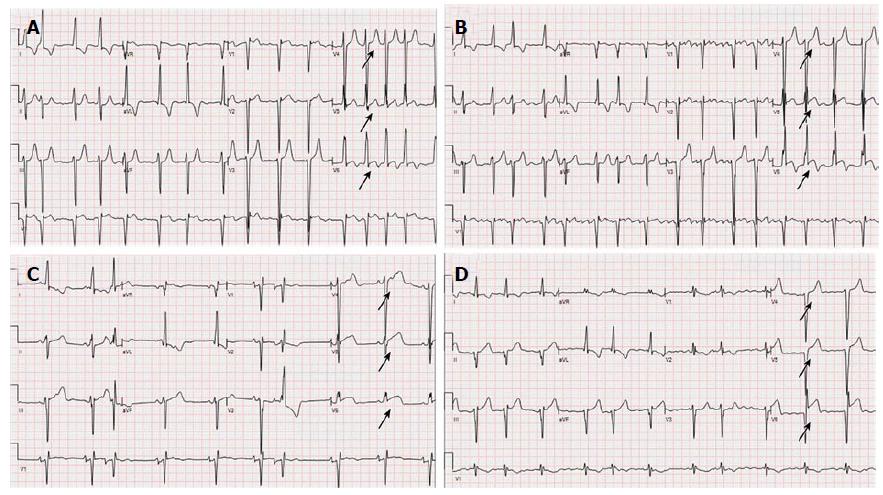
Figure 6 Serial electrocardiograms from this patient (A) 4 years prior, (B) 2 years prior, (C) 1 year prior, and (D) 3 mo prior are presented.
The development of ST elevation in leads V4-V6 (arrows) can be seen, and correlates with the formation of the left ventricular apical aneurysm.
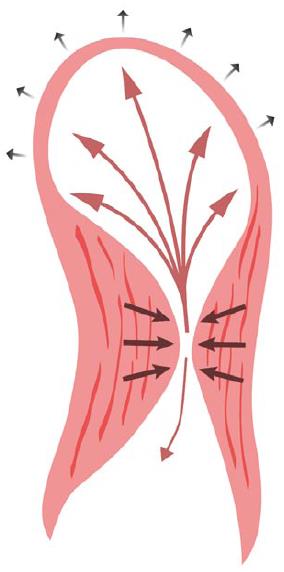
Figure 7 Illustration of blood flow direction during left ventricular systole.
While some blood is ejected towards the outflow tract (single arrow), the flow is initially greater towards the apex, which is the area of least resistance (arrows from mid-cavity to the left-ventricular apical aneurysm), resulting in a lower gradient across the mid-cavitary obliteration as the aneurysm size increases.
- Citation: Poulin MF, Shah A, Trohman RG, Madias C. Advanced Anderson-Fabry disease presenting with left ventricular apical aneurysm and ventricular tachycardia. World J Clin Cases 2015; 3(6): 519-524
- URL: https://www.wjgnet.com/2307-8960/full/v3/i6/519.htm
- DOI: https://dx.doi.org/10.12998/wjcc.v3.i6.519


