Copyright
©The Author(s) 2025.
World J Clin Cases. Mar 26, 2025; 13(9): 99421
Published online Mar 26, 2025. doi: 10.12998/wjcc.v13.i9.99421
Published online Mar 26, 2025. doi: 10.12998/wjcc.v13.i9.99421
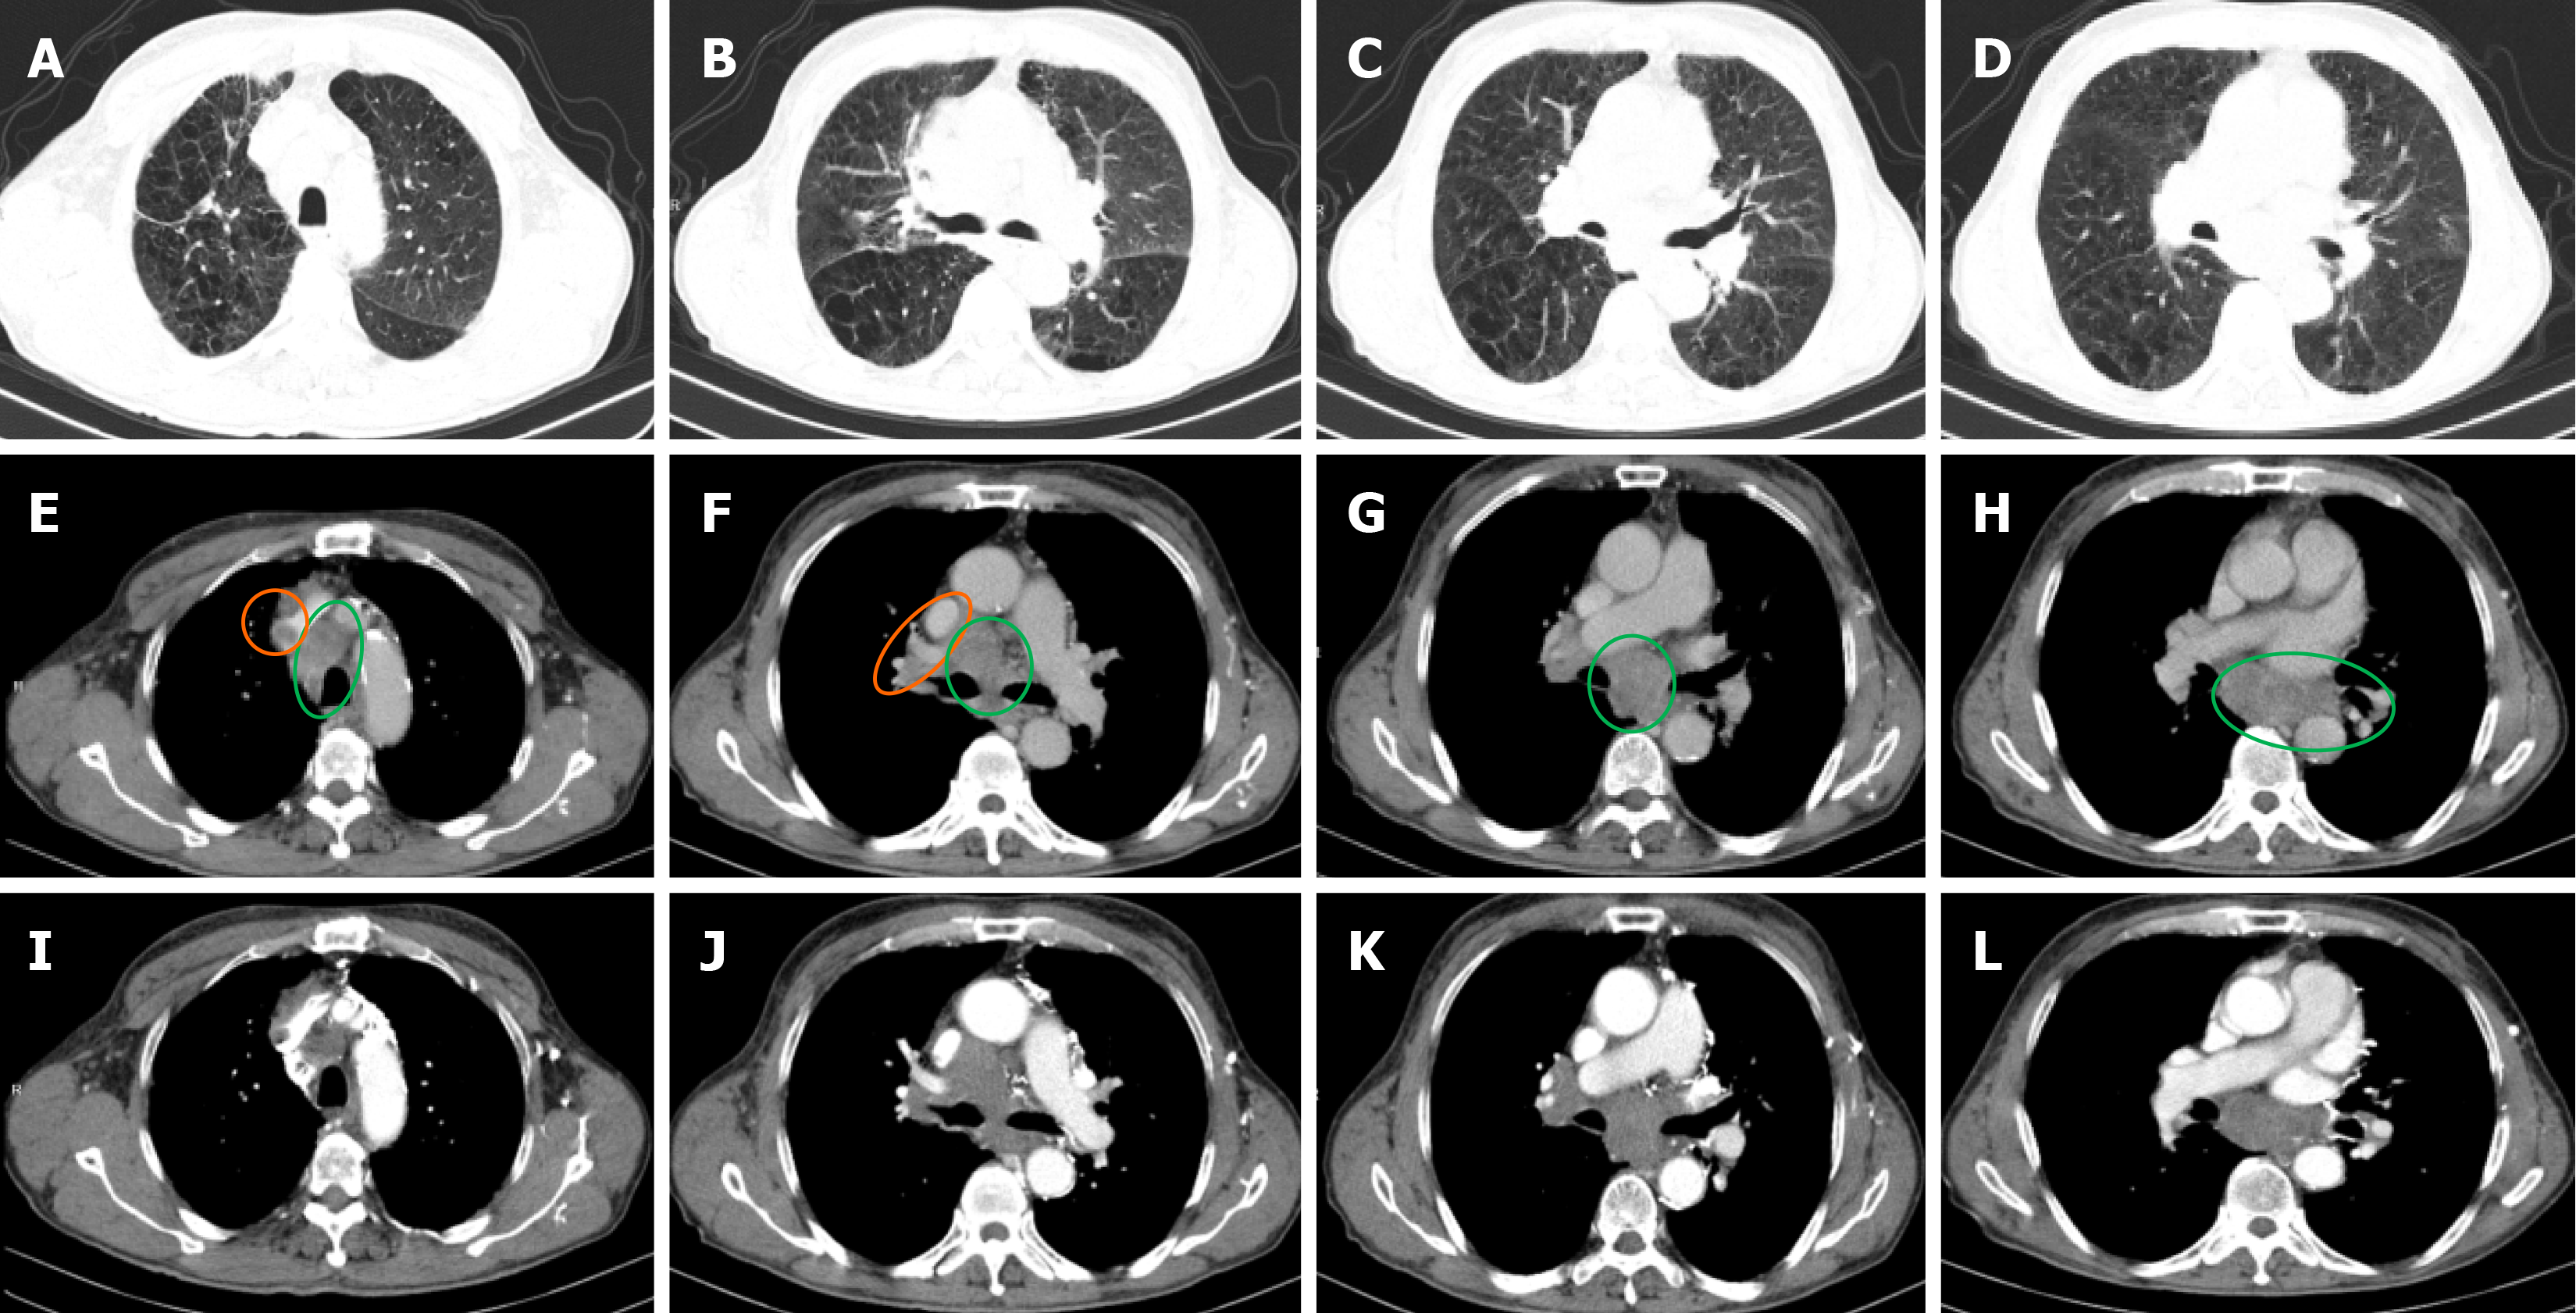
Figure 1 Enhanced lung computed tomography of Case 2.
A–D: Lung view; E–H: Soft tissue view; I–L: Enhanced soft tissue. The lung texture increased and distorted. The tracheal and bronchial openings were unobtrusive, the hilus of the two lungs were not enlarged, and multiple enlarged lymph nodes were seen in the bilateral axilla, mediastinum and tracheal carina, which were integrated into clusters. The enhanced scan was slightly uneven and enhanced, and venous computed tomography value was about 47 HU. The superior vena cava was invaded, and the enhanced scan revealed a filling defect in the right brachiocephalic vein. Enlarged lymph nodes are marked in orange and cancer embolus is marked in green.
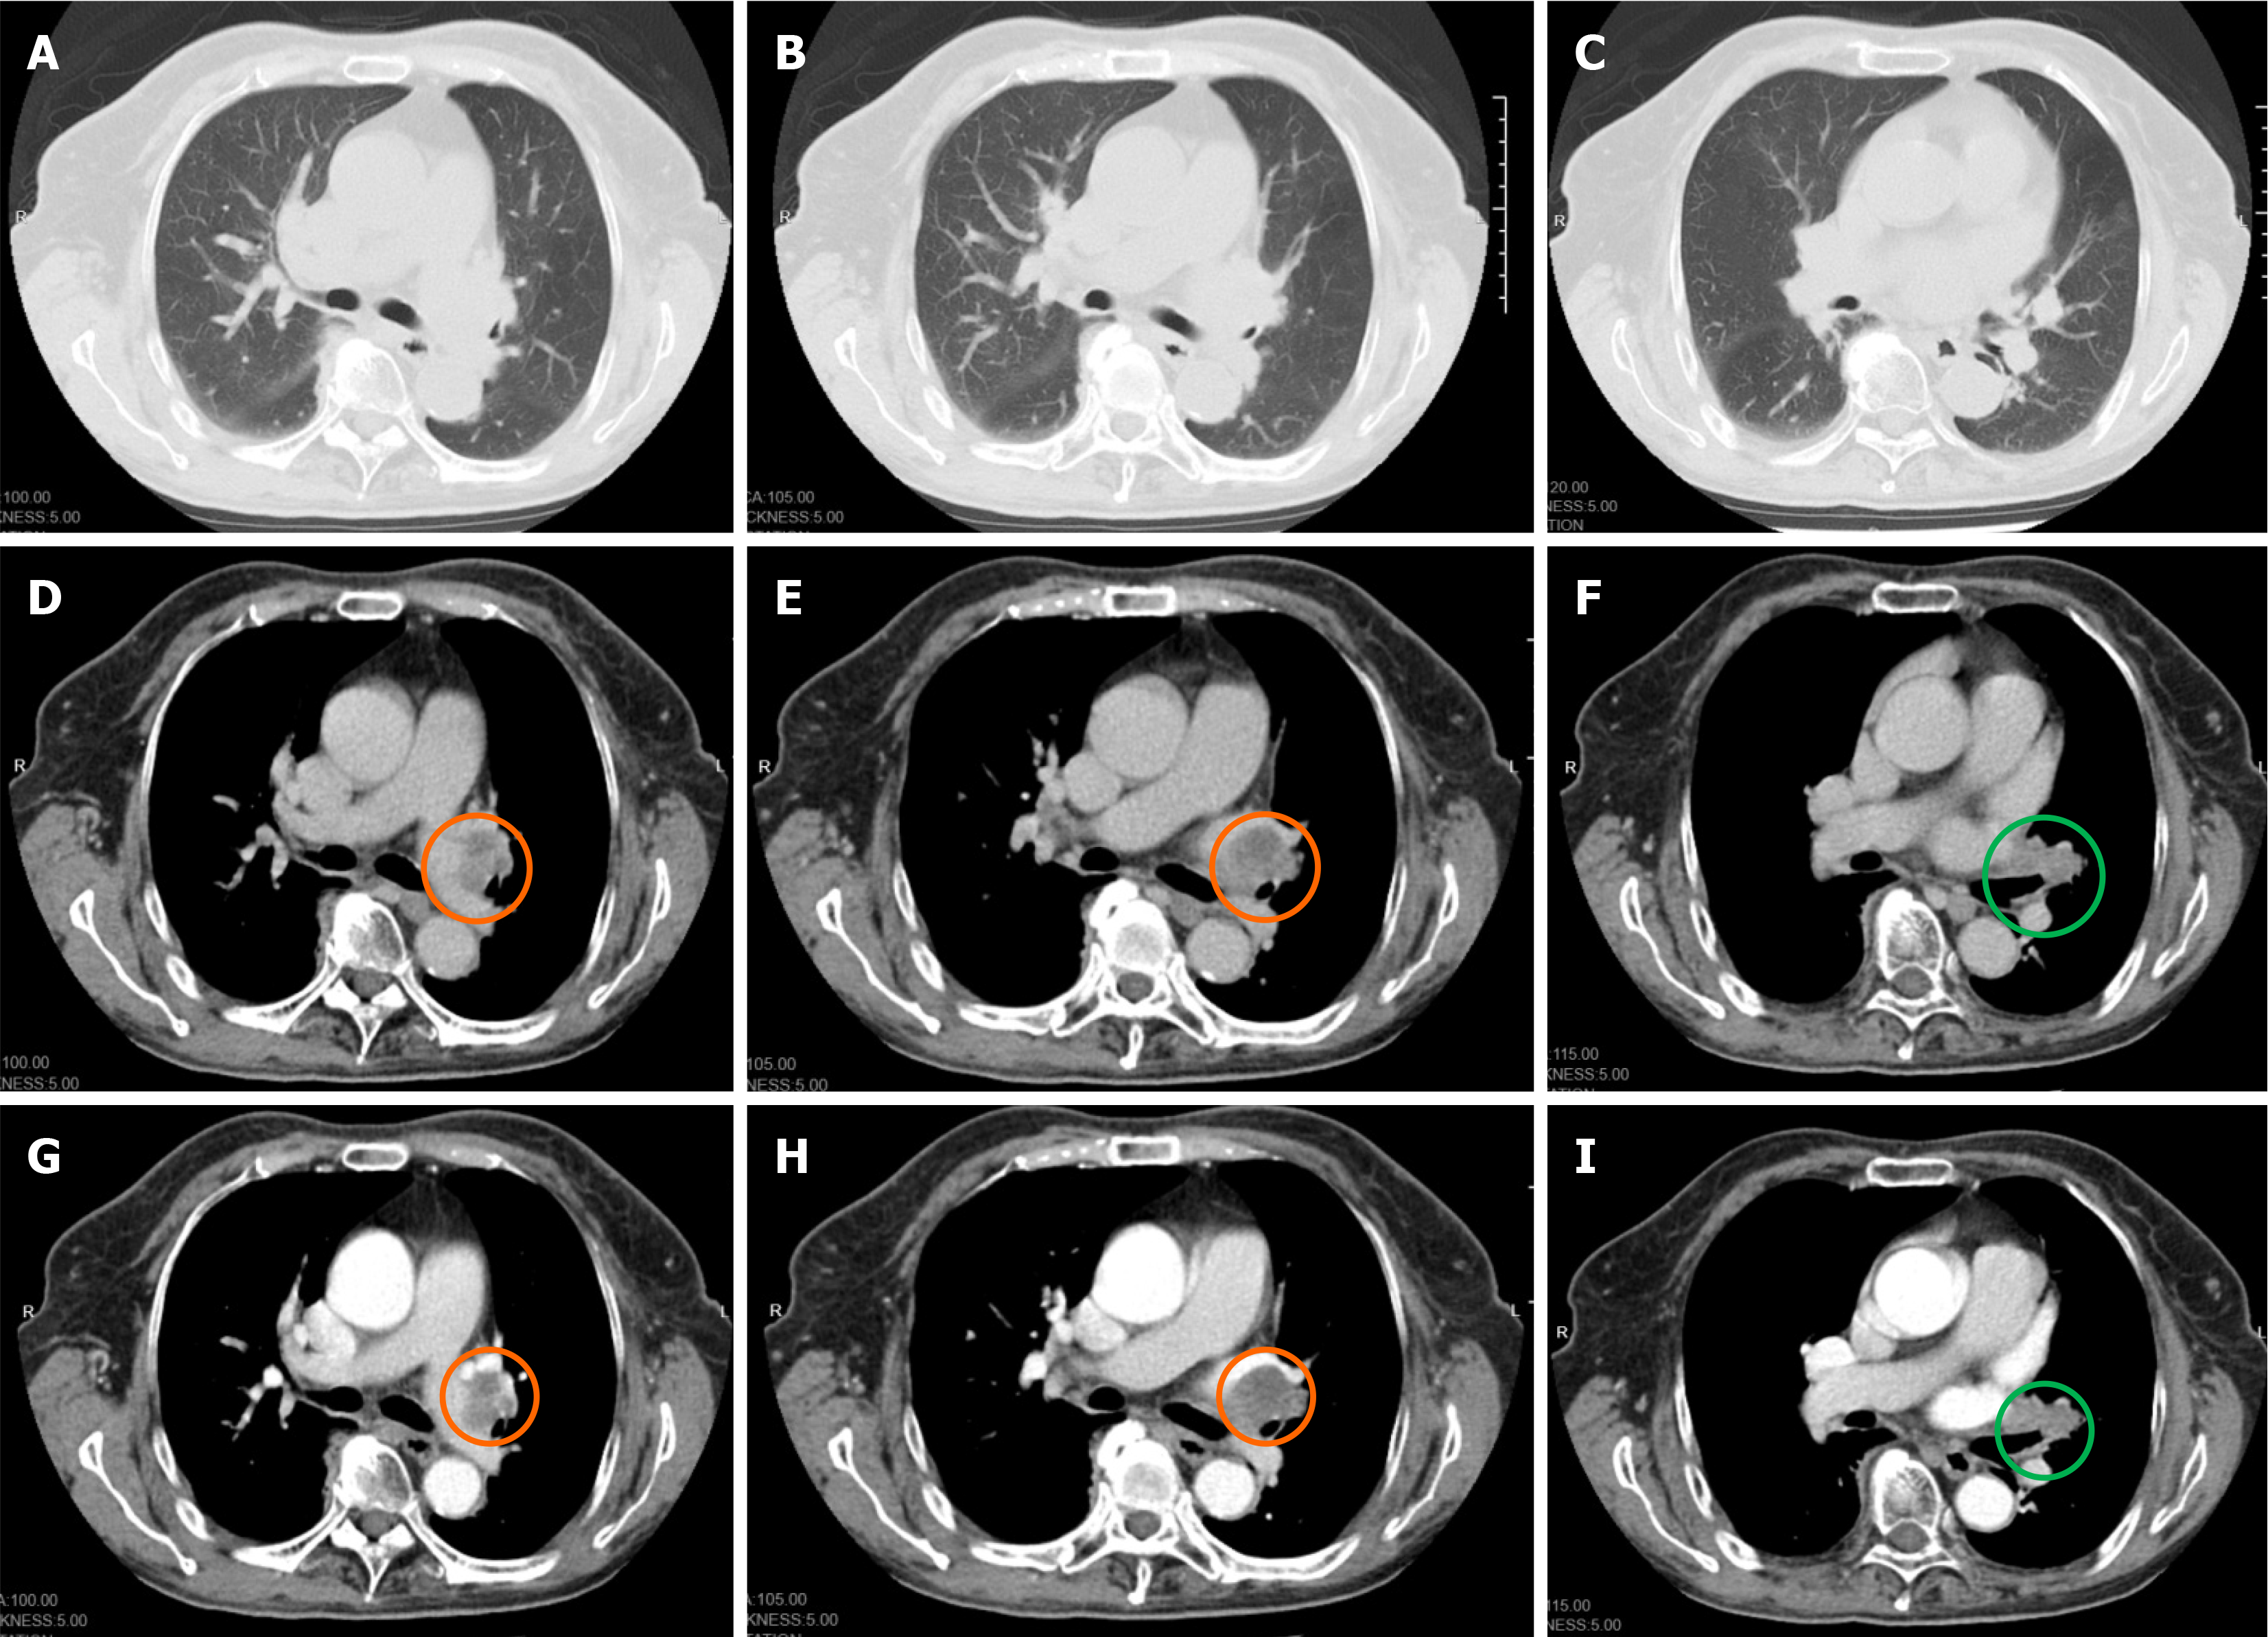
Figure 2 Enhanced lung computed tomography of Case 1.
A–C: Lung view; D–F: Soft tissue view; G–I: Enhanced soft tissue. An irregular soft tissue density shadow with a size of 33 mm × 24 mm was observed at the hilus of the left lung, which showed mild enhancement after enhancement. The bronchial stenosis of the upper lobe of the left lung and pressure of the left upper pulmonary vein were observed. Lymph nodes in the left hilar of the lung were enlarged and enhanced after enhancement. Enlarged lymph nodes are marked in orange and lung cancer is marked in green.
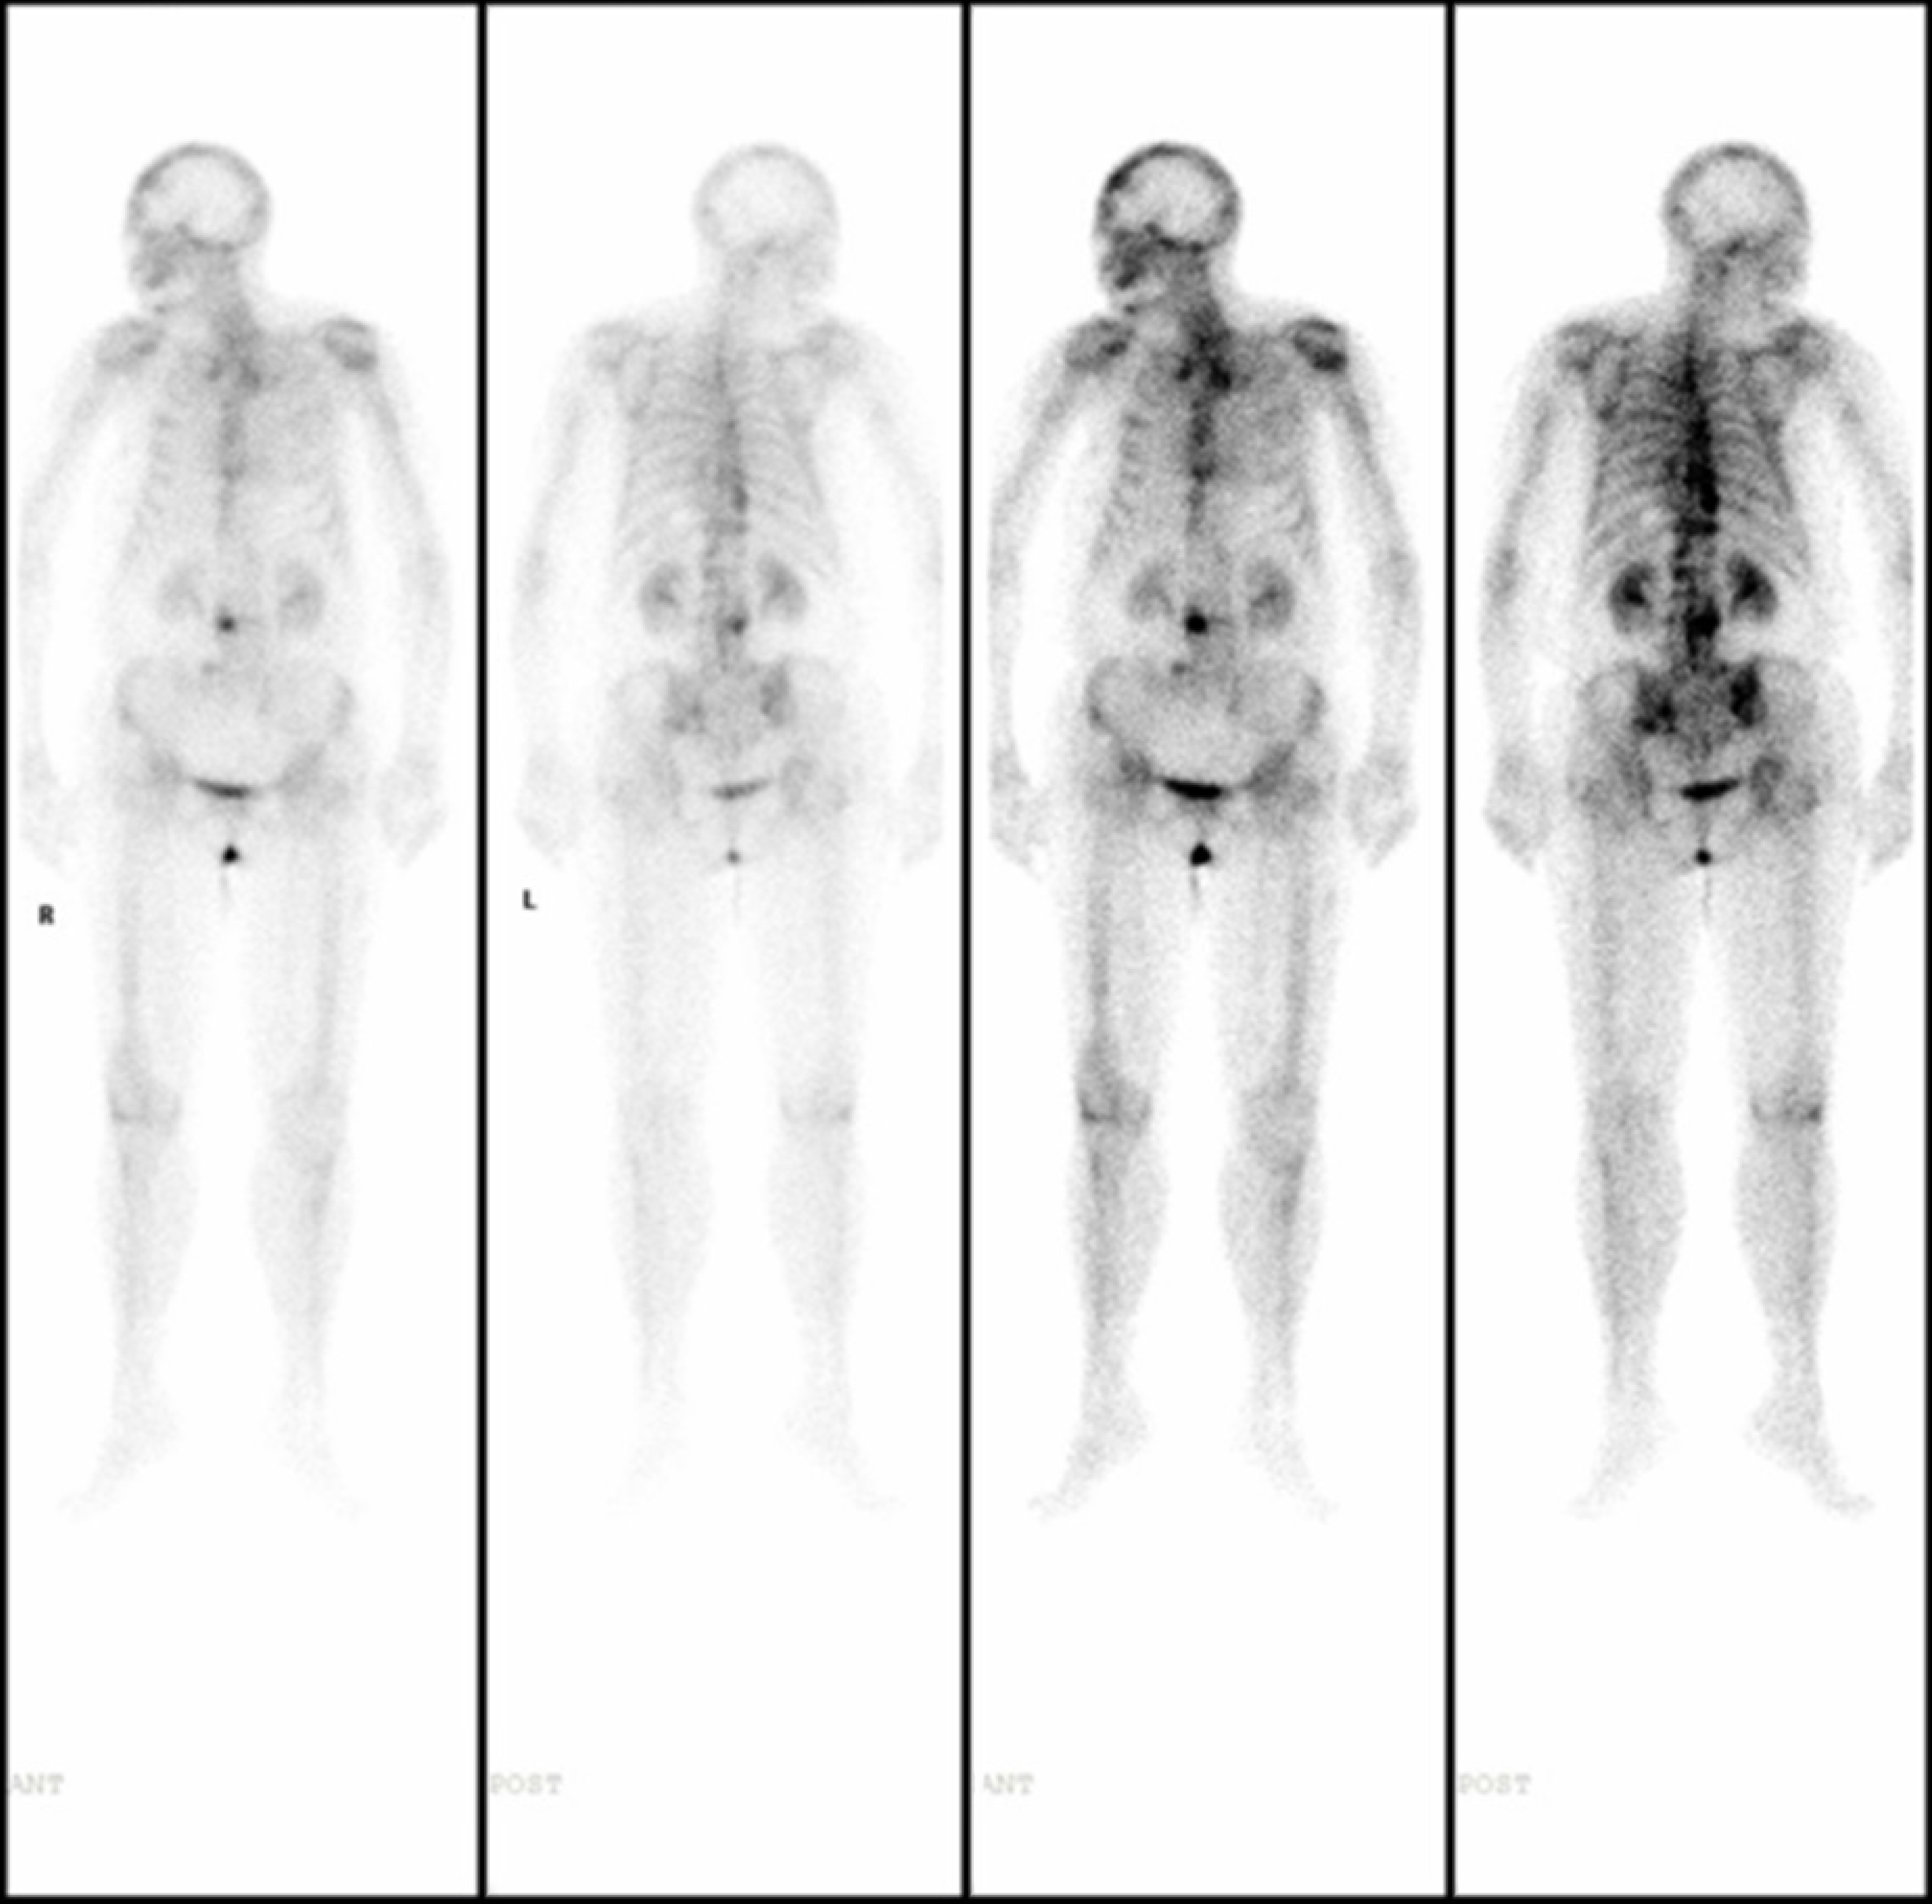
Figure 3 Whole-body 18F-fluorodeoxyglucose positron emission tomography/computed tomography imaging of Case 1.
Diffuse and uneven fluorodeoxyglucose metabolism increased in bilateral deltoid muscles, subscapularis muscles, supraspinatus muscles, posterior intercostal muscles, and left infraspinatus muscle. Localized fluorodeoxyglucose metabolism increased in left lateral femoris muscle, considering the manifestations of dermatomyositis.
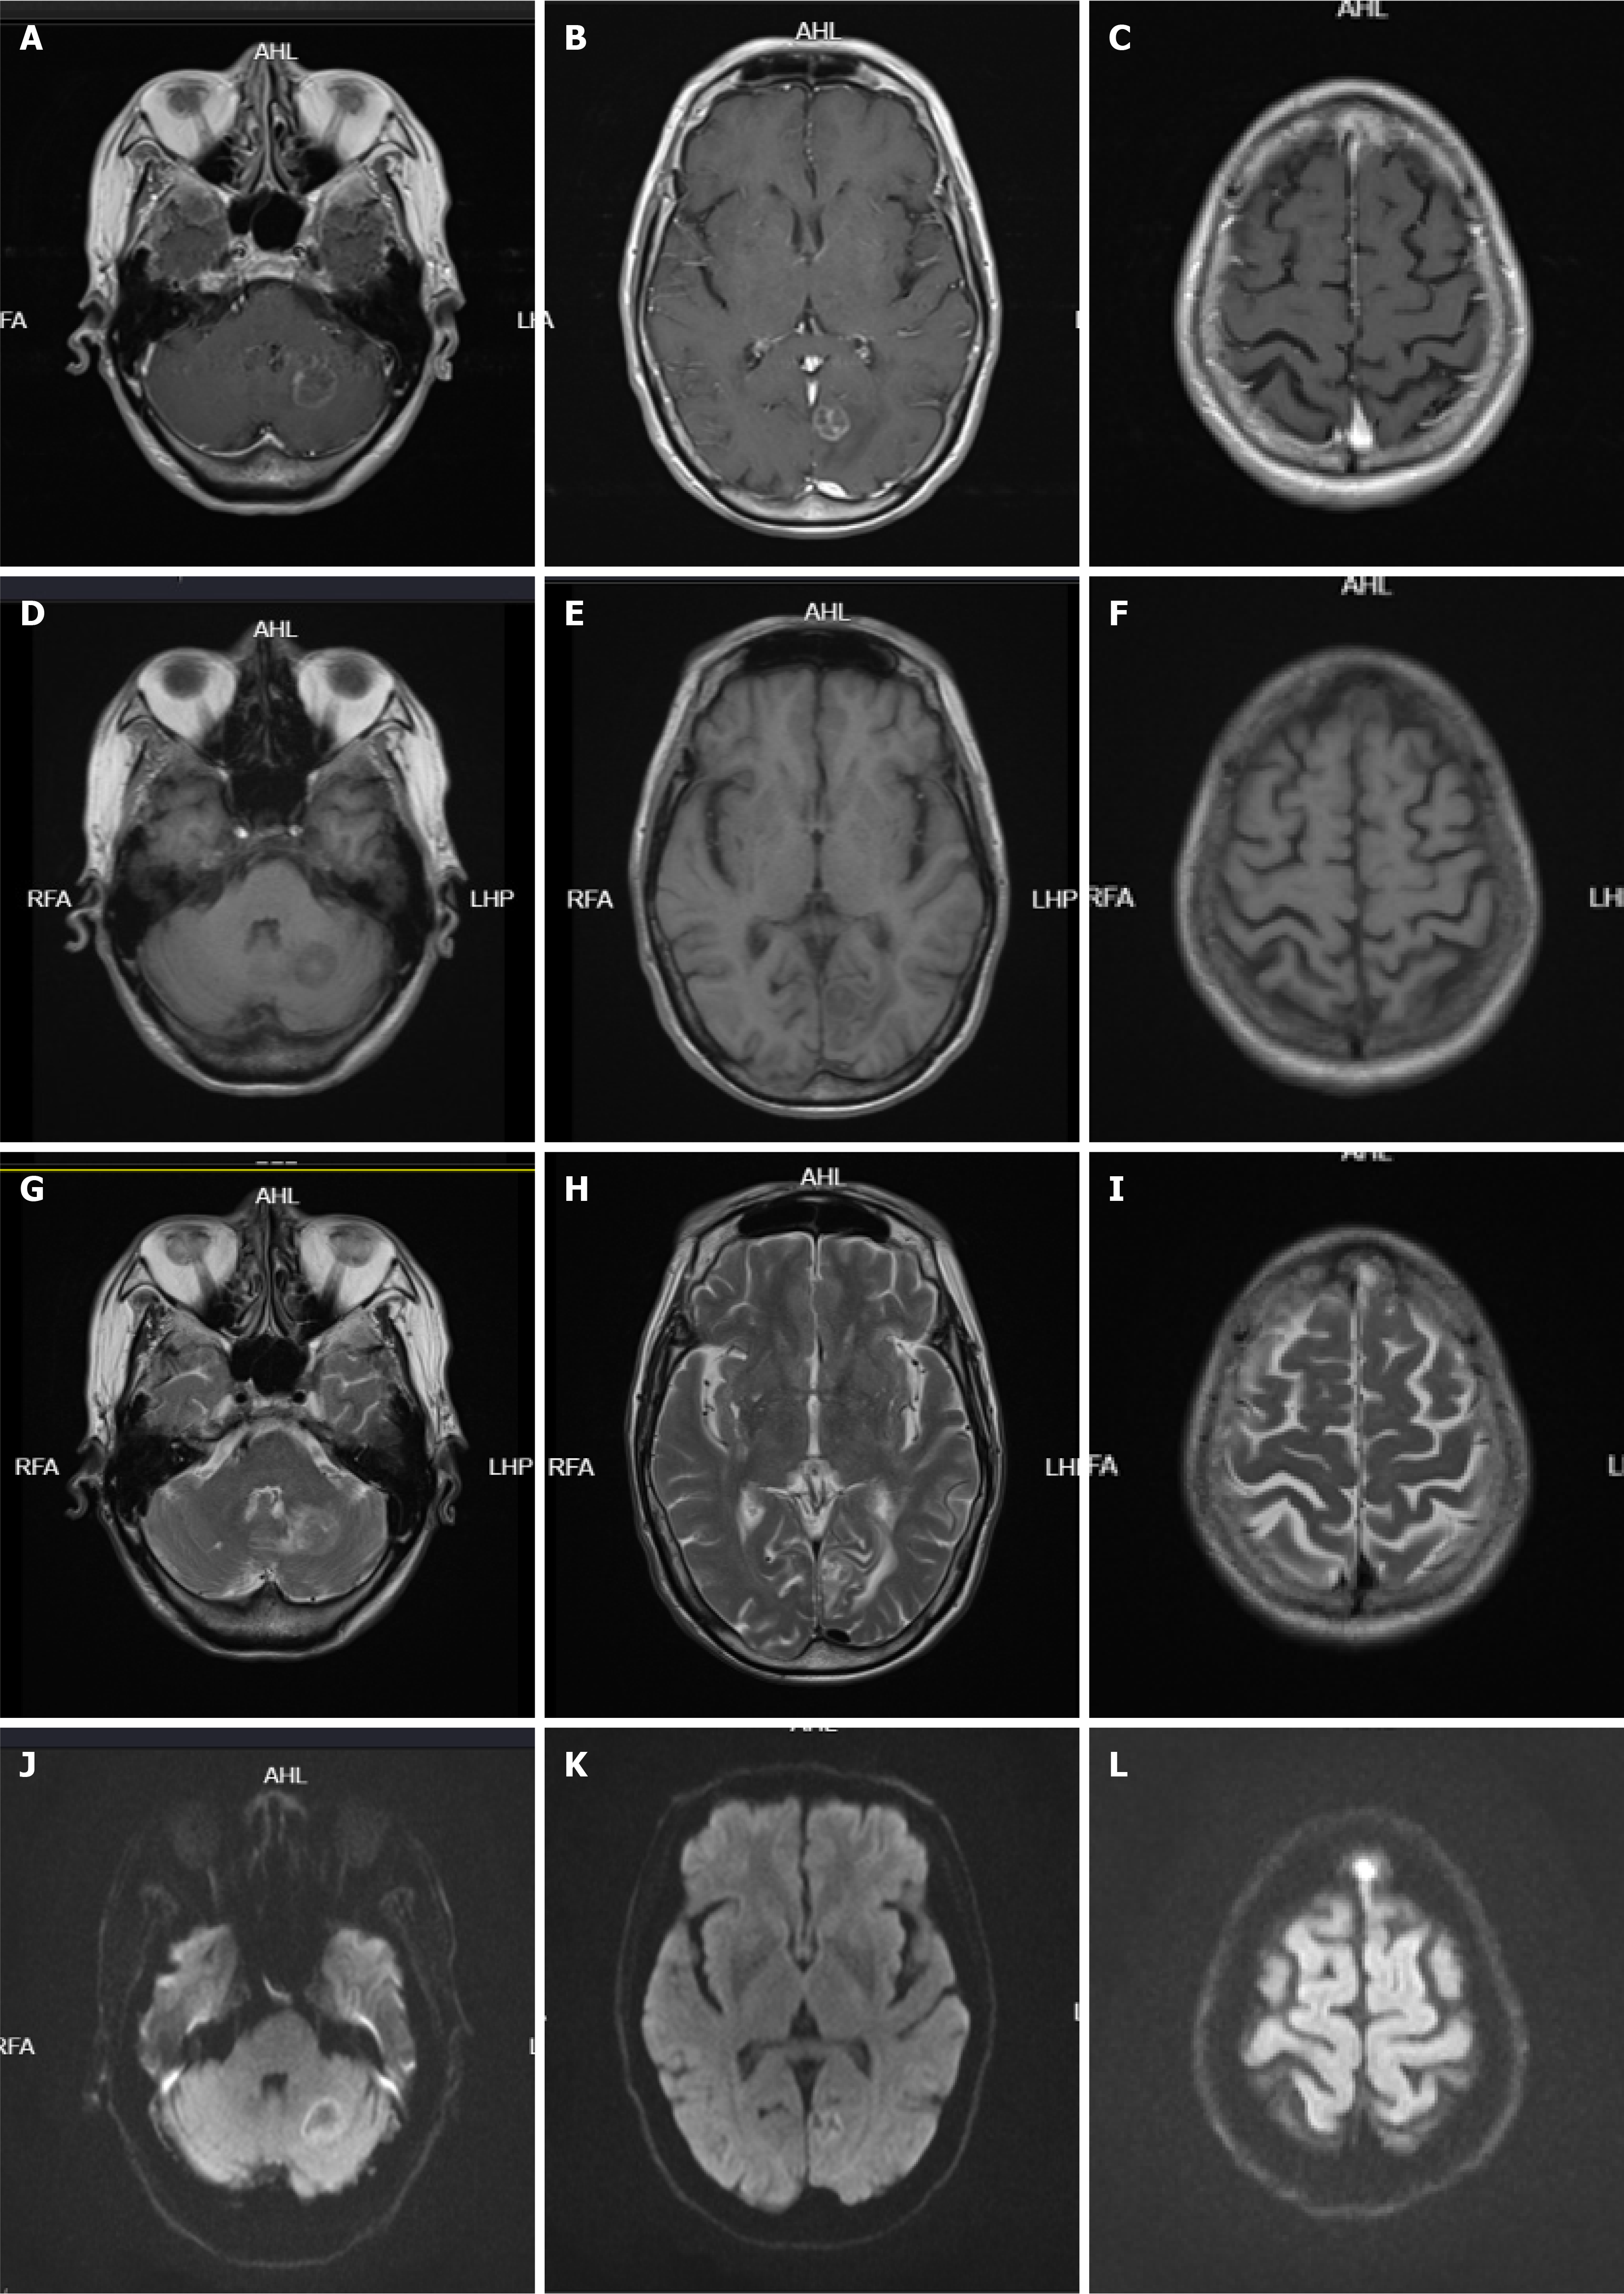
Figure 4 Head magnetic resonance scan and enhancement of Case 1.
A–C: T1-weighted image; D–F: T1 fluid attenuated inversion recovery; G–I: T2-weighted image; J–L: Diffusion-weighted imaging (DWI). The left cerebellar hemisphere and left occipital lobe showed slightly longer circular T1 and slightly longer T2 signals, and the diffusion on DWI was limited. Patchy high signals were seen in the left frontal bone on DWI, with enhanced and visible intensification, about 22 mm × 14 mm in size; patchy abnormal intensification was seen in the right occipital lobe.
- Citation: Luo M, Lu XX, Meng DY, Hu J. Small cell lung cancer with peripheral neuropathy as the first symptom: Two case reports. World J Clin Cases 2025; 13(9): 99421
- URL: https://www.wjgnet.com/2307-8960/full/v13/i9/99421.htm
- DOI: https://dx.doi.org/10.12998/wjcc.v13.i9.99421


