Copyright
©The Author(s) 2024.
World J Clin Cases. Feb 16, 2024; 12(5): 951-965
Published online Feb 16, 2024. doi: 10.12998/wjcc.v12.i5.951
Published online Feb 16, 2024. doi: 10.12998/wjcc.v12.i5.951
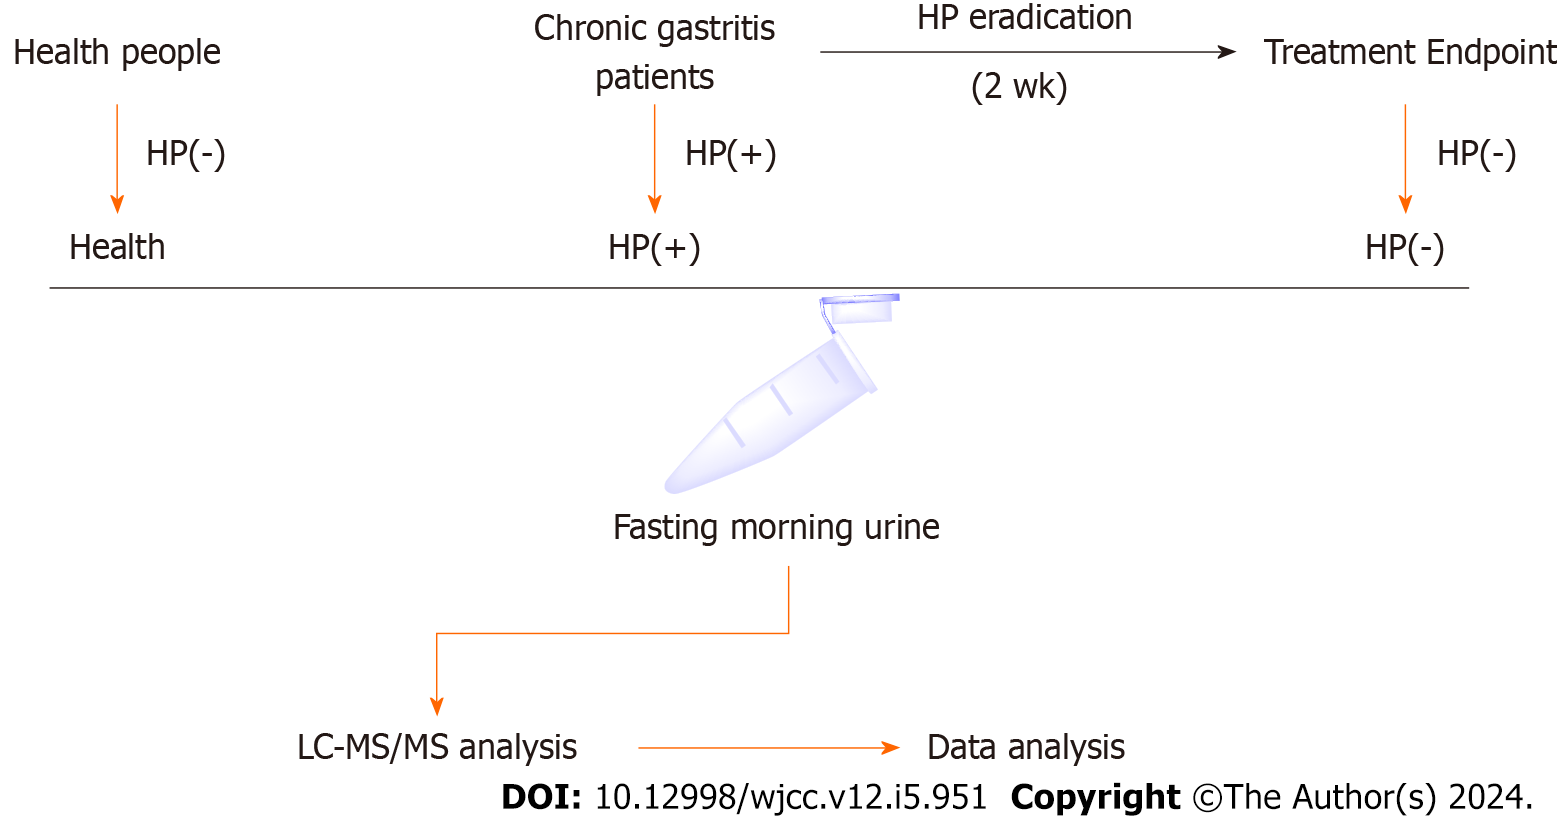
Figure 1 Schematic of patient enrollment and sample collection and analysis.
Fasting morning urine samples were collected from enrolled patients and subjected to metabolomics using LC–MS/MS analysis. Data were analyzed using One-Map, SIMCA, and MetaboAnalyst. HP(+): Helicobacter pylori-positive; HP(−): Helicobacter pylori-negative.
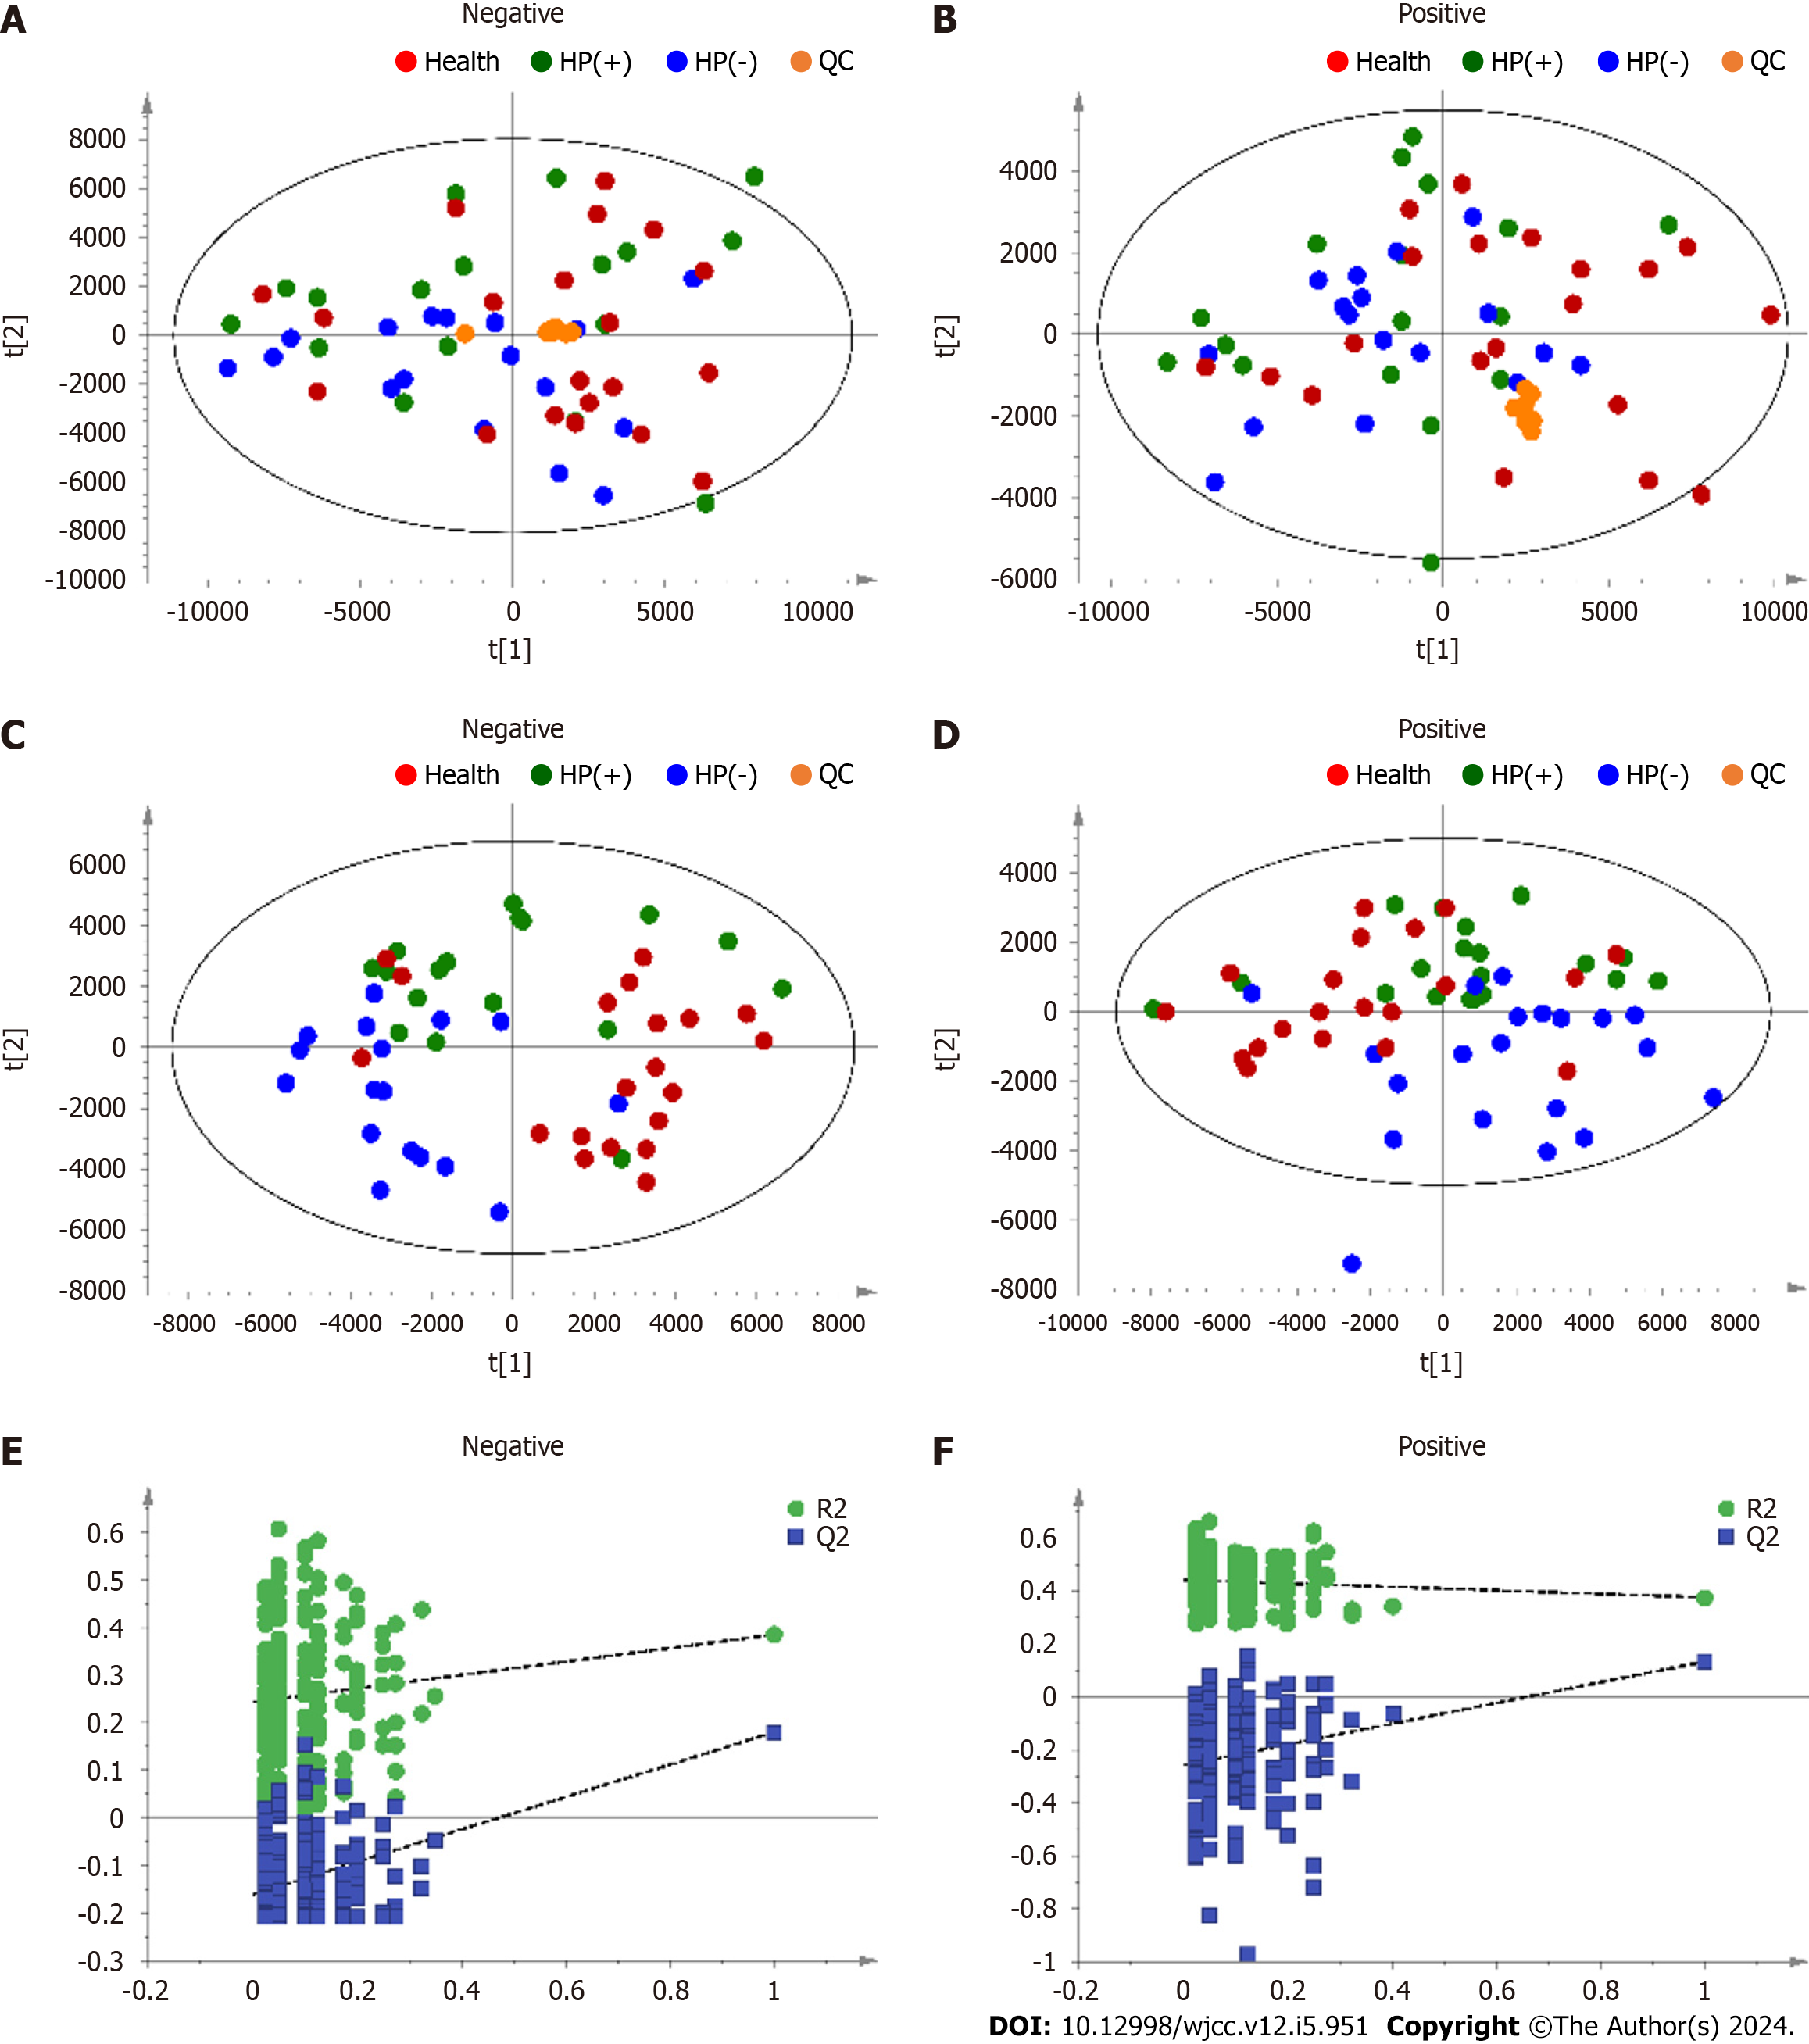
Figure 2 Principal component analysis and partial least square discriminant analysis score scatter plots from urine analysis data.
A, B: Principal component analysis (PCA) model score scatter plots; C, D: Partial least square discriminant analysis (PLS–DA) model score scatter plots; and (E and F) PLS-DA validation plot; A, C, E: Negative electronspray ionization (ESI) mode; B, D, F: Positive ESI mode. HP(+): Helicobacter pylori-positive; HP(−): Helicobacter pylori-negative.
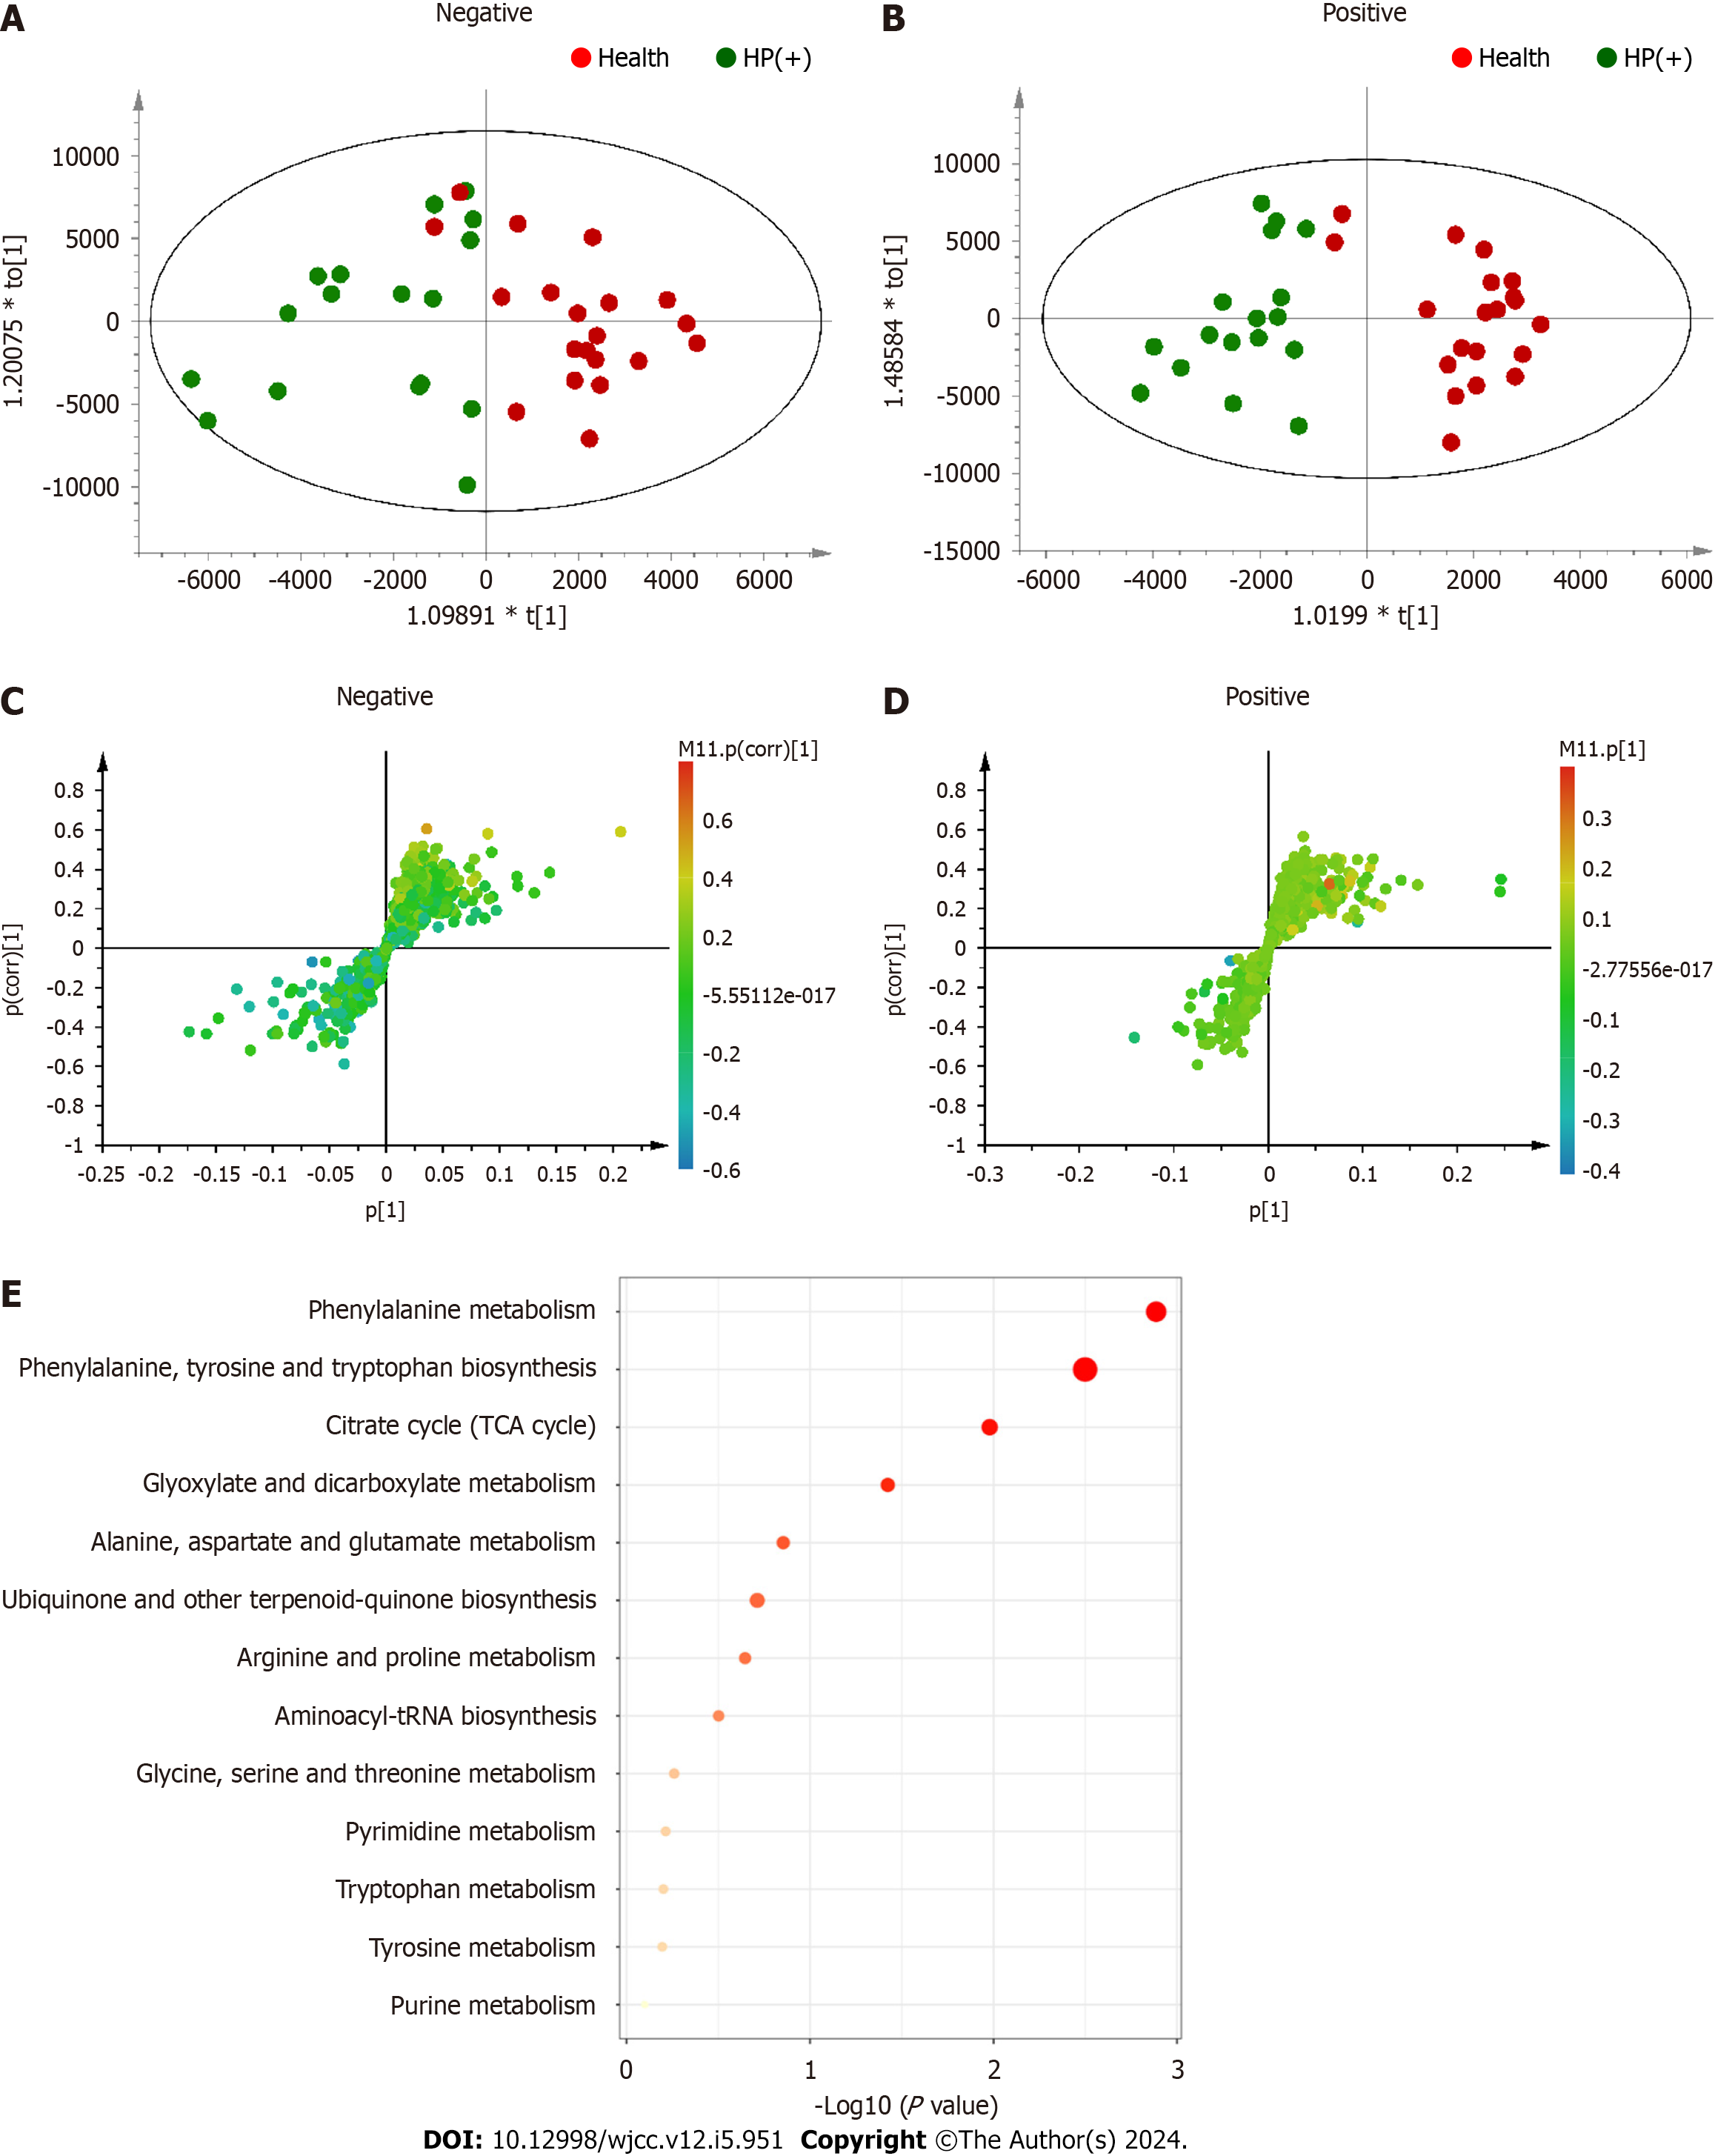
Figure 3 Orthogonal partial least square discriminant analysis and pathway enrichment analysis of the health and Helicobacter pylori-positive samples.
A, B: Orthogonal partial least square (OPLS) score plots; C, D: S-plots; A, C: Negative electronspray ionization (ESI) mode; B, D: Positive ESI mode. Model parameters of the negative ESI mode: R2X = 0.537, R2Y = 0.935, and Q2 = −0.33. Model parameters of the positive ESI mode: R2X = 0.467, R2Y = 0.955, and Q2 = −0.0553; E: Pathway enrichment analysis of differential metabolites between Helicobacter pylori-negative and health samples. Differential metabolites were obtained from OPLS–discriminant analysis and subjected to Kyoto encyclopedia of genes and genomes analysis using MetaboAnalyst software. Helicobacter pylori-positive; HP(−): Helicobacter pylori-negative.
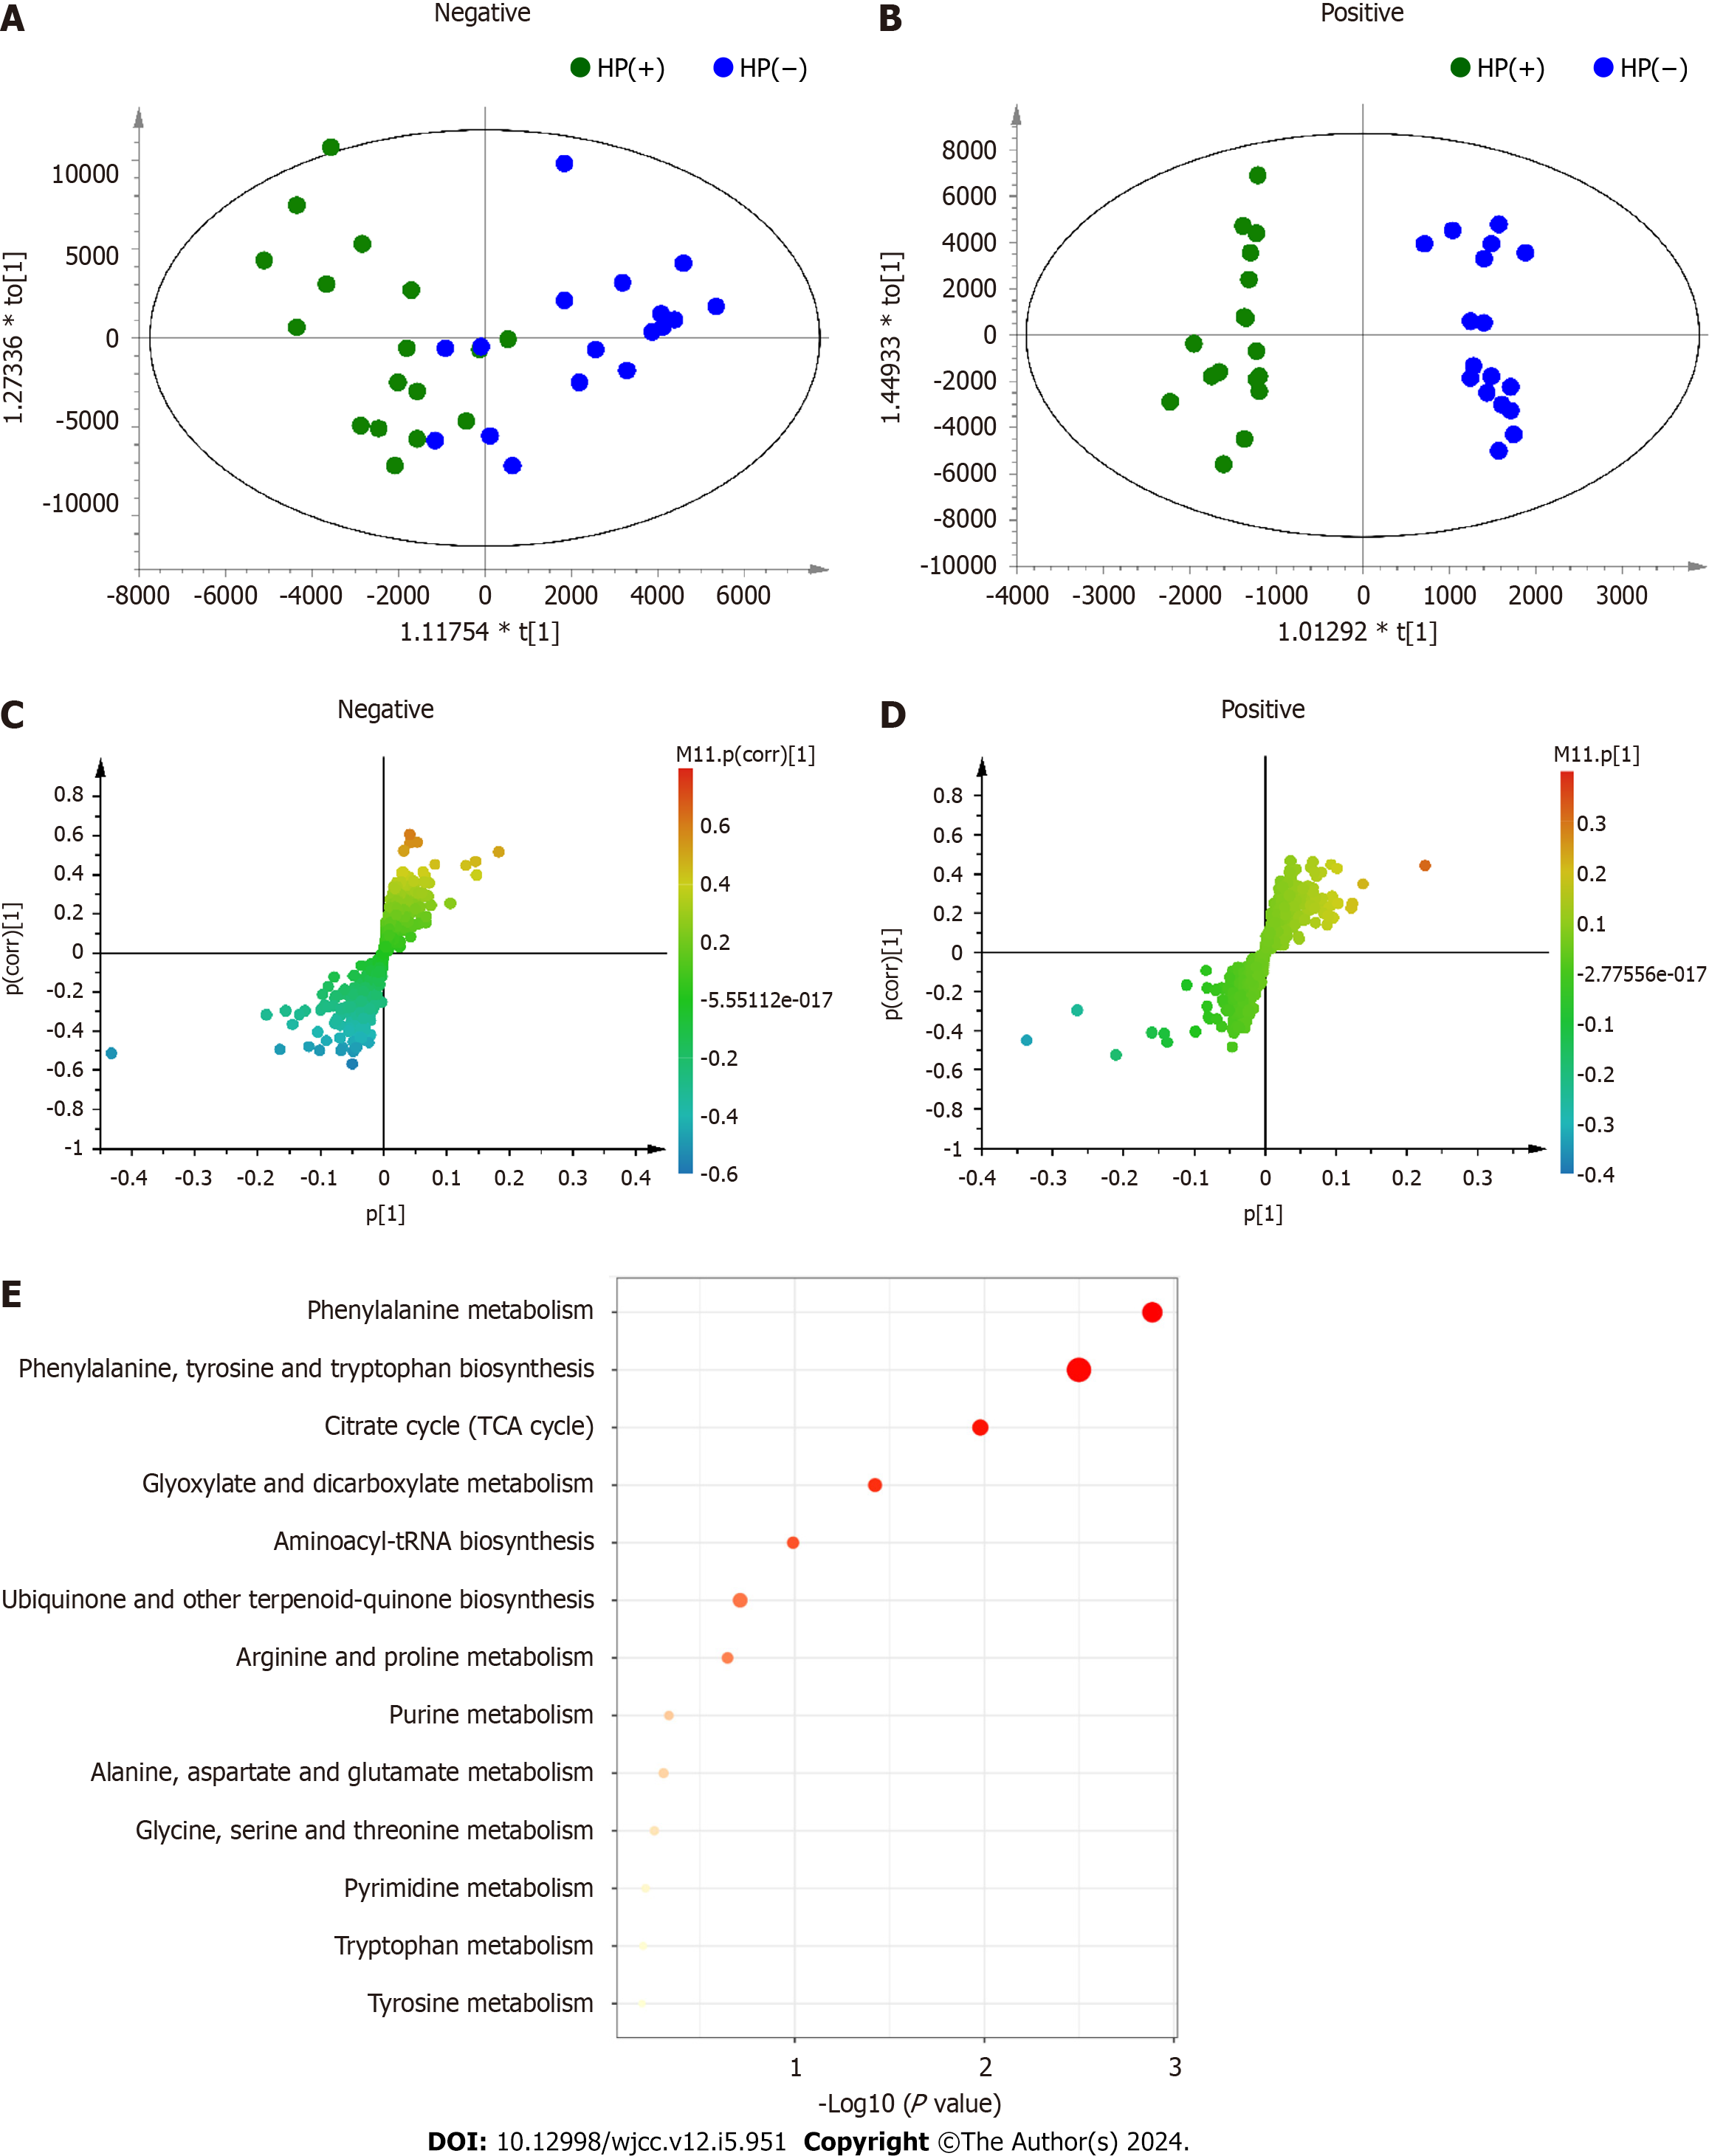
Figure 4 Orthogonal partial least square discriminant analysis and pathway enrichment analysis between the Helicobacter pylori-positive and -negative samples.
A, B: Orthogonal partial least square (OPLS) score plots; C, D: S-plots; A, C: Negative electronspray ionization (ESI) mode; B, D: Positive ESI mode. Model parameters of the negative ESI mode: R2X = 0.472, R2Y = 0.944, and Q2 = 0.119; model parameters of the positive ESI mode: R2X = 0.424, R2Y = 0.985, and Q2 = −0.109; E: Pathway enrichment analysis of differential metabolites between the Helicobacter pylori-negative and -positive samples. Differential metabolites were obtained from the OPLS–discriminant analysis and subjected to Kyoto encyclopedia of genes and genomes analysis using MetaboAnalyst. Helicobacter pylori-positive; HP(−): Helicobacter pylori-negative.
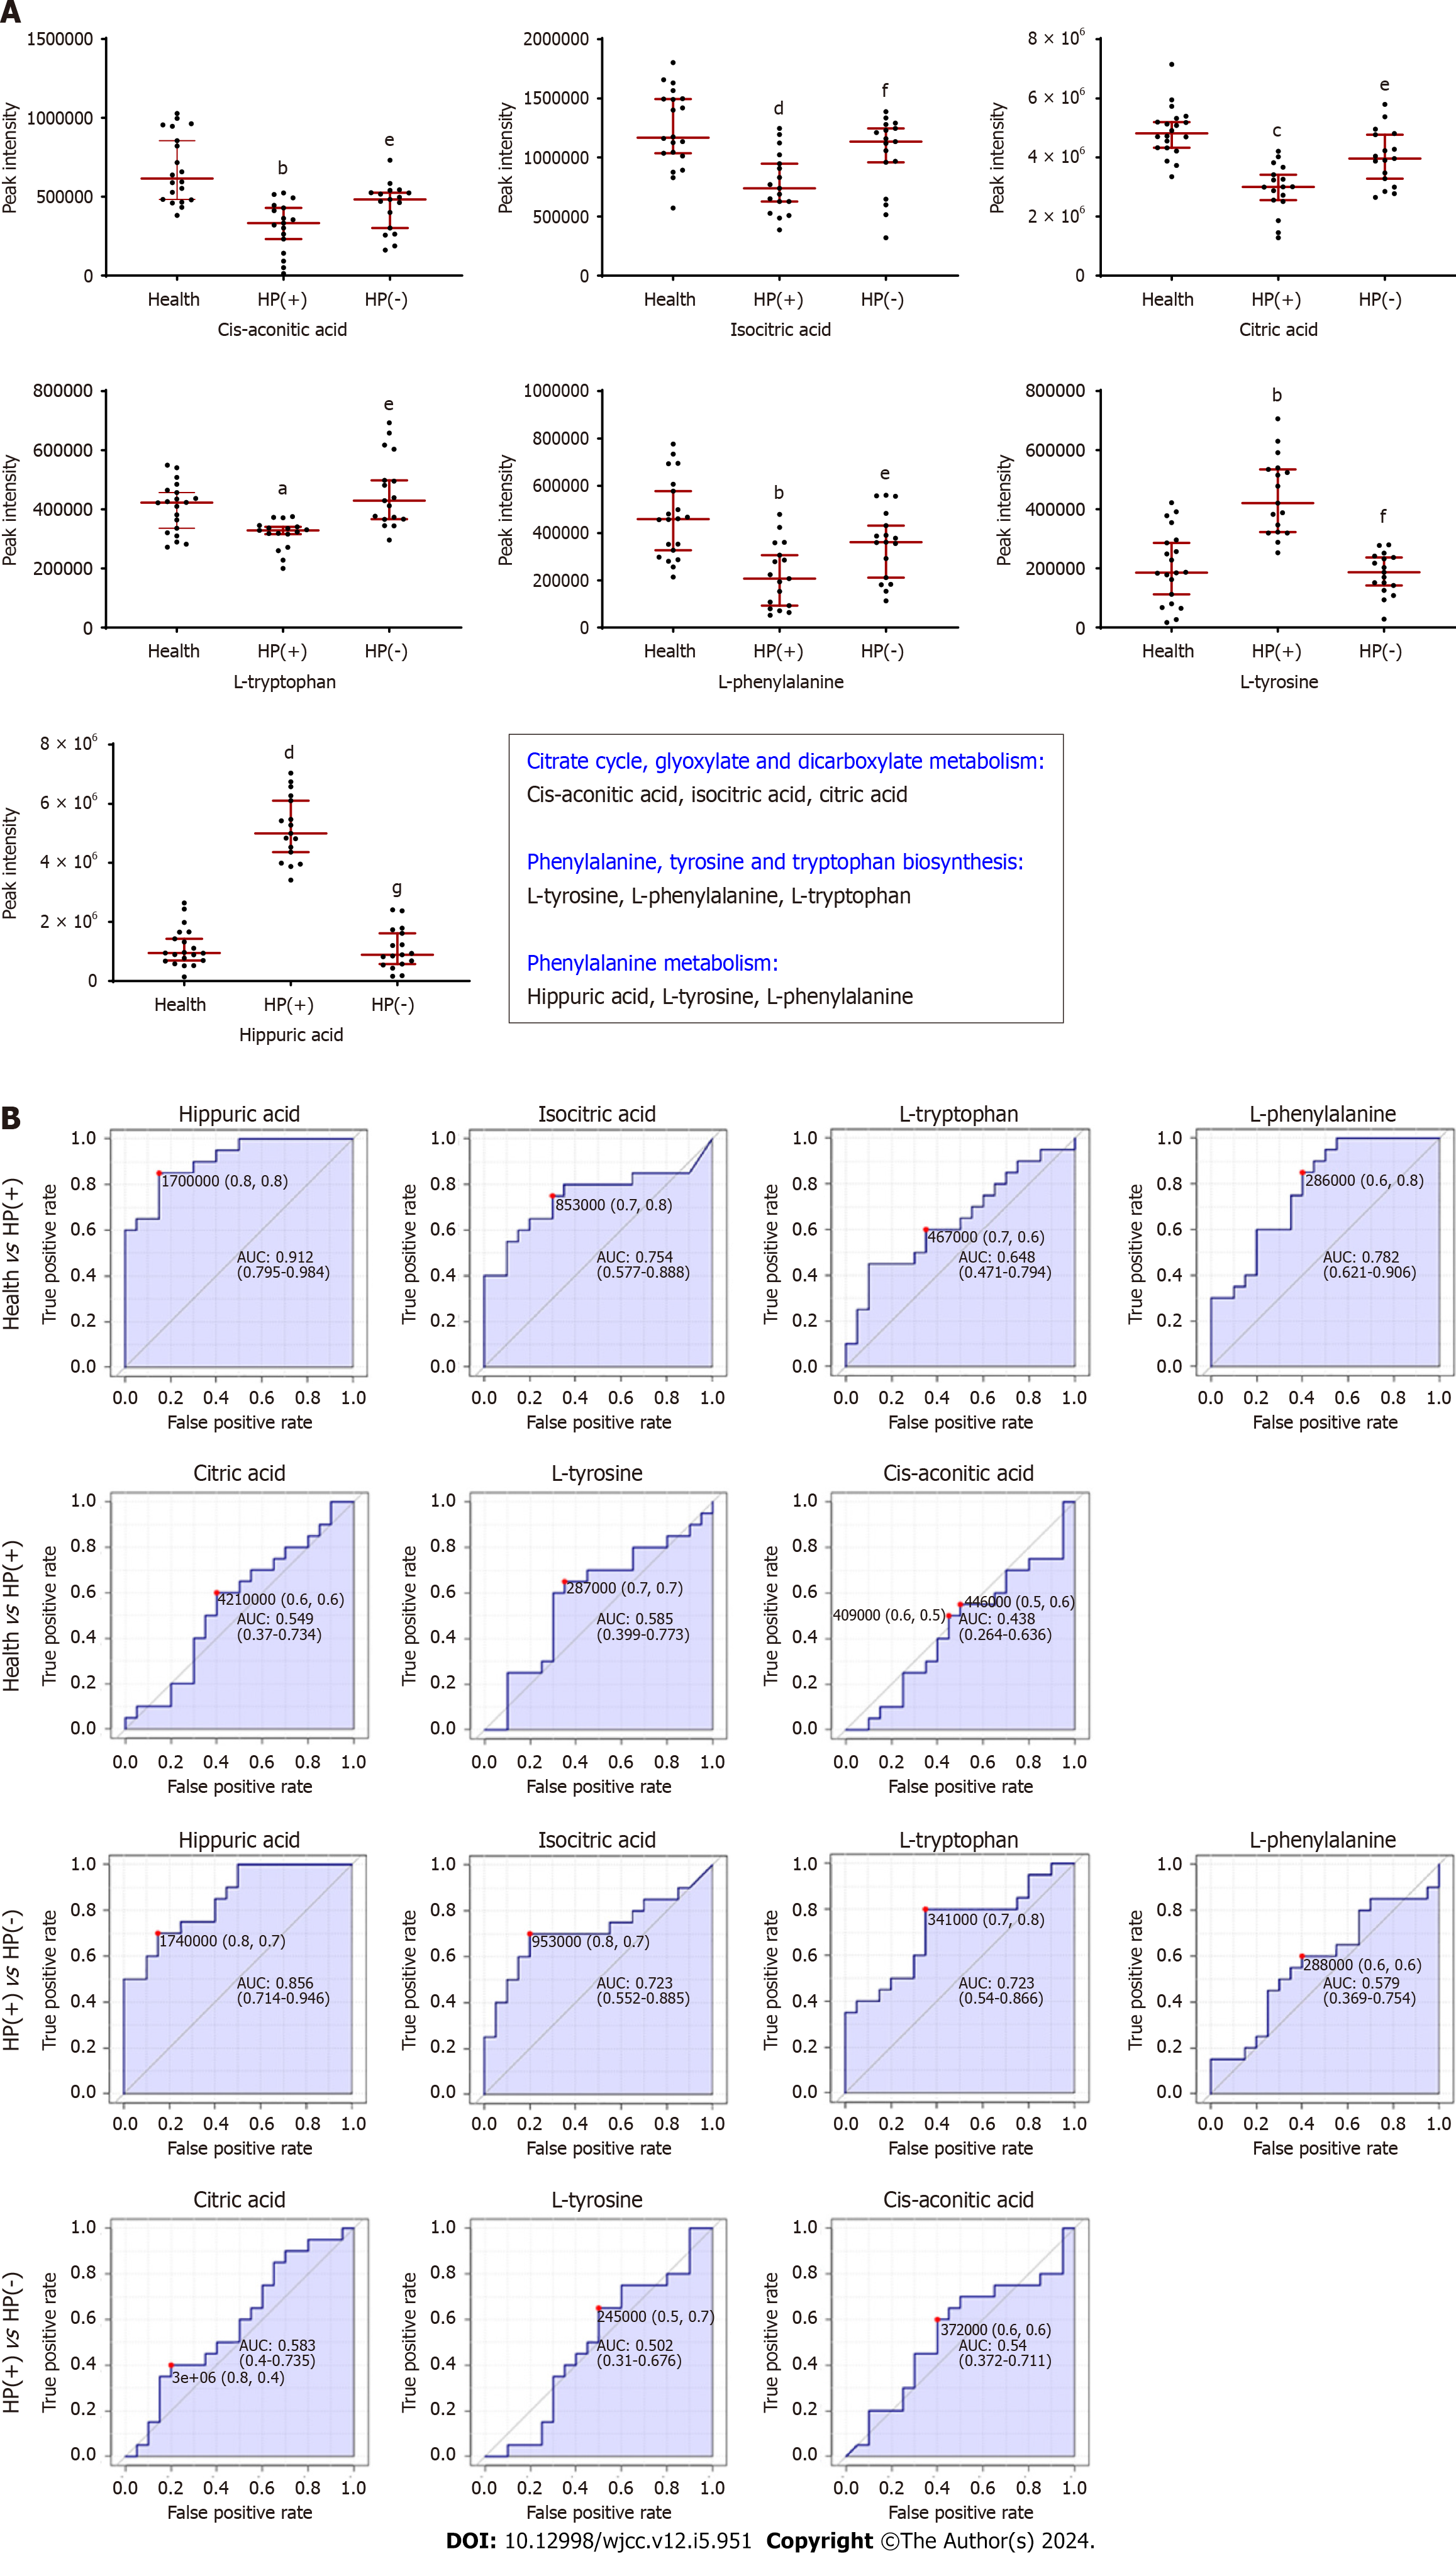
Figure 5 Metabolites involved in Helicobacter pylori elimination.
A: Peak intensity of the significant urinary metabolites associated with chronic gastritis management during Helicobacter pylori (H. pylori) elimination. Data presented as the mean ± SD (n = 20). P < 0.05 was considered to represent significance. Health group vs H. pylori-positive [HP(+)] group: aP < 0.05, bP < 0.01, cP < 0.001, and dP < 0.0001; HP(+) group vs H. pylori-negative group: eP < 0.05, fP < 0.01, and gP < 0.0001; B: Receiver operating characteristic curve analysis of seven identified biomarkers. Helicobacter pylori-positive; HP(−): Helicobacter pylori-negative.
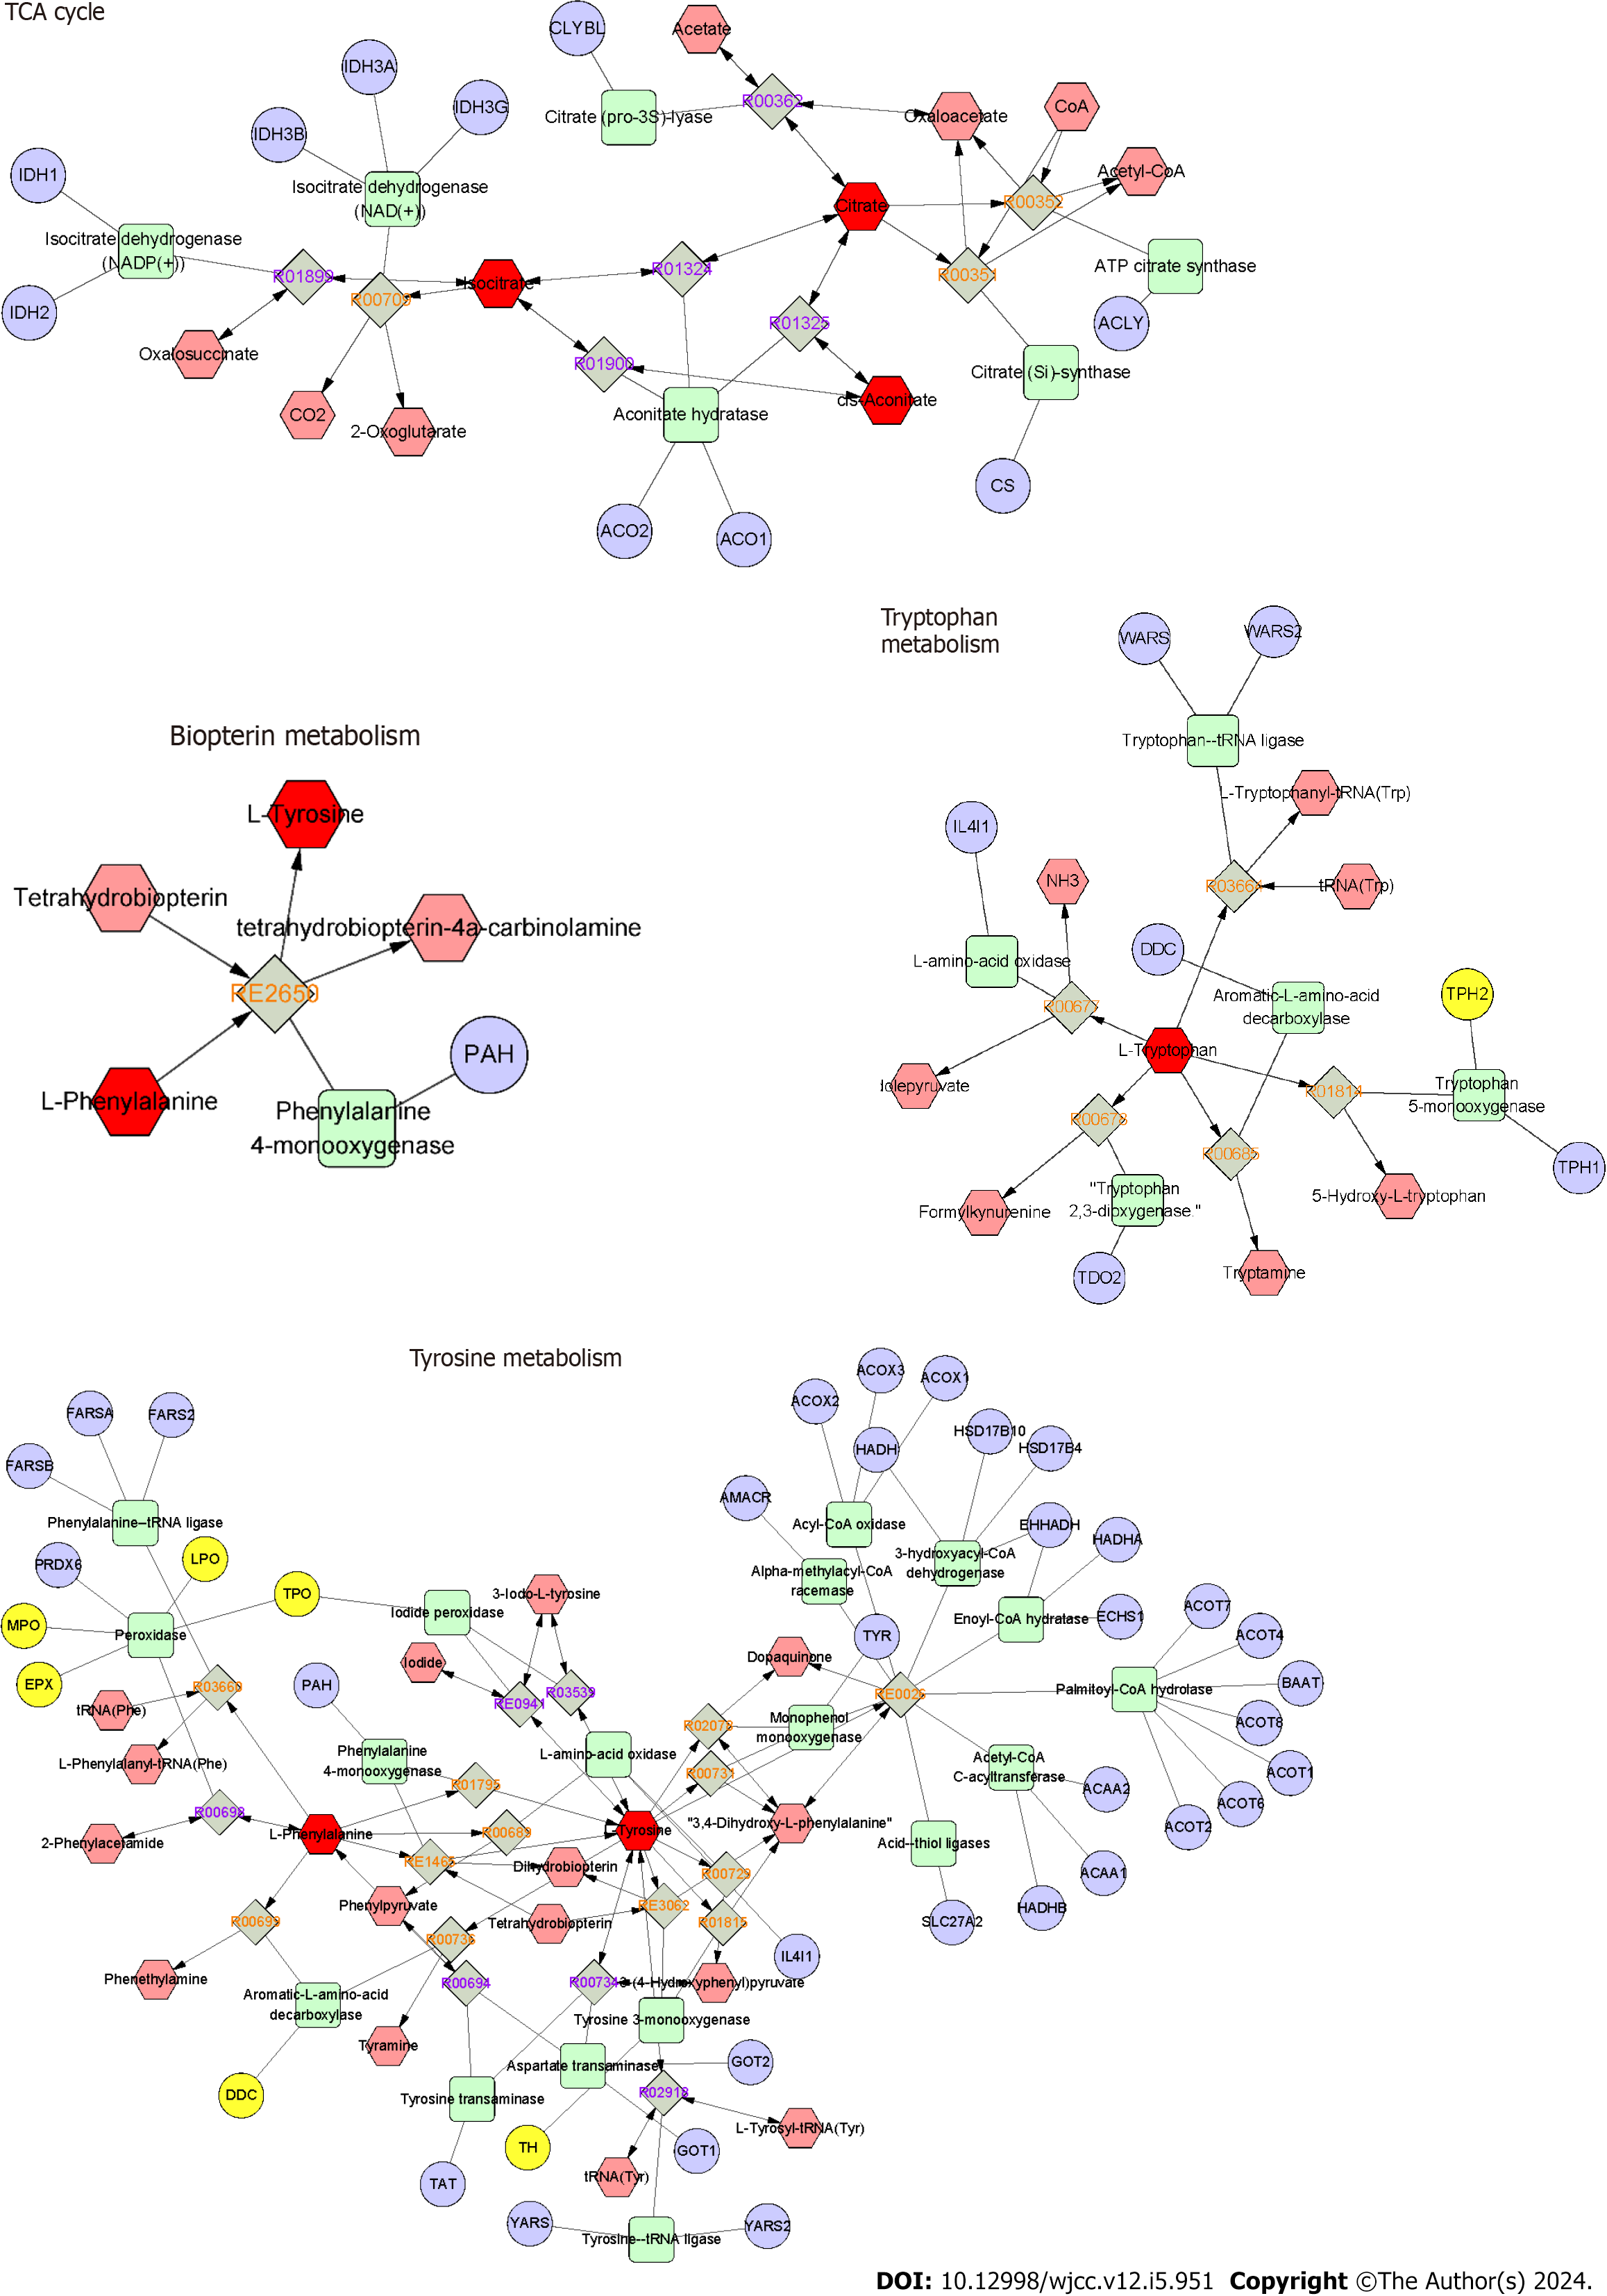
Figure 6 The metabolite-reaction-enzyme-gene networks of the key metabolites and targets.
The hexagons, diamonds, rounded rectangles, and circles represent the metabolites, reactions, metabolic enzymes, and regulatory genes of metabolic enzymes, respectively. The differential metabolites and differential metabolite-related metabolites are shown as dark and bright red hexagons, respectively. The yellow circles represent the potential proteins involved in the regulation of the identified differential metabolites in Helicobacter pylori-positive chronic gastritis.
- Citation: An WT, Hao YX, Li HX, Wu XK. Urinary metabolic profiles during Helicobacter pylori eradication in chronic gastritis. World J Clin Cases 2024; 12(5): 951-965
- URL: https://www.wjgnet.com/2307-8960/full/v12/i5/951.htm
- DOI: https://dx.doi.org/10.12998/wjcc.v12.i5.951


