Copyright
©The Author(s) 2024.
World J Clin Cases. Aug 26, 2024; 12(24): 5558-5567
Published online Aug 26, 2024. doi: 10.12998/wjcc.v12.i24.5558
Published online Aug 26, 2024. doi: 10.12998/wjcc.v12.i24.5558
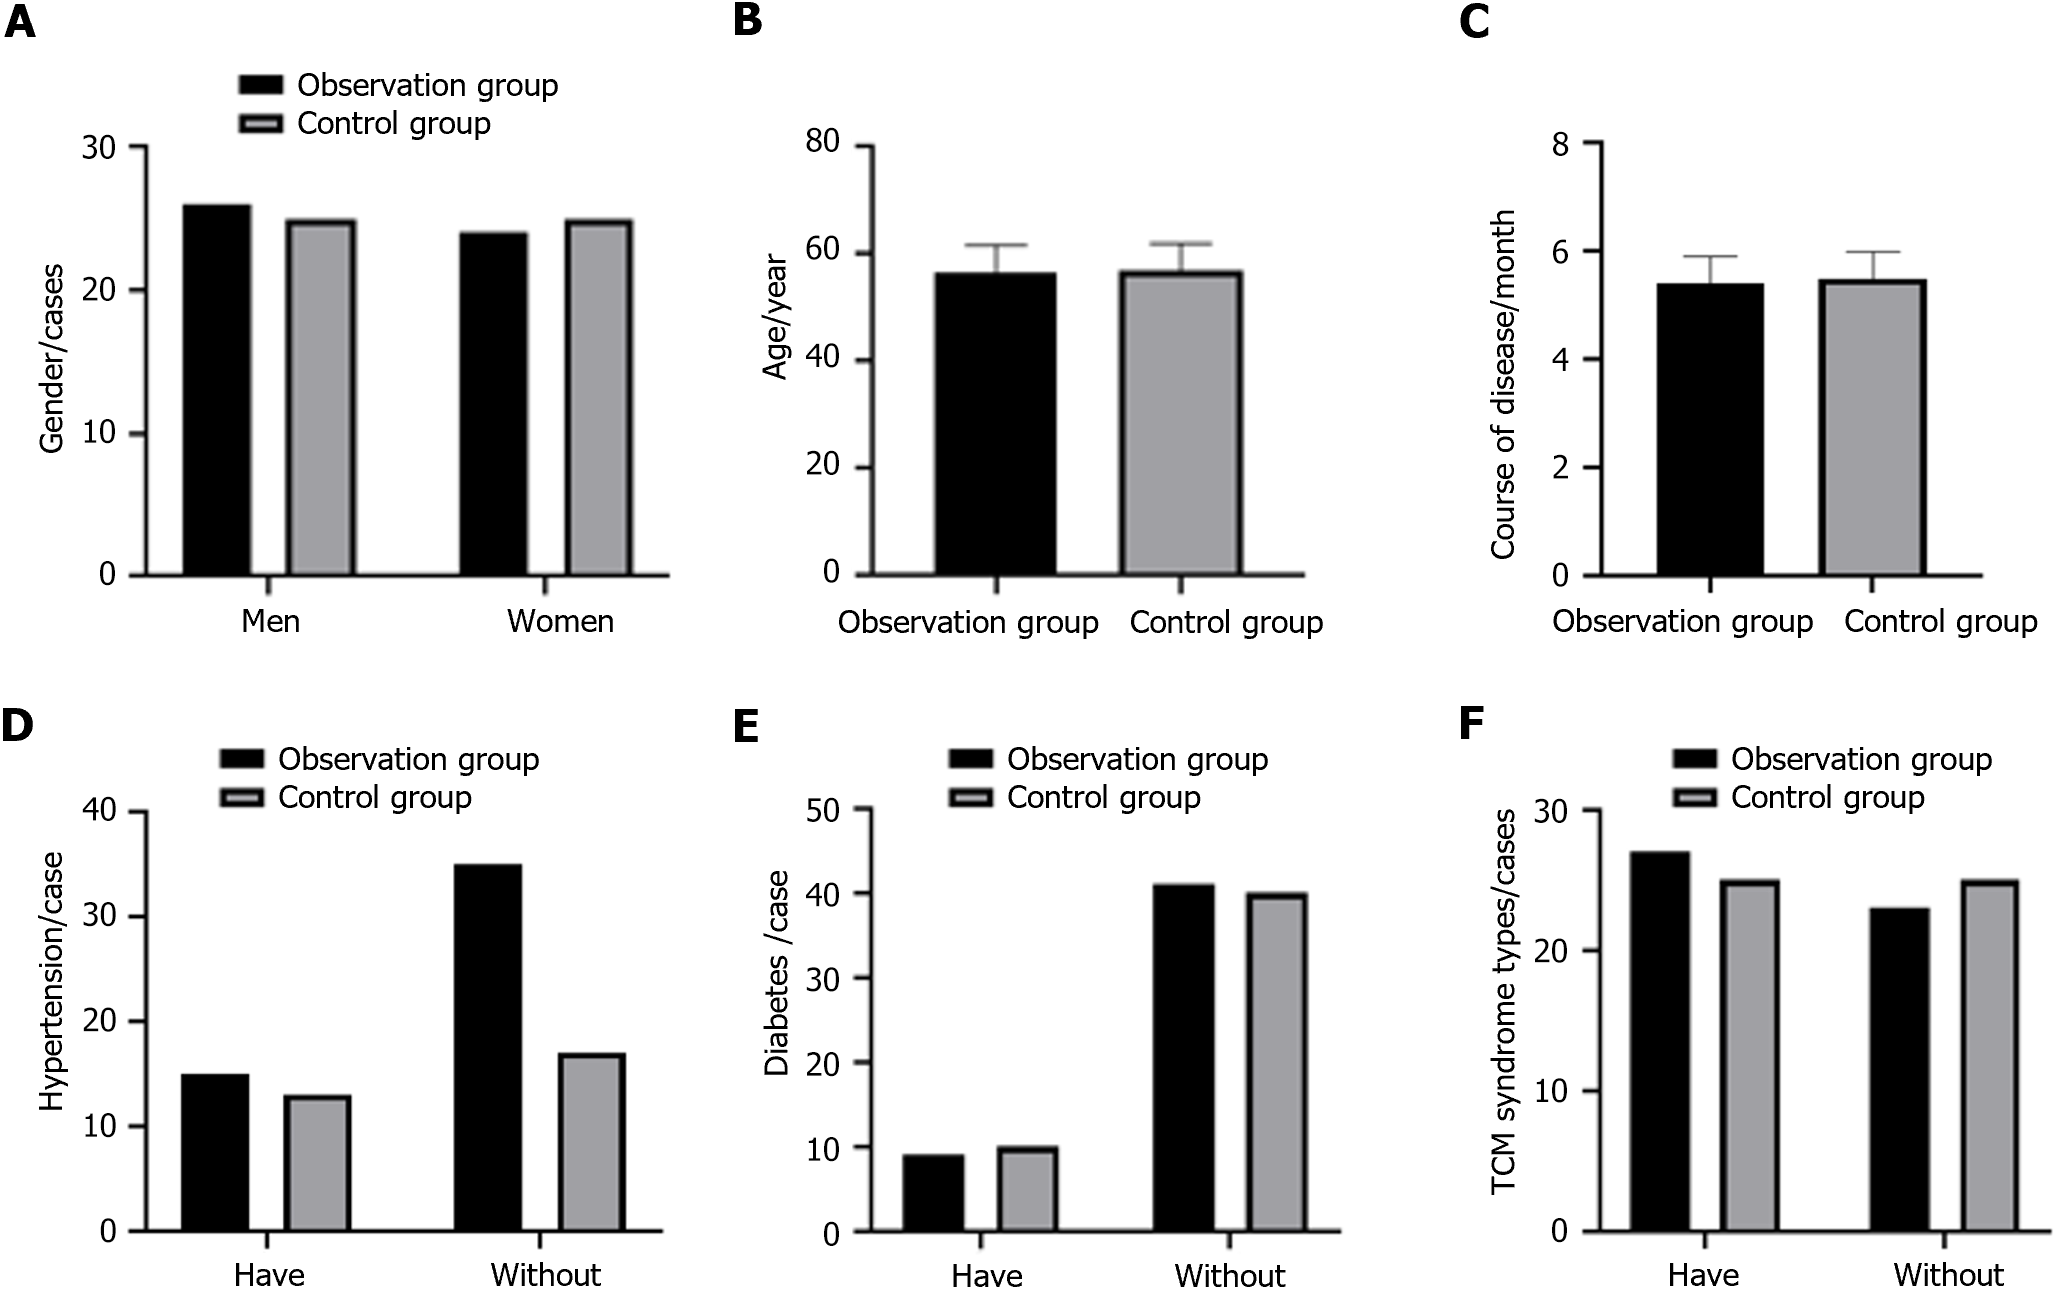
Figure 1 Comparison of two groups of data.
A: Sex; B: Age; C: Course of disease; D: Hypertension; E: Diabetes; F: Traditional Chinese medicine (TCM) syndrome types.
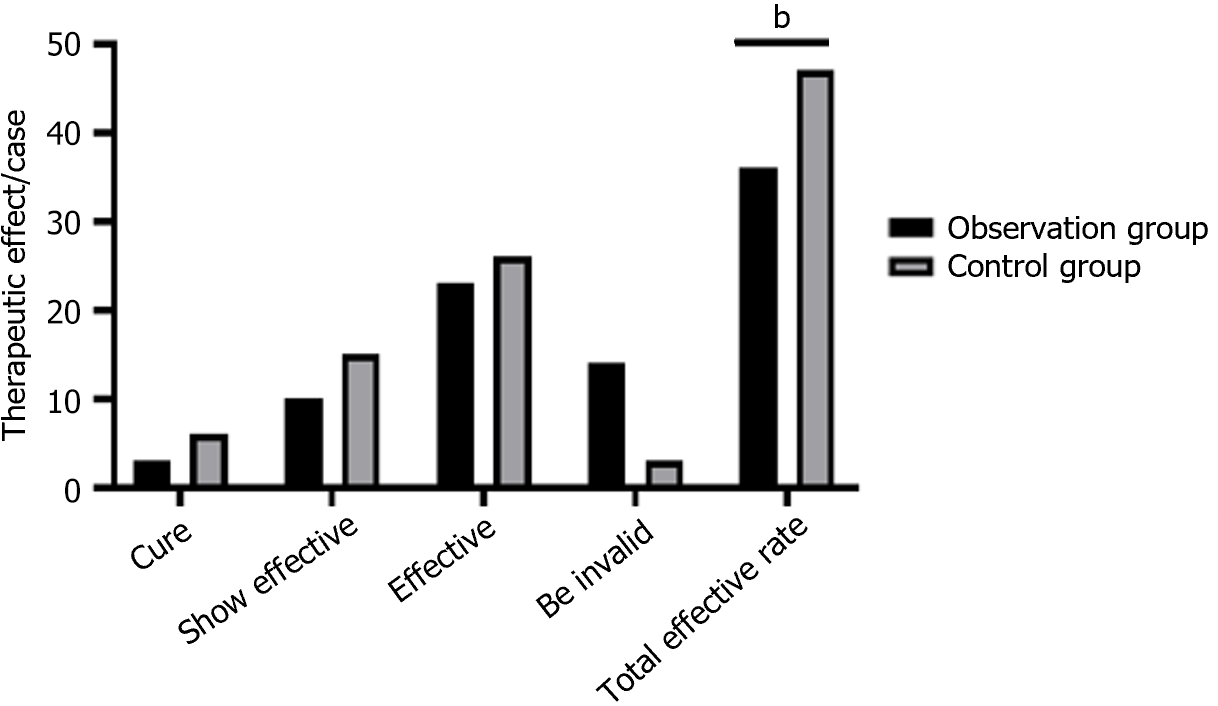
Figure 2 Comparison of clinical efficacy between the two groups.
bP < 0.05 indicates a statistically significant difference between the control group and the study group.
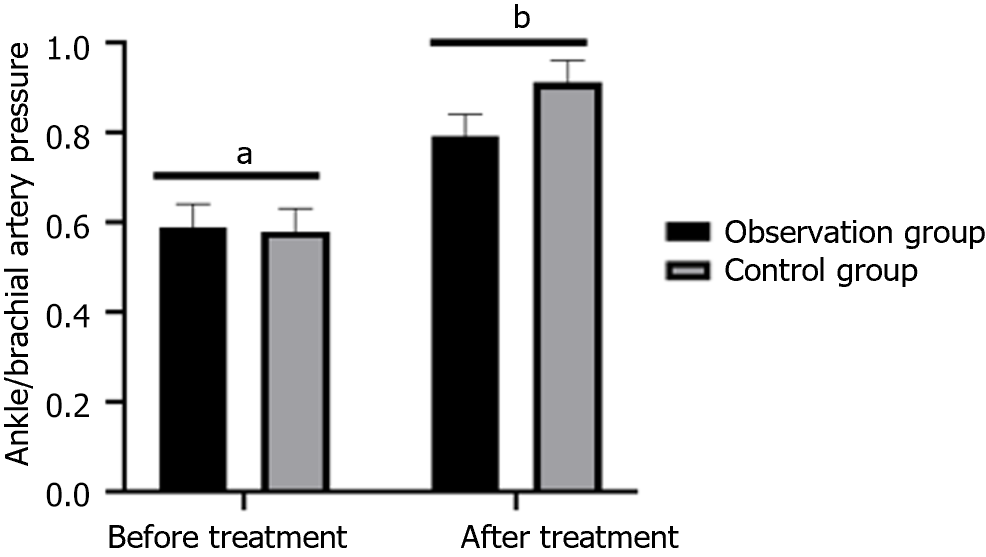
Figure 3 Comparison of ankle-brachial artery pressure ratio between two groups.
aP > 0.05 indicates no significant difference between the study and control groups; bP < 0.05 indicates that the difference between the study and control groups was statistically significant.
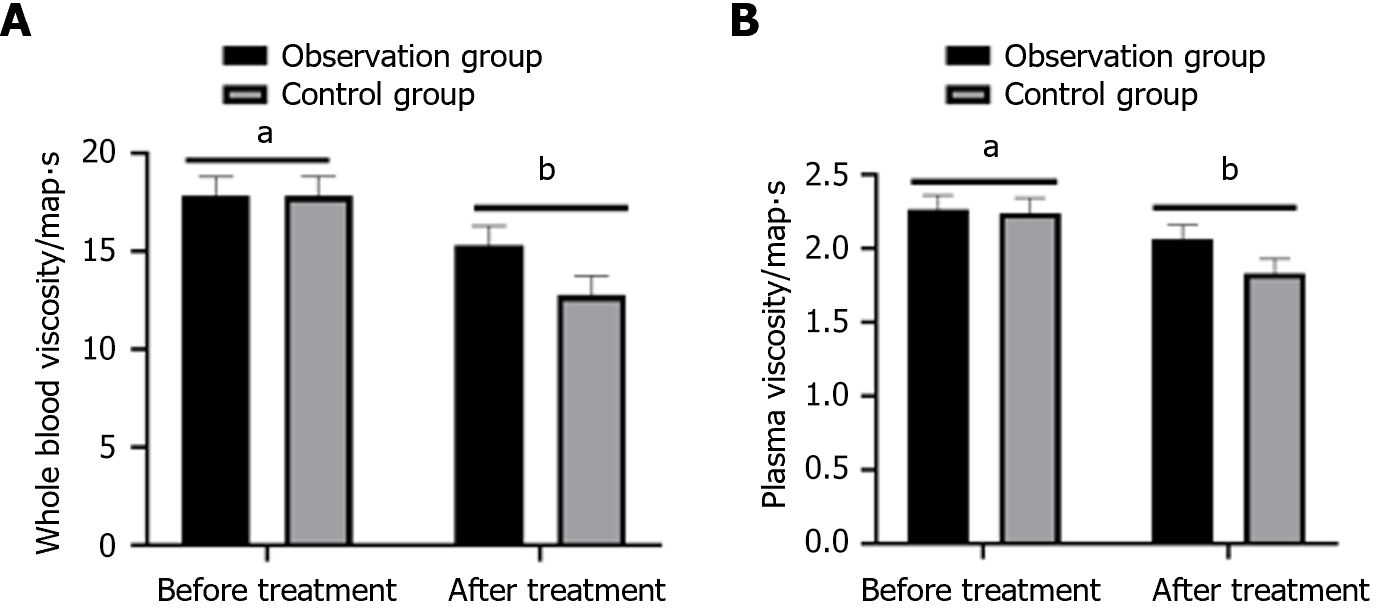
Figure 4 Comparison of hemorheological indicators between the two groups.
A: Whole blood viscosity; B: Plasma viscosity. aP > 0.05 indicates no significant difference between the study and control groups; bP < 0.05 indicates that the difference between the study and control groups was statistically significant.
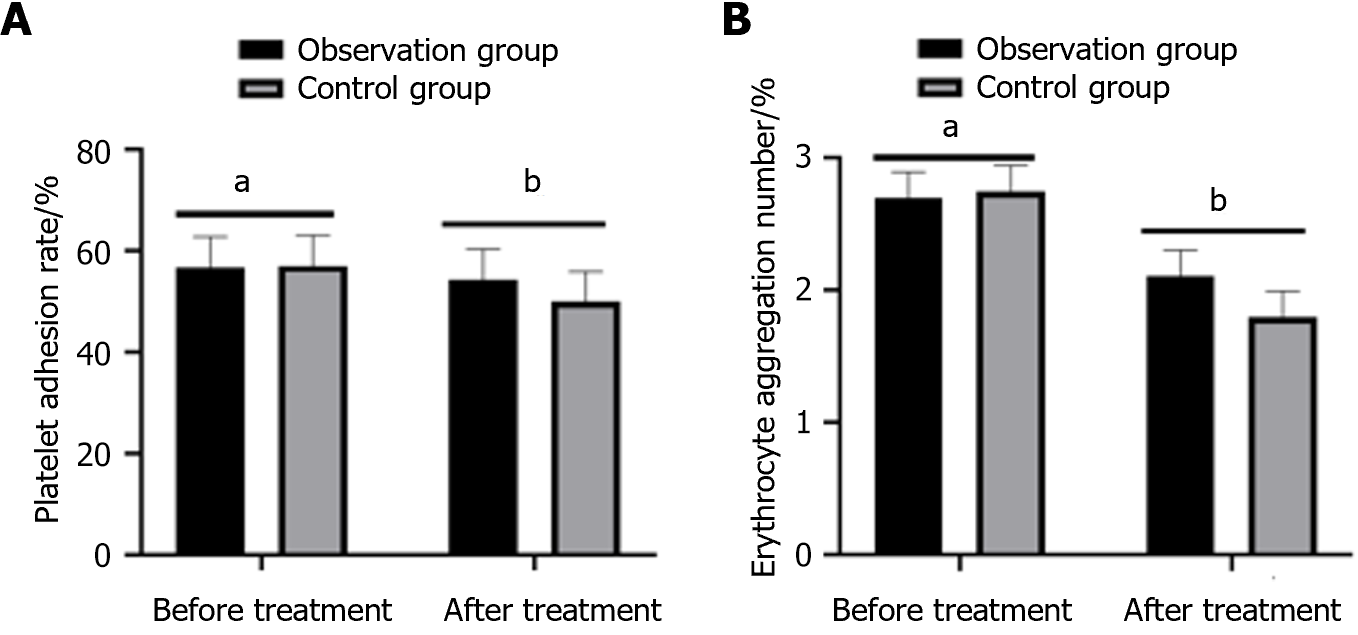
Figure 5 Comparison of hemorheological indicators between the two groups.
A: Platelet adhesion rate; B: Erythrocyte aggregation number. aP > 0.05 indicates no significant difference between the study and control groups; bP < 0.05 indicates that the difference between the study and control groups was statistically significant.
Figure 6 Comparison of traditional Chinese medicine symptom scores between the two groups.
A: Skin temperature; B: Intermittent claudication; C: Resting pain. aP > 0.05 indicates no significant difference between the study and control groups; bP < 0.05 indicates that the difference between the study and control groups was statistically significant.
Figure 7 Oxidative stress indicators.
A: Malondialdehyde (MDA); B: Superoxide dismutase (SOD); C: Myeloperoxidase (MPO). aP > 0.05 indicates no significant difference between the study and control groups; bP < 0.05 indicates that the difference between the study and control groups was statistically significant.
Figure 8 Inflammatory factor indicators.
A: Interleukin (IL)-6; B: IL-8; C: C-reactive protein (CRP). aP > 0.05 indicates no significant difference between the study and control groups; bP < 0.05 indicates that the difference between the study and control groups was statistically significant.
- Citation: Li YP, Su T, Xue XL, Shi HR, Su ZH, Li J. Application of buried auricular point combined with Wenjing Sanhan prescription in arteriosclerosis obliterans patients with resting pain. World J Clin Cases 2024; 12(24): 5558-5567
- URL: https://www.wjgnet.com/2307-8960/full/v12/i24/5558.htm
- DOI: https://dx.doi.org/10.12998/wjcc.v12.i24.5558


