Copyright
©The Author(s) 2024.
World J Clin Cases. Aug 6, 2024; 12(22): 4992-4998
Published online Aug 6, 2024. doi: 10.12998/wjcc.v12.i22.4992
Published online Aug 6, 2024. doi: 10.12998/wjcc.v12.i22.4992
Figure 1 Estradiol, luteinizing hormone, and follicle-stimulating hormone levels before and after treatment in the two groups.
A: Pre- and post-treatment estradiol levels; B: Pre- and post-treatment luteinizing hormone levels; C: Pre- and post-treatment follicle-stimulating hormone levels. bP < 0.01, vs before treatment; cP < 0.05 vs control. E2: Estradiol; LH: Luteinizing hormone; FSH: Follicle-stimulating hormone.
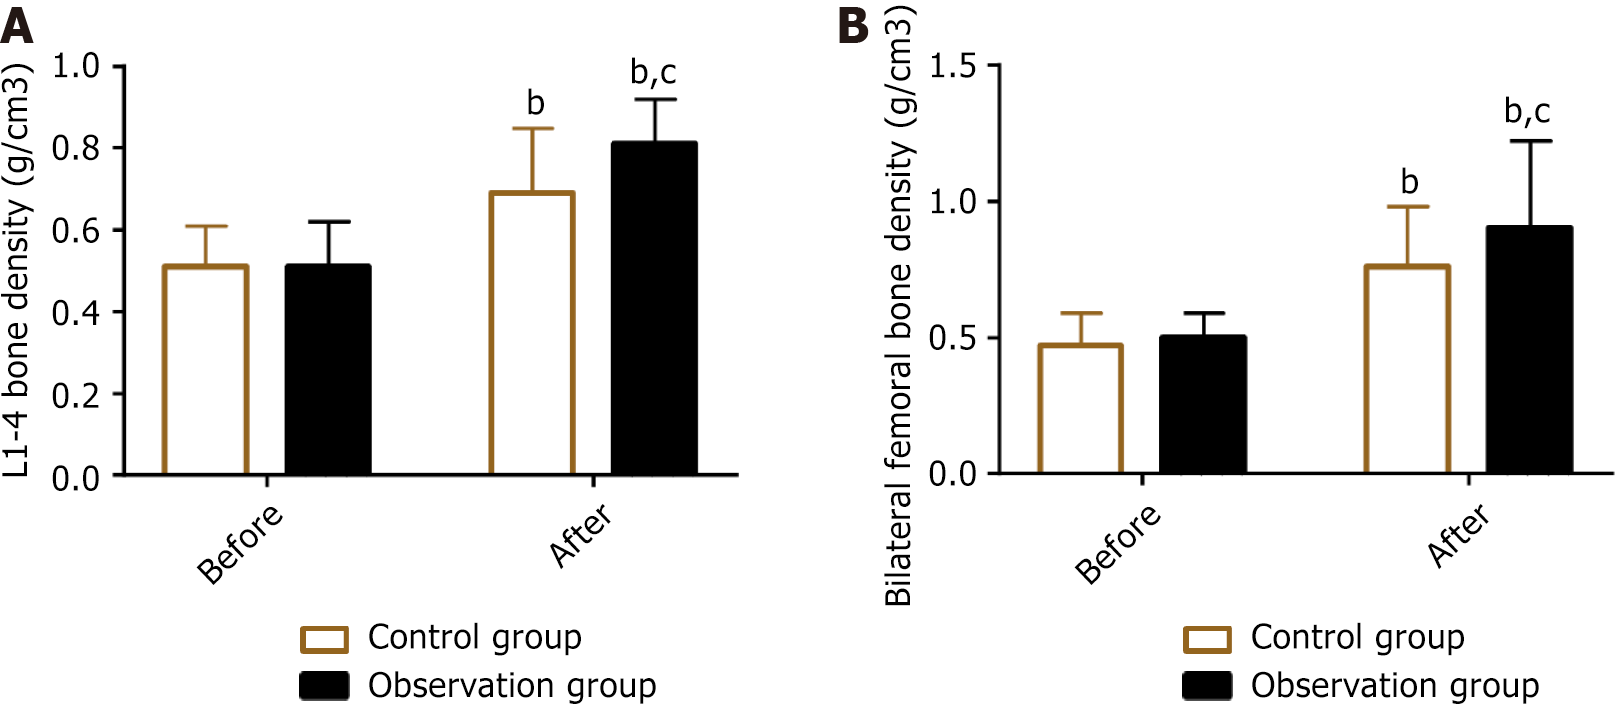
Figure 2 Lumbar spine (L1–4) and bilateral femoral bone mineral density before and after treatment.
A: L1–4 bone mineral density before and after treatment; B: Bilateral femoral bone mineral density before and after treatment. bP < 0.01, vs before treatment; cP < 0.05 vs control.
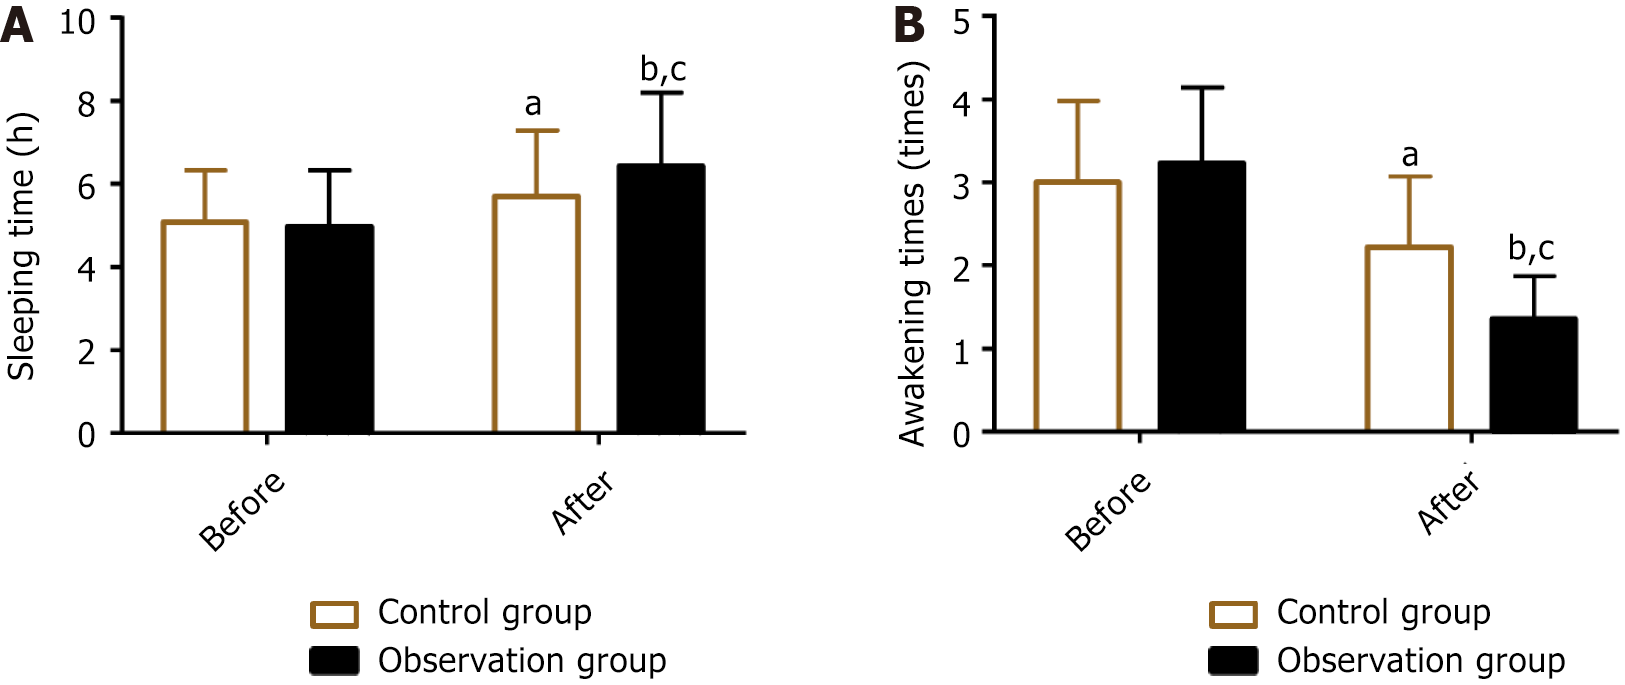
Figure 3 Pre- and post-treatment sleeping time and frequency of awakenings from sleep in the two groups.
A: Pre- and post-treatment sleeping time; B: Pre- and post-treatment frequency of awakenings from sleep. aP < 0.05, bP < 0.01, vs before treatment; cP < 0.05 vs control.
- Citation: Kuang YY, Xiong MQ, Cai JX. Clinical efficacy of gamma-oryzanol combined with Femoston for perimenopausal syndrome. World J Clin Cases 2024; 12(22): 4992-4998
- URL: https://www.wjgnet.com/2307-8960/full/v12/i22/4992.htm
- DOI: https://dx.doi.org/10.12998/wjcc.v12.i22.4992


