Copyright
©The Author(s) 2024.
World J Clin Cases. Jul 26, 2024; 12(21): 4742-4747
Published online Jul 26, 2024. doi: 10.12998/wjcc.v12.i21.4742
Published online Jul 26, 2024. doi: 10.12998/wjcc.v12.i21.4742
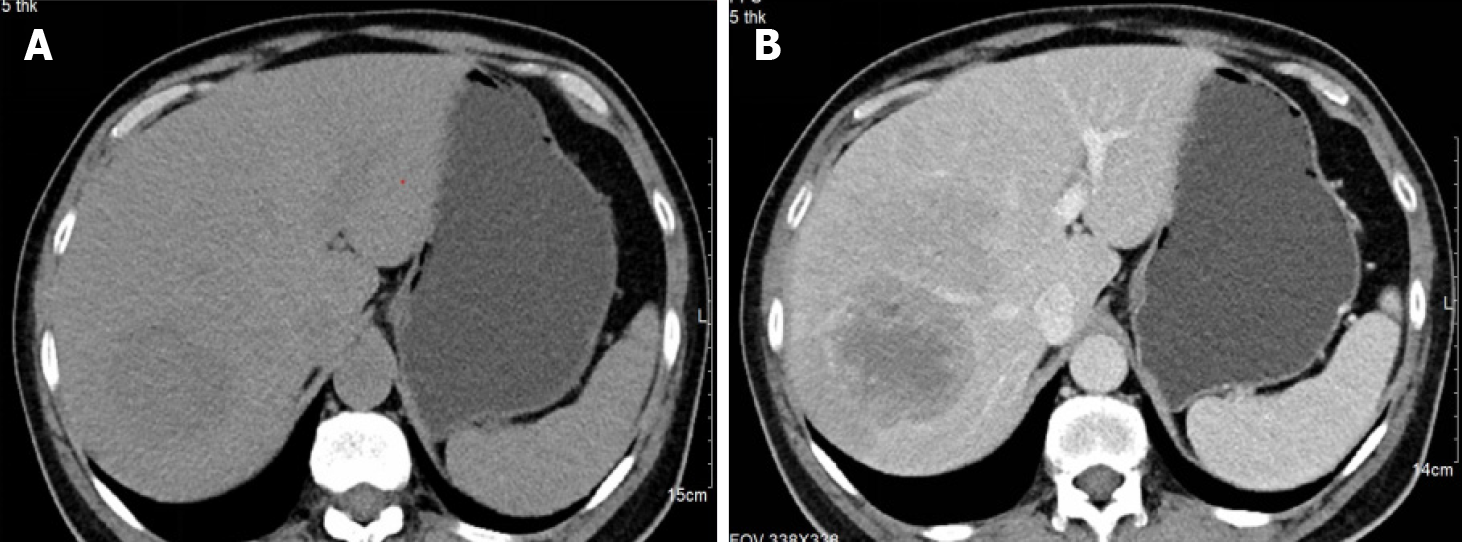
Figure 1 Computed tomography scan on admission, demonstrating clumpy low-density shadows in the liver section VII, the edges were blurred.
A: The edges were slightly enhanced after enhancement; B: The internal enhancement was uneven.
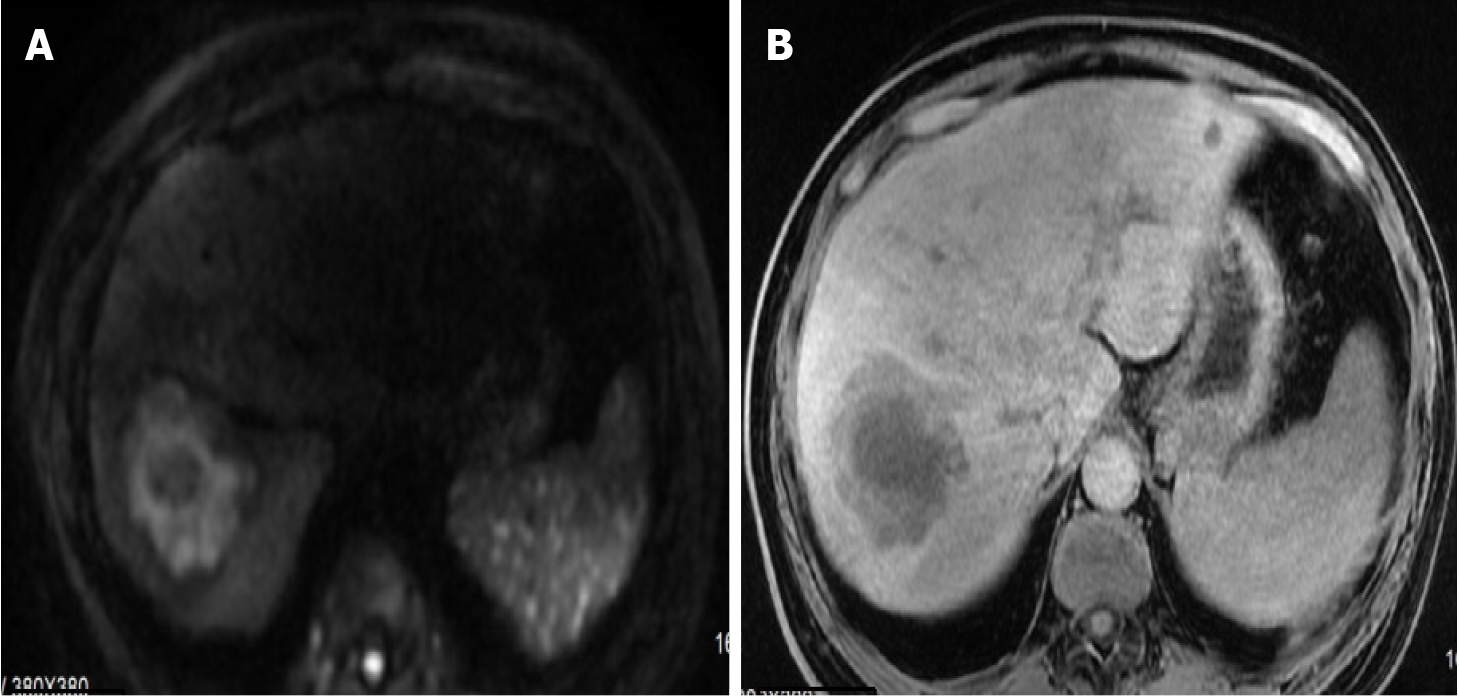
Figure 2 Magnetic resonance imaging axial sequences centered on the largest lesion.
A: Mass shadow VII of the liver showing layered hyposignal on T2-weighted image; B: A low hyposignal on T1-weighted image.
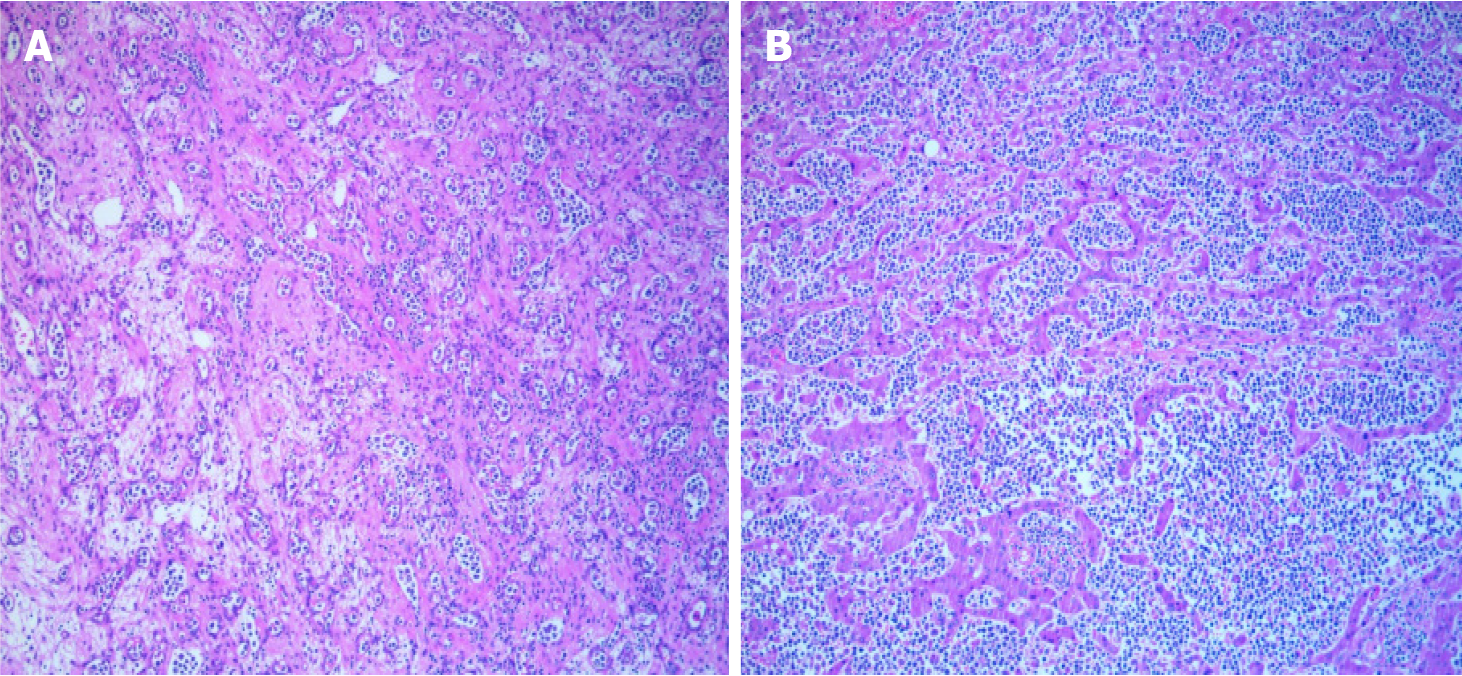
Figure 3 Liver tumor histopathology.
A: The expanded vascular cavity and the surrounding liver sinus are seen in the infiltration of cancerous lymphocyte cells [Hematoxylin-eosin (HE)-stained slide × 200); B: Multiple necrosis centers were accompanied by a multi-dose neutral granulocyte infiltration (HE-stained slide × 200).
- Citation: Xu ZY, Pan Y, Ye WJ, Liu JL, Wu XJ, Tang CL. Primary hepatic lymphoma presenting as pyogenic liver abscess: A case report. World J Clin Cases 2024; 12(21): 4742-4747
- URL: https://www.wjgnet.com/2307-8960/full/v12/i21/4742.htm
- DOI: https://dx.doi.org/10.12998/wjcc.v12.i21.4742


