Copyright
©The Author(s) 2024.
World J Clin Cases. Jul 26, 2024; 12(21): 4680-4690
Published online Jul 26, 2024. doi: 10.12998/wjcc.v12.i21.4680
Published online Jul 26, 2024. doi: 10.12998/wjcc.v12.i21.4680
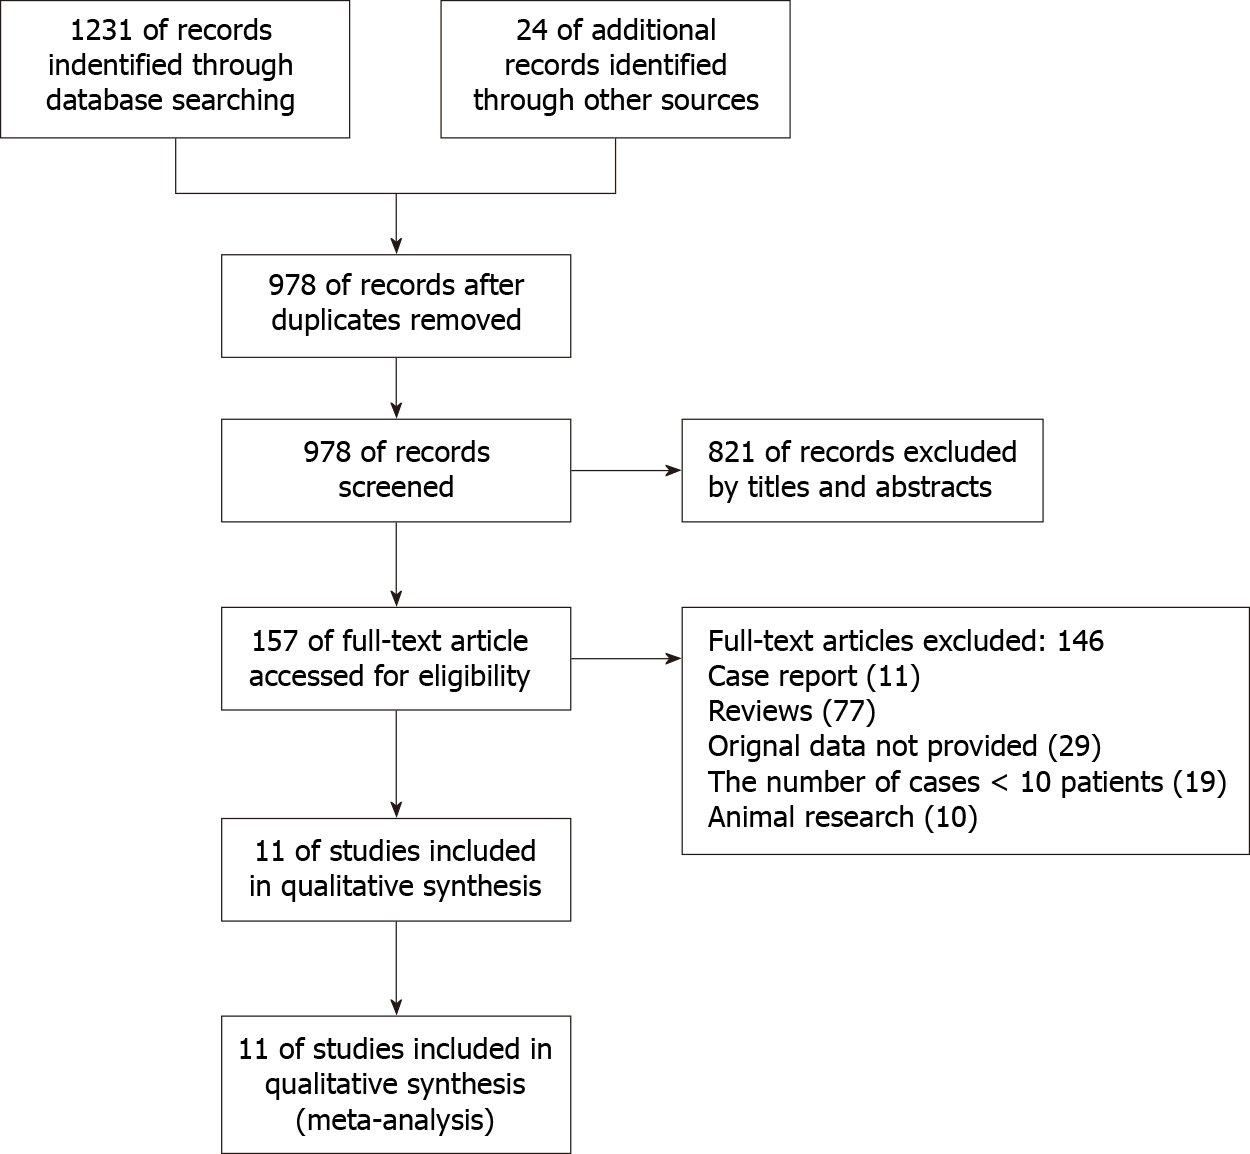
Figure 1 Flow chart for data search and gathering.
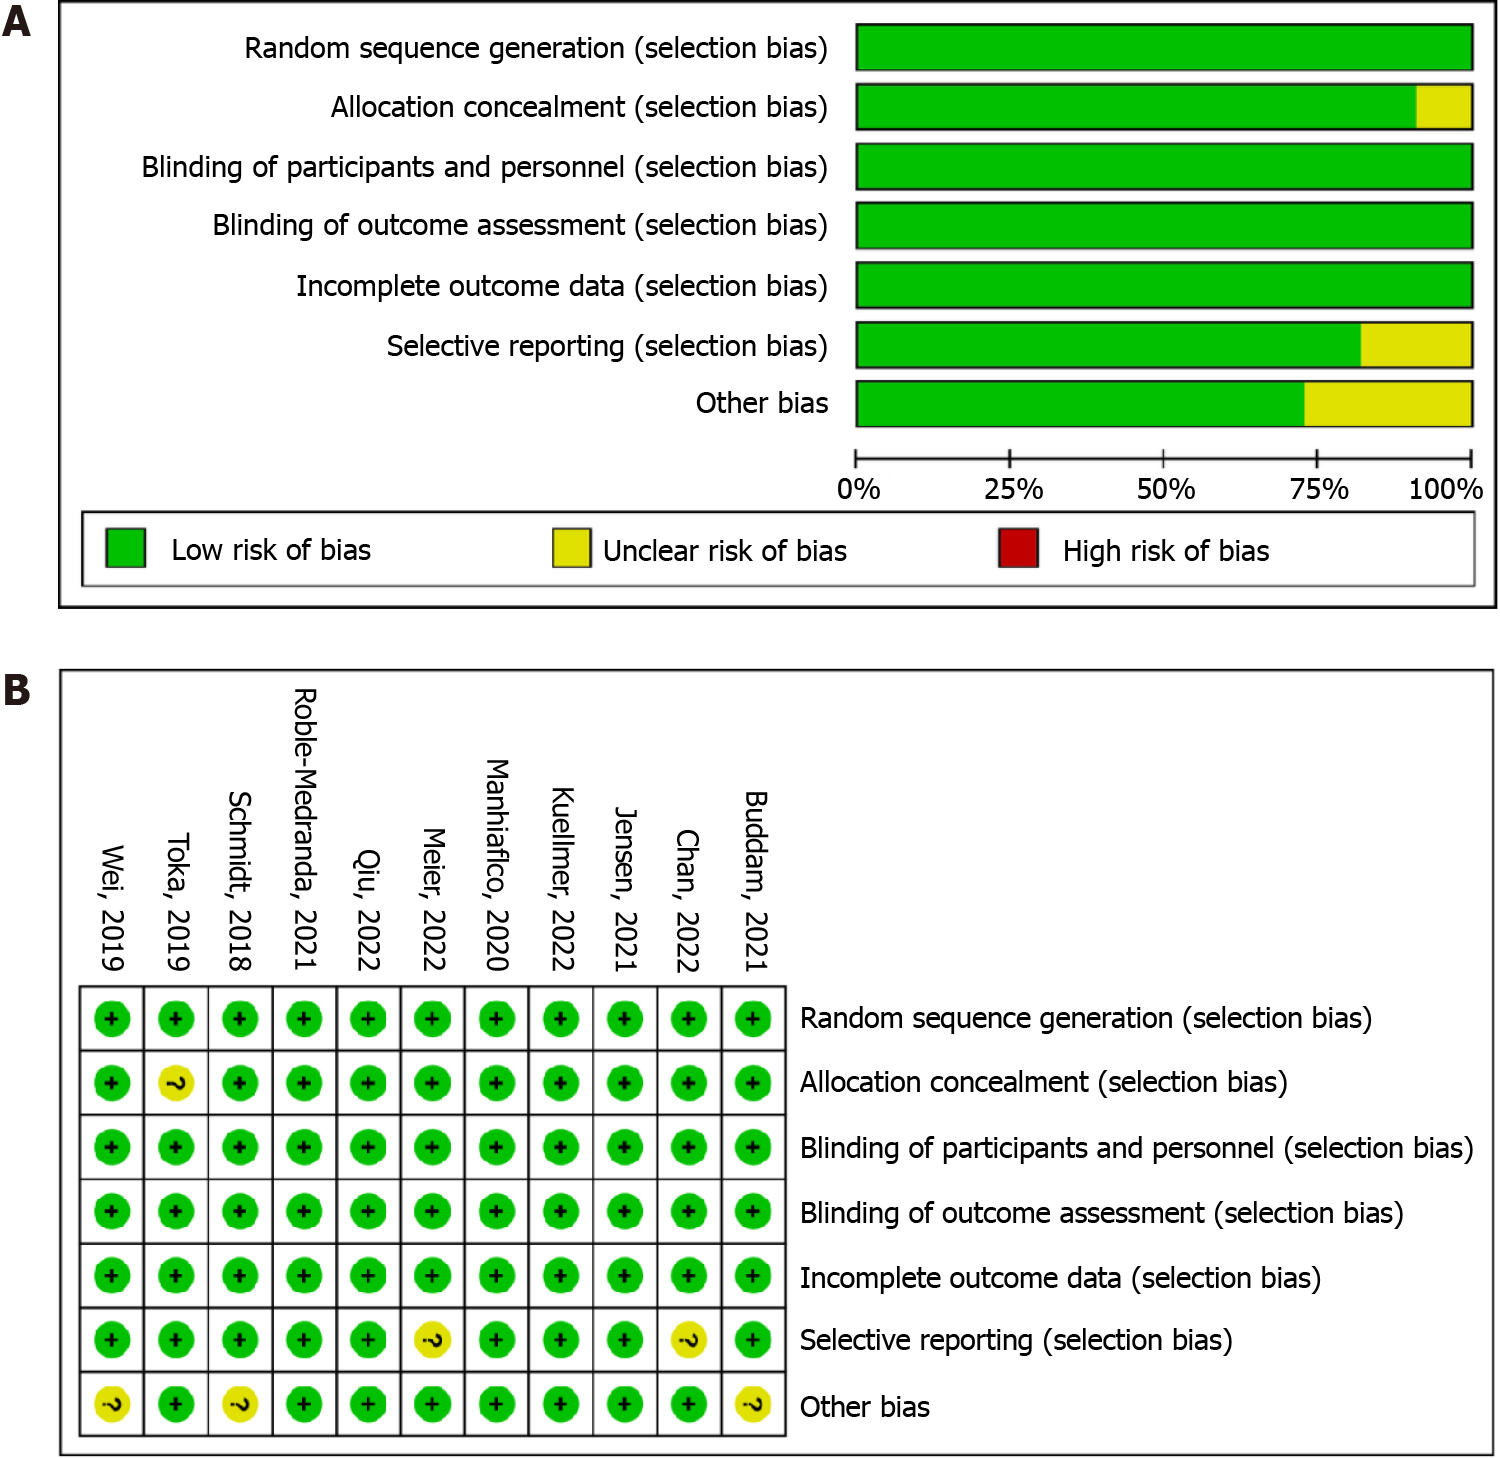
Figure 2 Risk of bias graph and bias summary of included studies.
A: Bias graph; B: Bias summary.
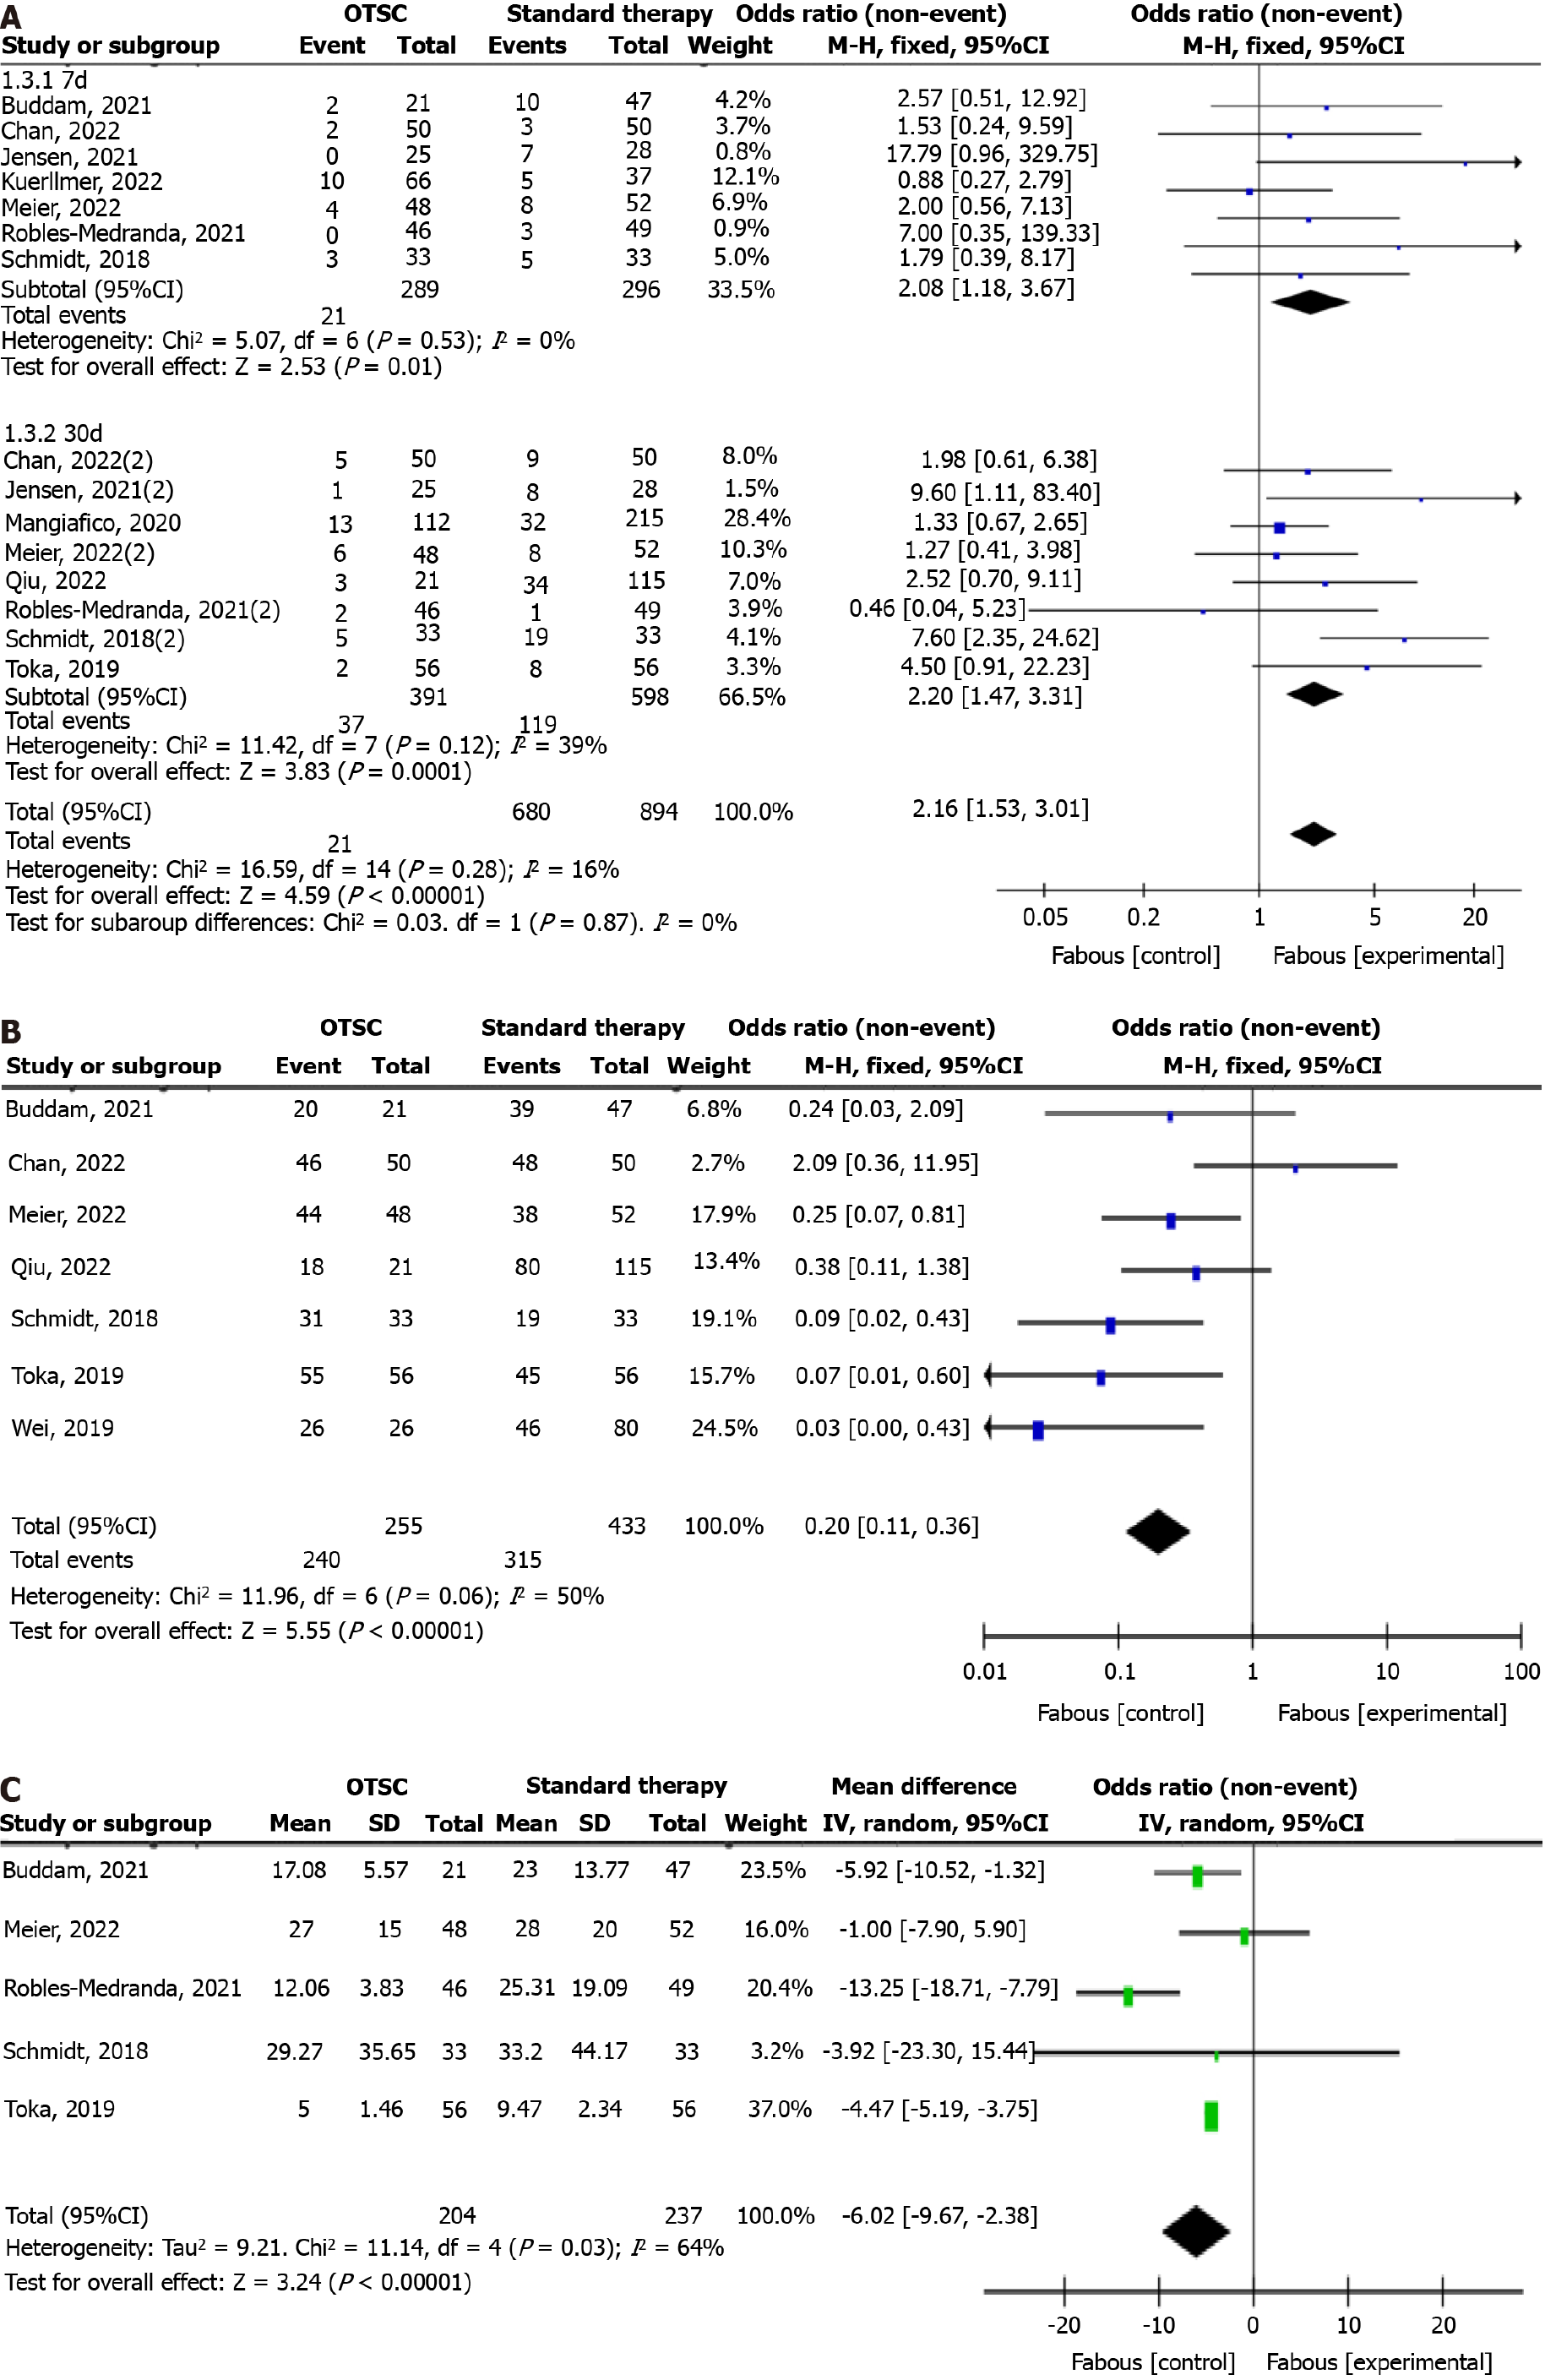
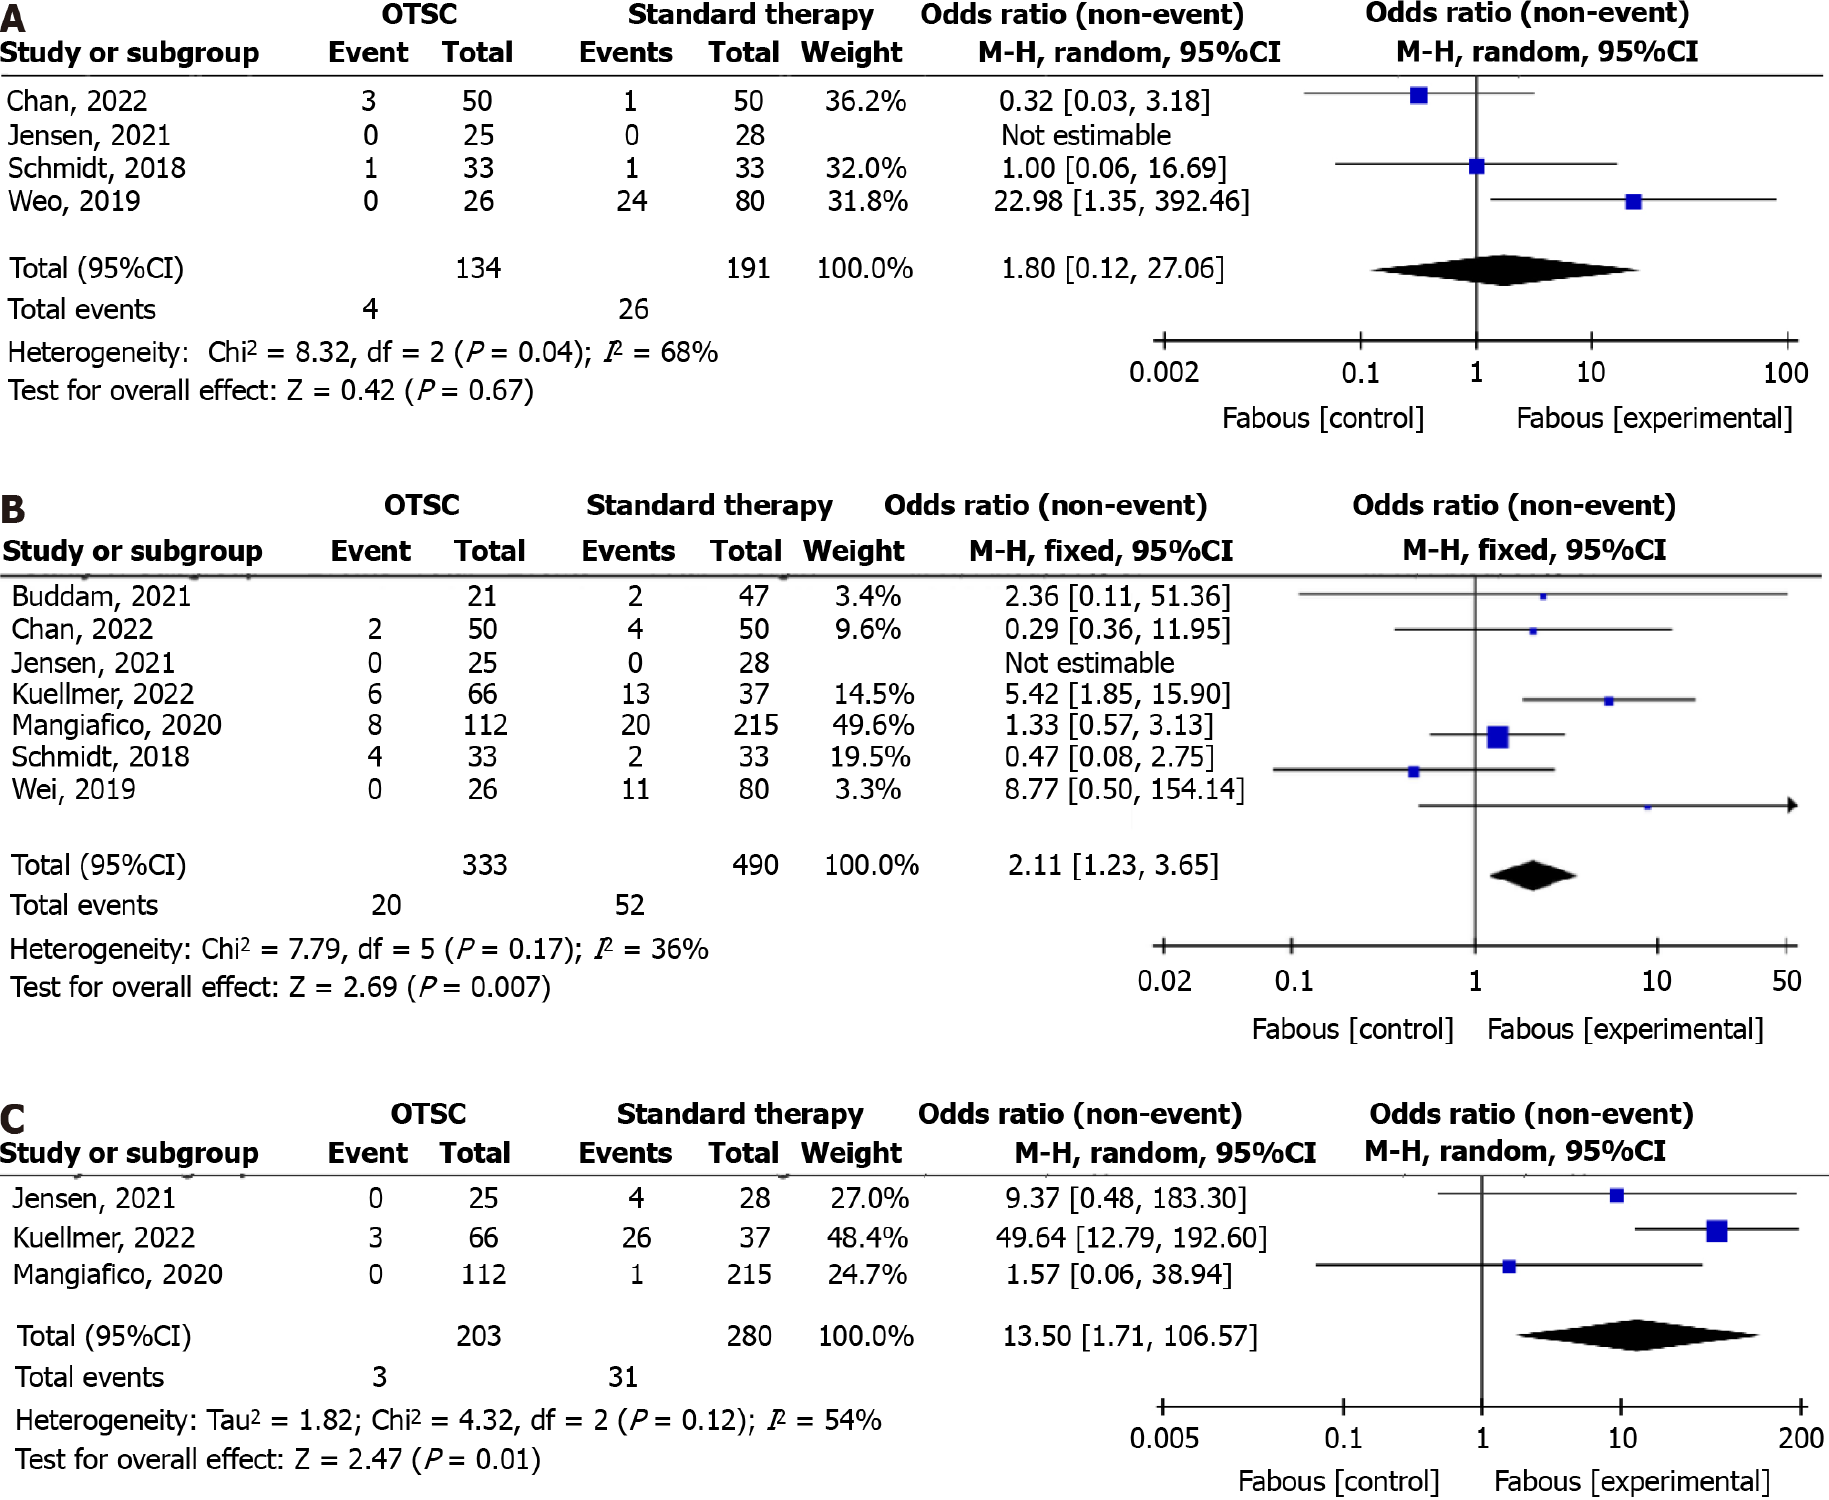
Figure 3 Meta-analysis results.
A: Recurrent bleeding; B: Success rate of hemostasis; C: Hemostasis time. OTSC: Over-the-scope-clip.
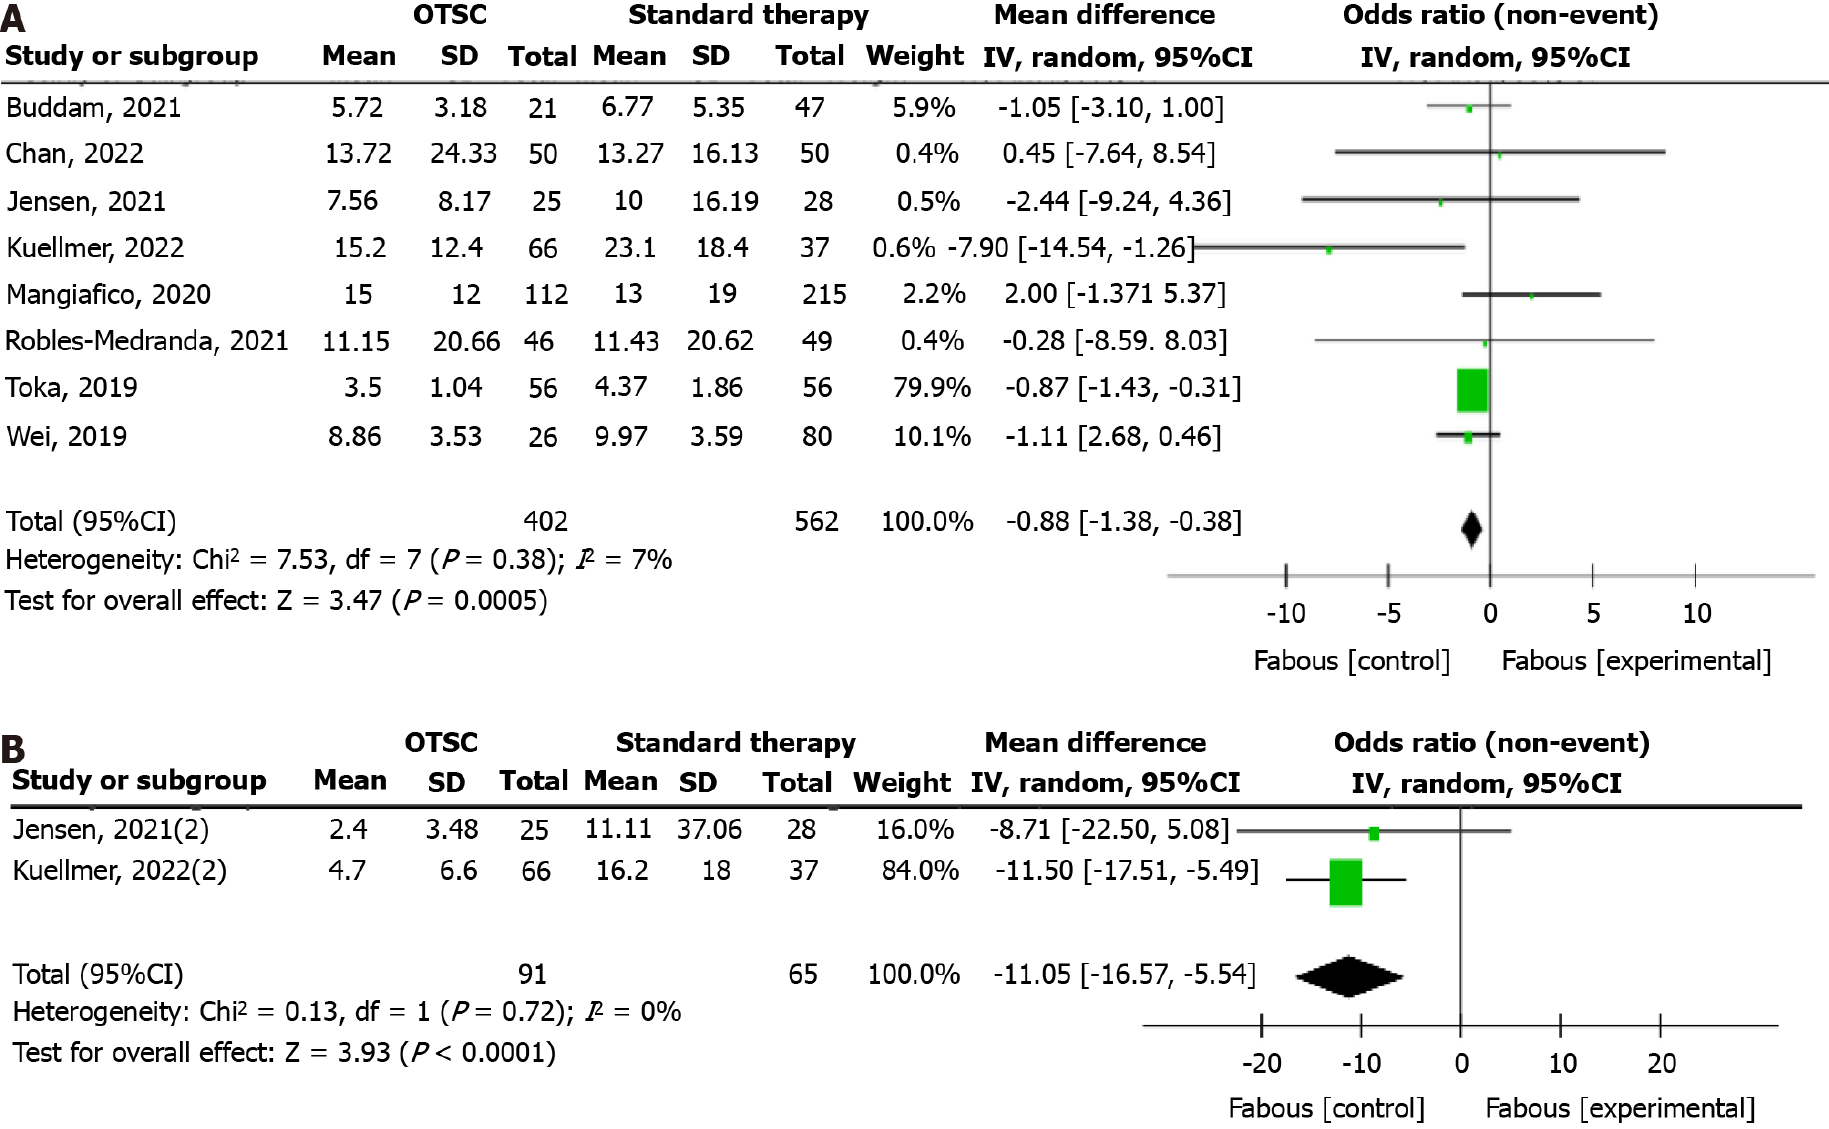
Figure 4 Meta-analysis of hospital stay and intensive care unit stay.
A: Hospital stay; B: Intensive care unit stay. OTSC: Over-the-scope-clip.
Figure 5 Meta-analysis of safety after over-the-scope-clip therapy.
A: Conversion rate to surgery; B: In-hospital mortality; C: Adverse events. OTSC: Over-the-scope-clip.
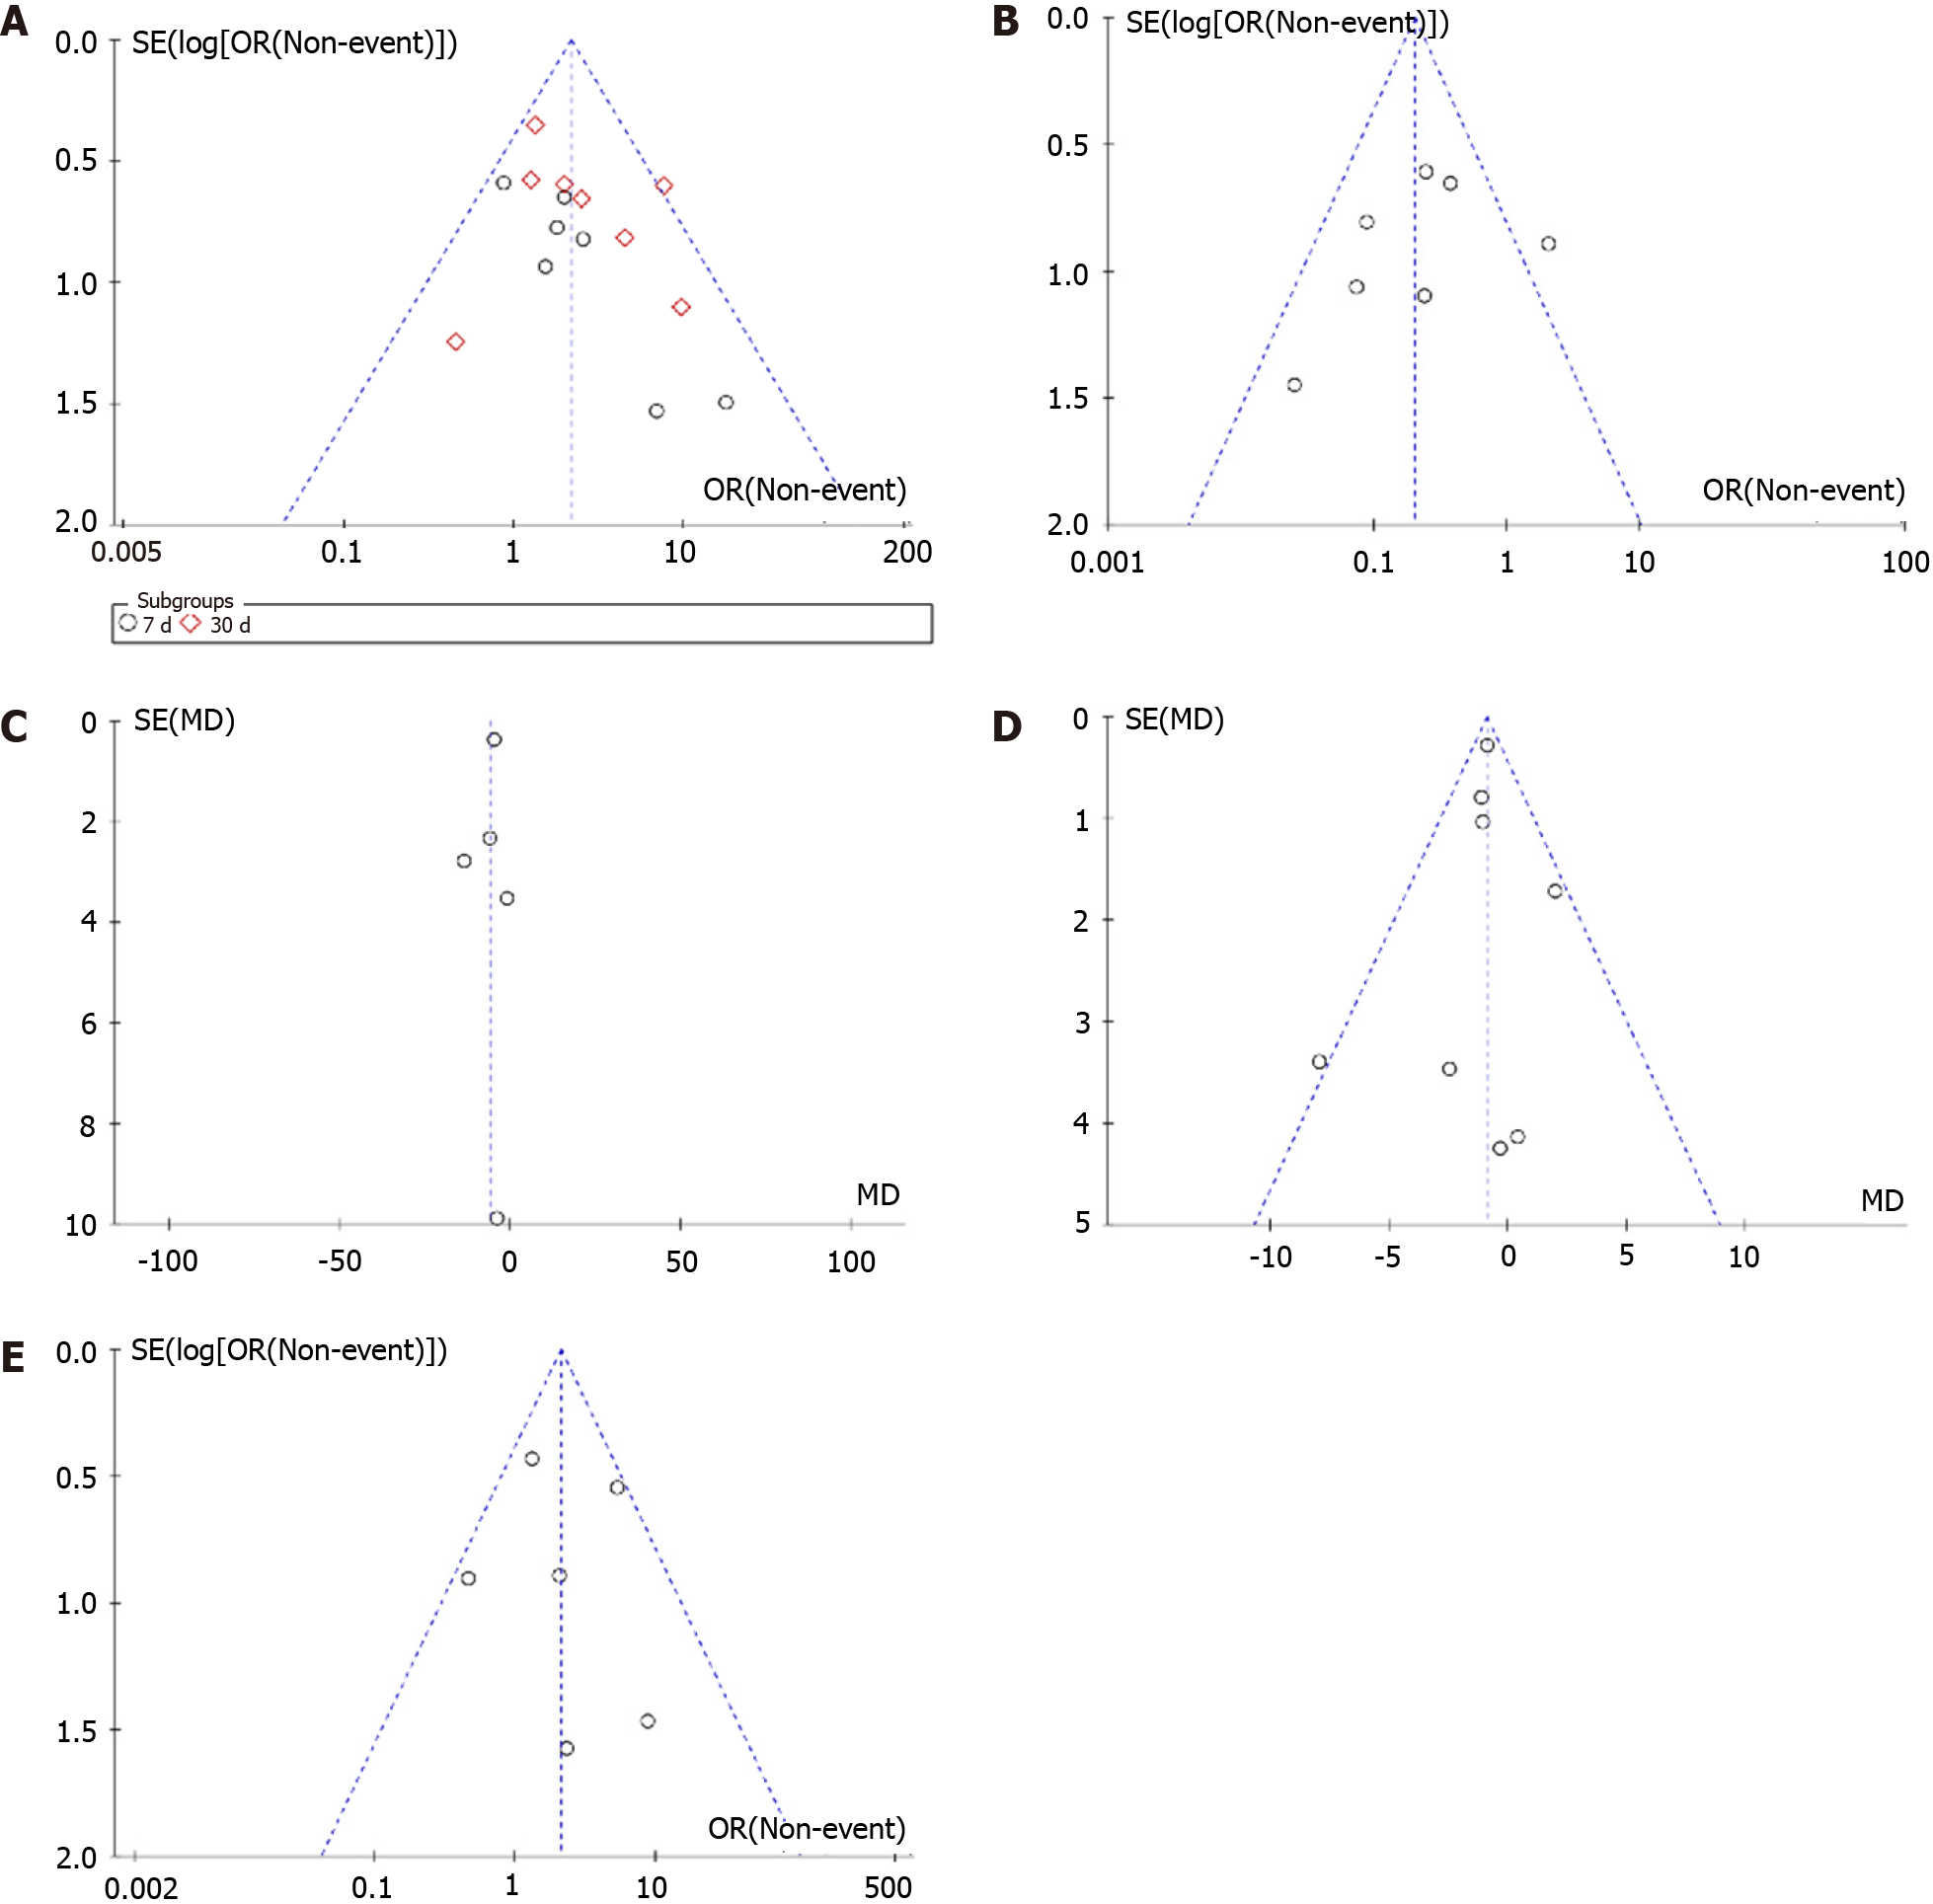
Figure 6 Funnel diagram of recurrent bleeding, hemostatic success rate, procedure time, hospital stay, and mortality.
A: Recurrent bleeding; B: Hemostatic success rate; C: Procedure time; D: Hospital stay; E: Mortality.
- Citation: Yang XZ, Yu DL, Wang Z, Gao ZL. Efficacy and safety of over-the-scope-clips in the therapy of acute nonvariceal upper gastrointestinal bleeding: Meta-analysis. World J Clin Cases 2024; 12(21): 4680-4690
- URL: https://www.wjgnet.com/2307-8960/full/v12/i21/4680.htm
- DOI: https://dx.doi.org/10.12998/wjcc.v12.i21.4680


