Copyright
©The Author(s) 2024.
World J Clin Cases. Jul 26, 2024; 12(21): 4574-4581
Published online Jul 26, 2024. doi: 10.12998/wjcc.v12.i21.4574
Published online Jul 26, 2024. doi: 10.12998/wjcc.v12.i21.4574
Figure 1 Comparison of time to symptom improvement.
A: The experimental group showed a significantly shorter time of burning sensation improvement than the control group; B: The experimental group showed a significantly shorter time of acid reflux improvement than the control group; C: The experimental group showed a significantly shorter time of celialgia improvement than the control group. aP < 0.01.
Figure 2 Comparison of gastric function.
A: After the intervention, the experimental group had a significantly lower pepsinogen I level than the control group; B: After the intervention, the experimental group had a significantly lower pepsinogen II level than the control group; C: After the intervention, the experimental group had a significantly lower gastrin-17 level than the control group. aP < 0.05; bP < 0.01; cP < 0.001. PG: Pepsinogen; G-17: Gastrin-17.
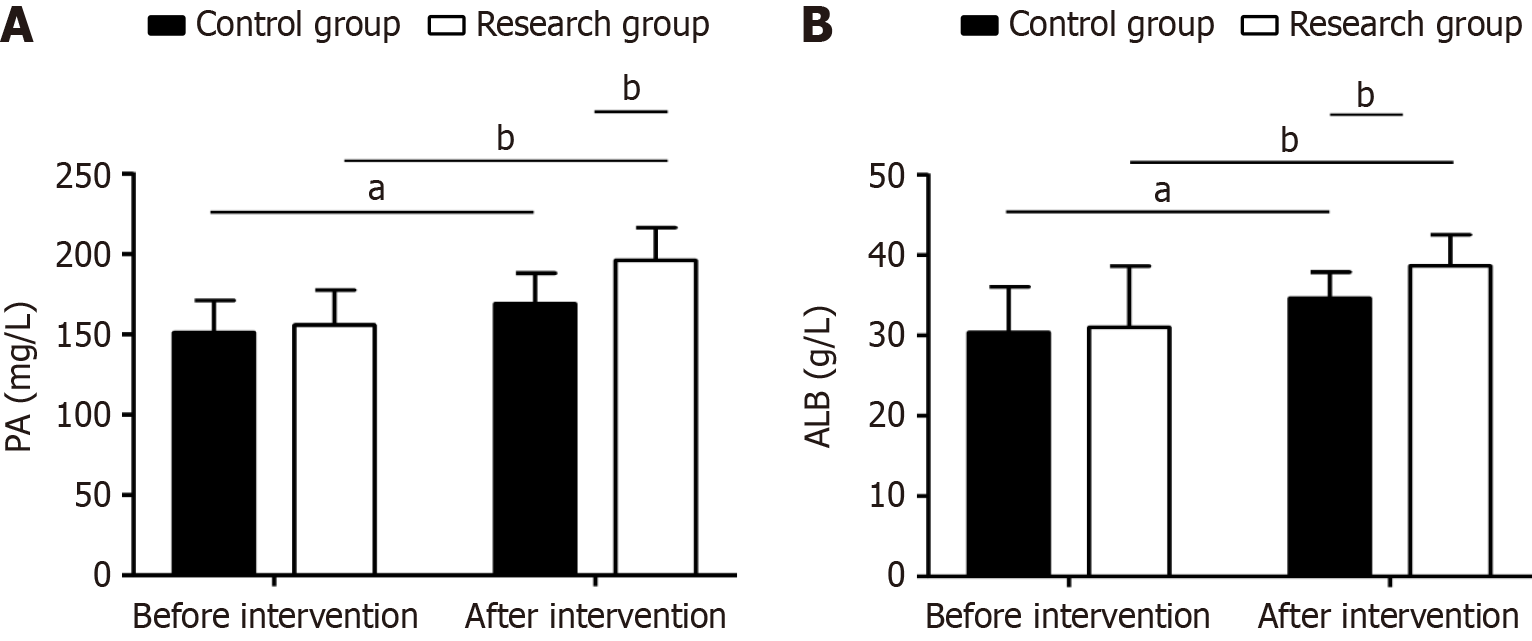
Figure 3 Comparison of nutritional status.
A: After the intervention, the experimental group had a significantly higher prealbumin level than the control group; B: After the intervention, the experimental group had a significantly higher albumin level than the control group. aP < 0.05; bP < 0.01. PA: Prealbumin; ALB: Albumin.
- Citation: Zhang WW, Wang XF, Yu HY, Wang LF. Influence of a diet meal plan on pepsinogen I and II, gastrin-17, and nutritional status in gastric ulcer patients. World J Clin Cases 2024; 12(21): 4574-4581
- URL: https://www.wjgnet.com/2307-8960/full/v12/i21/4574.htm
- DOI: https://dx.doi.org/10.12998/wjcc.v12.i21.4574


