Copyright
©The Author(s) 2024.
World J Clin Cases. Jul 16, 2024; 12(20): 4121-4129
Published online Jul 16, 2024. doi: 10.12998/wjcc.v12.i20.4121
Published online Jul 16, 2024. doi: 10.12998/wjcc.v12.i20.4121
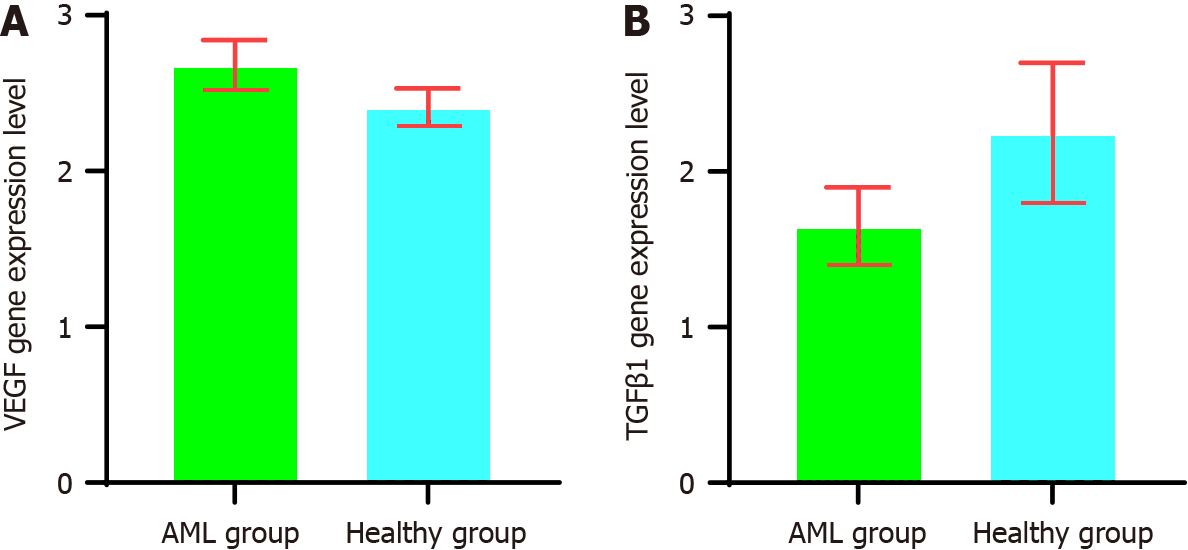
Figure 1 Expression levels of vascular endothelial growth factor and transforming growth factor-β1.
A: Expression levels of vascular endothelial growth factor; B: Expression levels of transforming growth factor-β1. AML: Acute myeloid leukemia; VEGF: Vascular endothelial growth factor; TGF-β1: Transforming growth factor-β1.
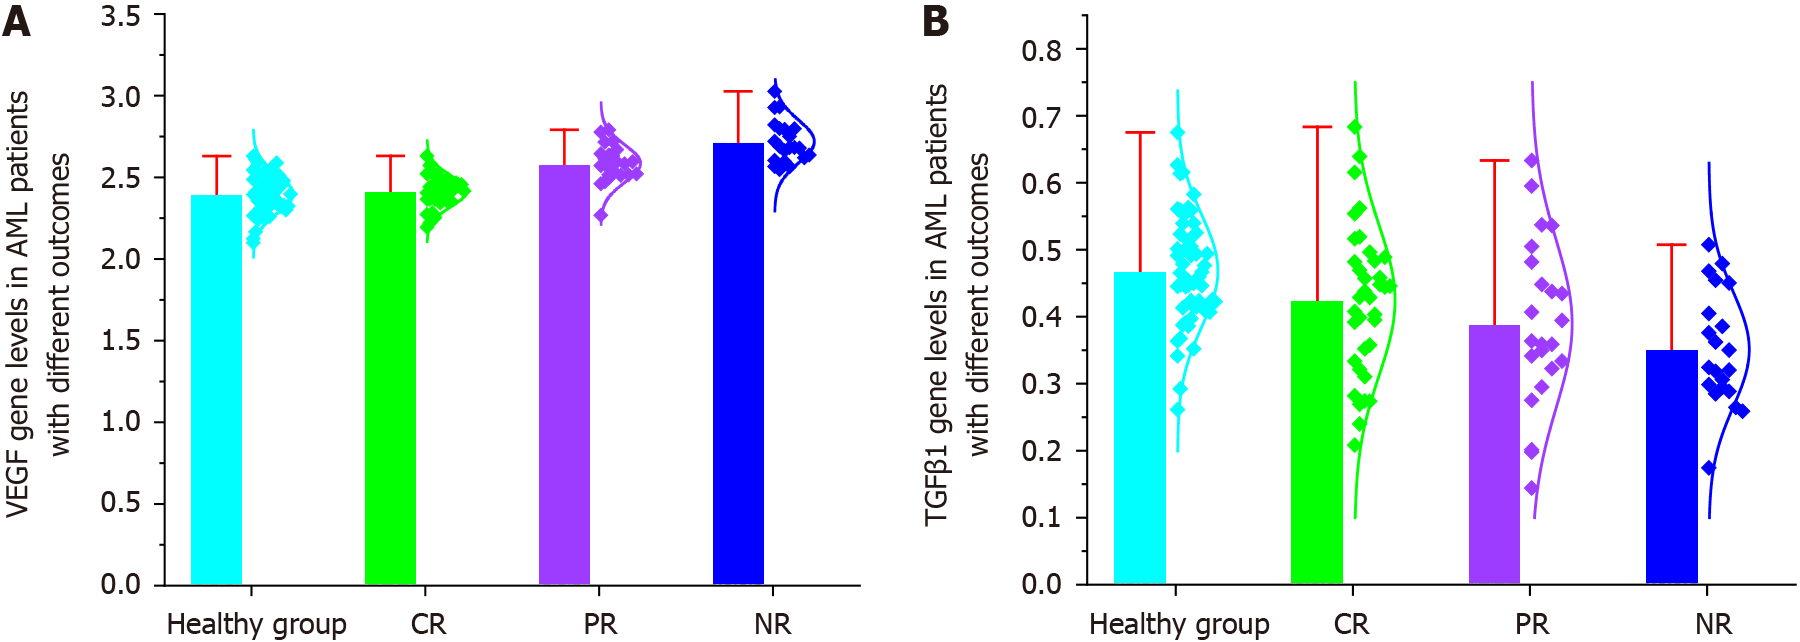
Figure 2 Expression levels of vascular endothelial growth factor and transforming growth factor-β1 in patients with acute myeloid leukemia with different treatment responses and healthy controls.
A: Expression levels of vascular endothelial growth factor; B: Expression levels of transforming growth factor-β1. AML: Acute myeloid leukemia; VEGF: Vascular endothelial growth factor; TGF-β1: Transforming growth factor-β1; CR: Complete response; PR: Partial response; NR: No response.
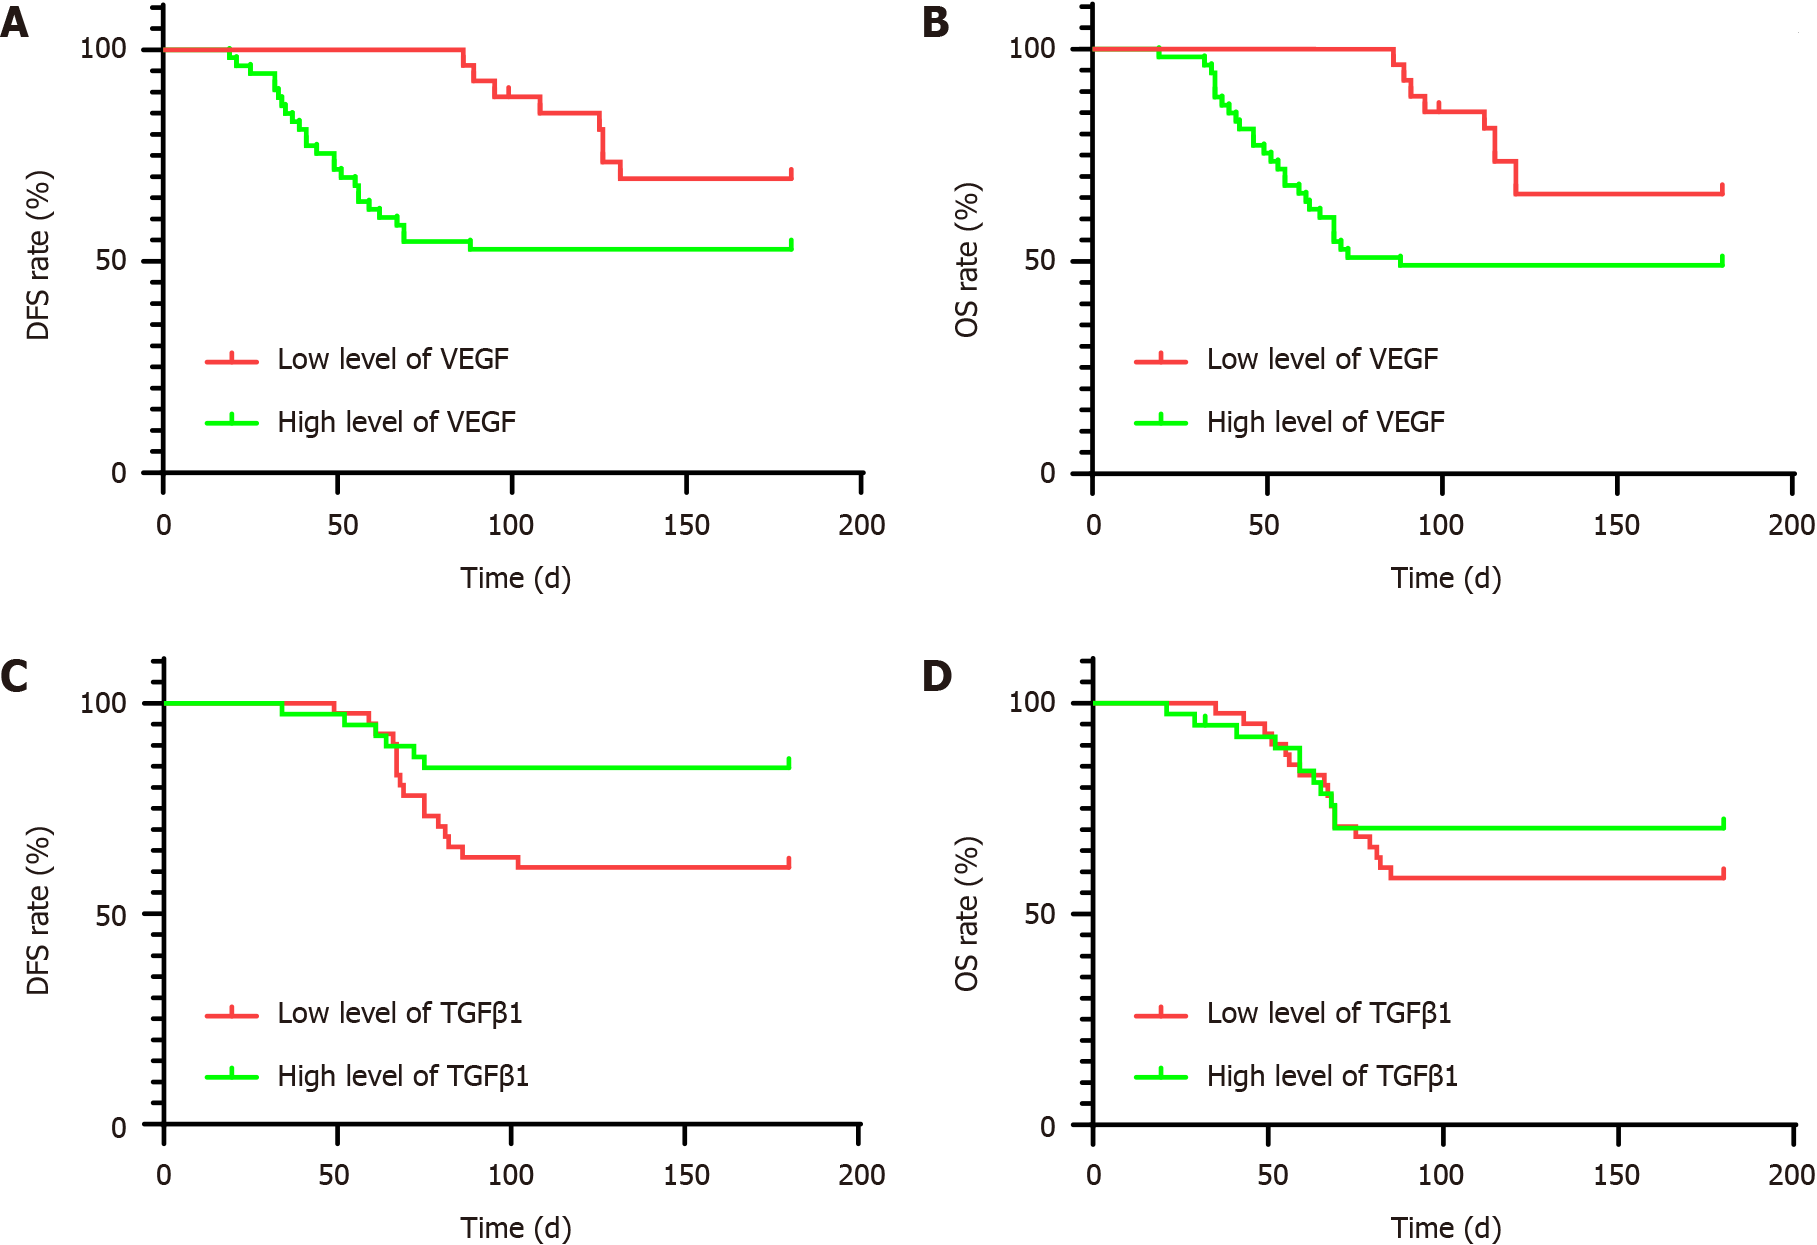
Figure 3 Correlation between disease-free or overall survival rate and transforming growth factor-β1 or vascular endothelial growth factor expression analyzed using the Kaplan-Meier survival curve.
A: Correlation between disease-free survival (DFS) rate and vascular endothelial growth factor (VEGF) expression analyzed using the Kaplan-Meier survival curve; B: Correlation between overall survival (OS) rate and VEGF expression analyzed using the Kaplan-Meier survival curve; C: Correlation between disease-free survival rate and transforming growth factor-β1 (TGF-β1) expression analyzed using the Kaplan-Meier survival curve; D: Correlation between OS rate and TGF-β1 expression analyzed using the Kaplan-Meier survival curve. AML: Acute myeloid leukemia; VEGF: Vascular endothelial growth factor; TGF-β1: Transforming growth factor-β1; DFS: Disease-free survival; OS: Overall survival.
- Citation: Li W, Ma SY, Zhao HY. Transforming growth factor-β1 and vascular endothelial growth factor levels in senile acute myeloid leukemia and correlation with prognosis. World J Clin Cases 2024; 12(20): 4121-4129
- URL: https://www.wjgnet.com/2307-8960/full/v12/i20/4121.htm
- DOI: https://dx.doi.org/10.12998/wjcc.v12.i20.4121


