Copyright
©The Author(s) 2024.
World J Clin Cases. Jan 16, 2024; 12(2): 374-382
Published online Jan 16, 2024. doi: 10.12998/wjcc.v12.i2.374
Published online Jan 16, 2024. doi: 10.12998/wjcc.v12.i2.374
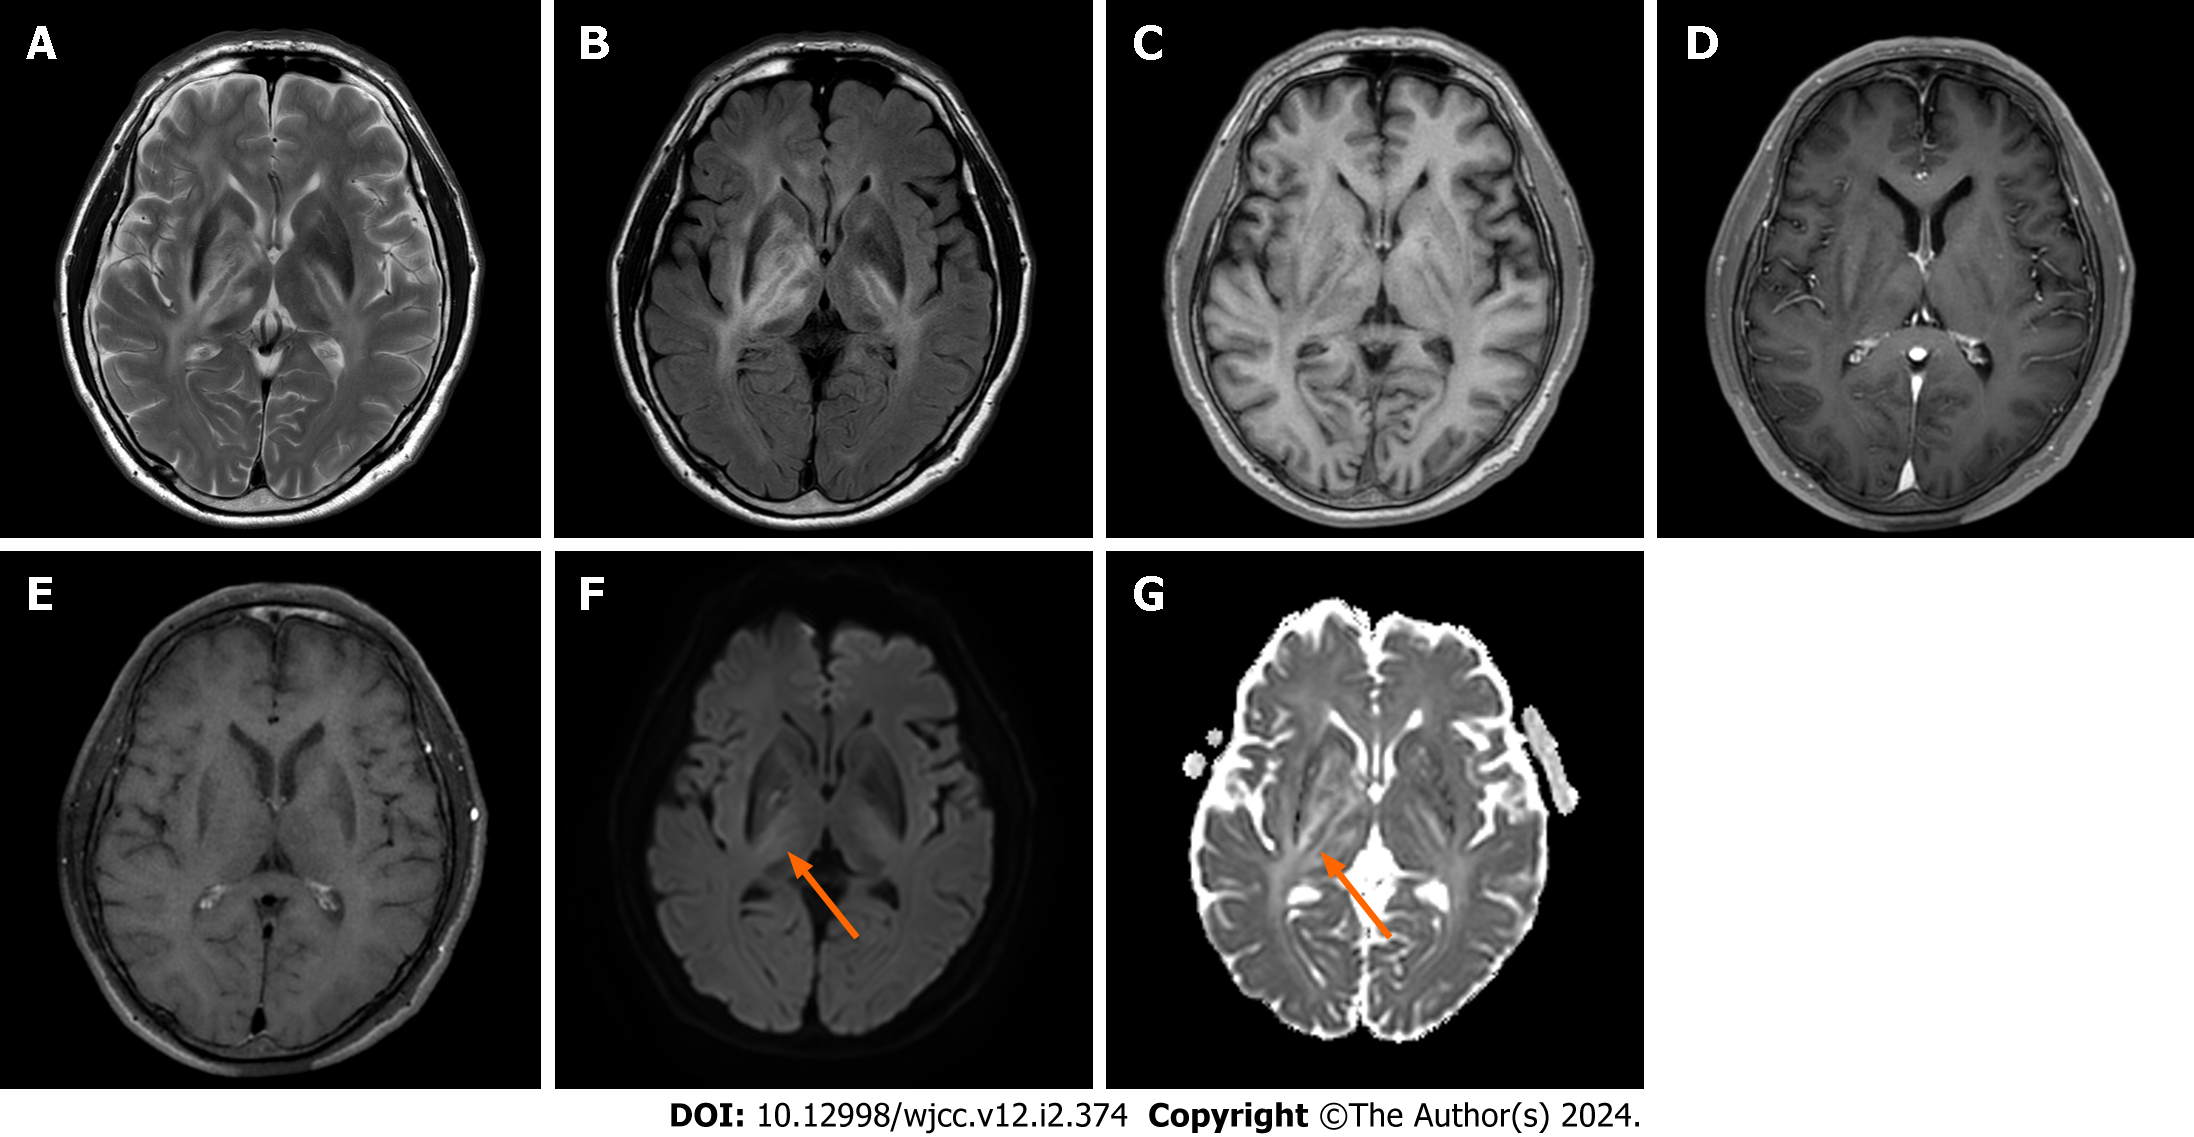
Figure 1 Initial magnetic resonance imaging.
A: T2 weighted image; B: T2 fluid attenuated inversion recovery image shows asymmetric T2 hyperintensity at bilateral basal ganglia and thalamus; C: T1 weighted image; D: Post-contrast T1 weighted image; E: Post-contrast T1 black blood image shows no enhancement at T2 hyperintensity lesions; F: B1000 diffusion weighted image; G: Apparent diffusion coefficient map showing mild diffusion restriction is noted at the right posterior limb of the internal capsule (arrows).
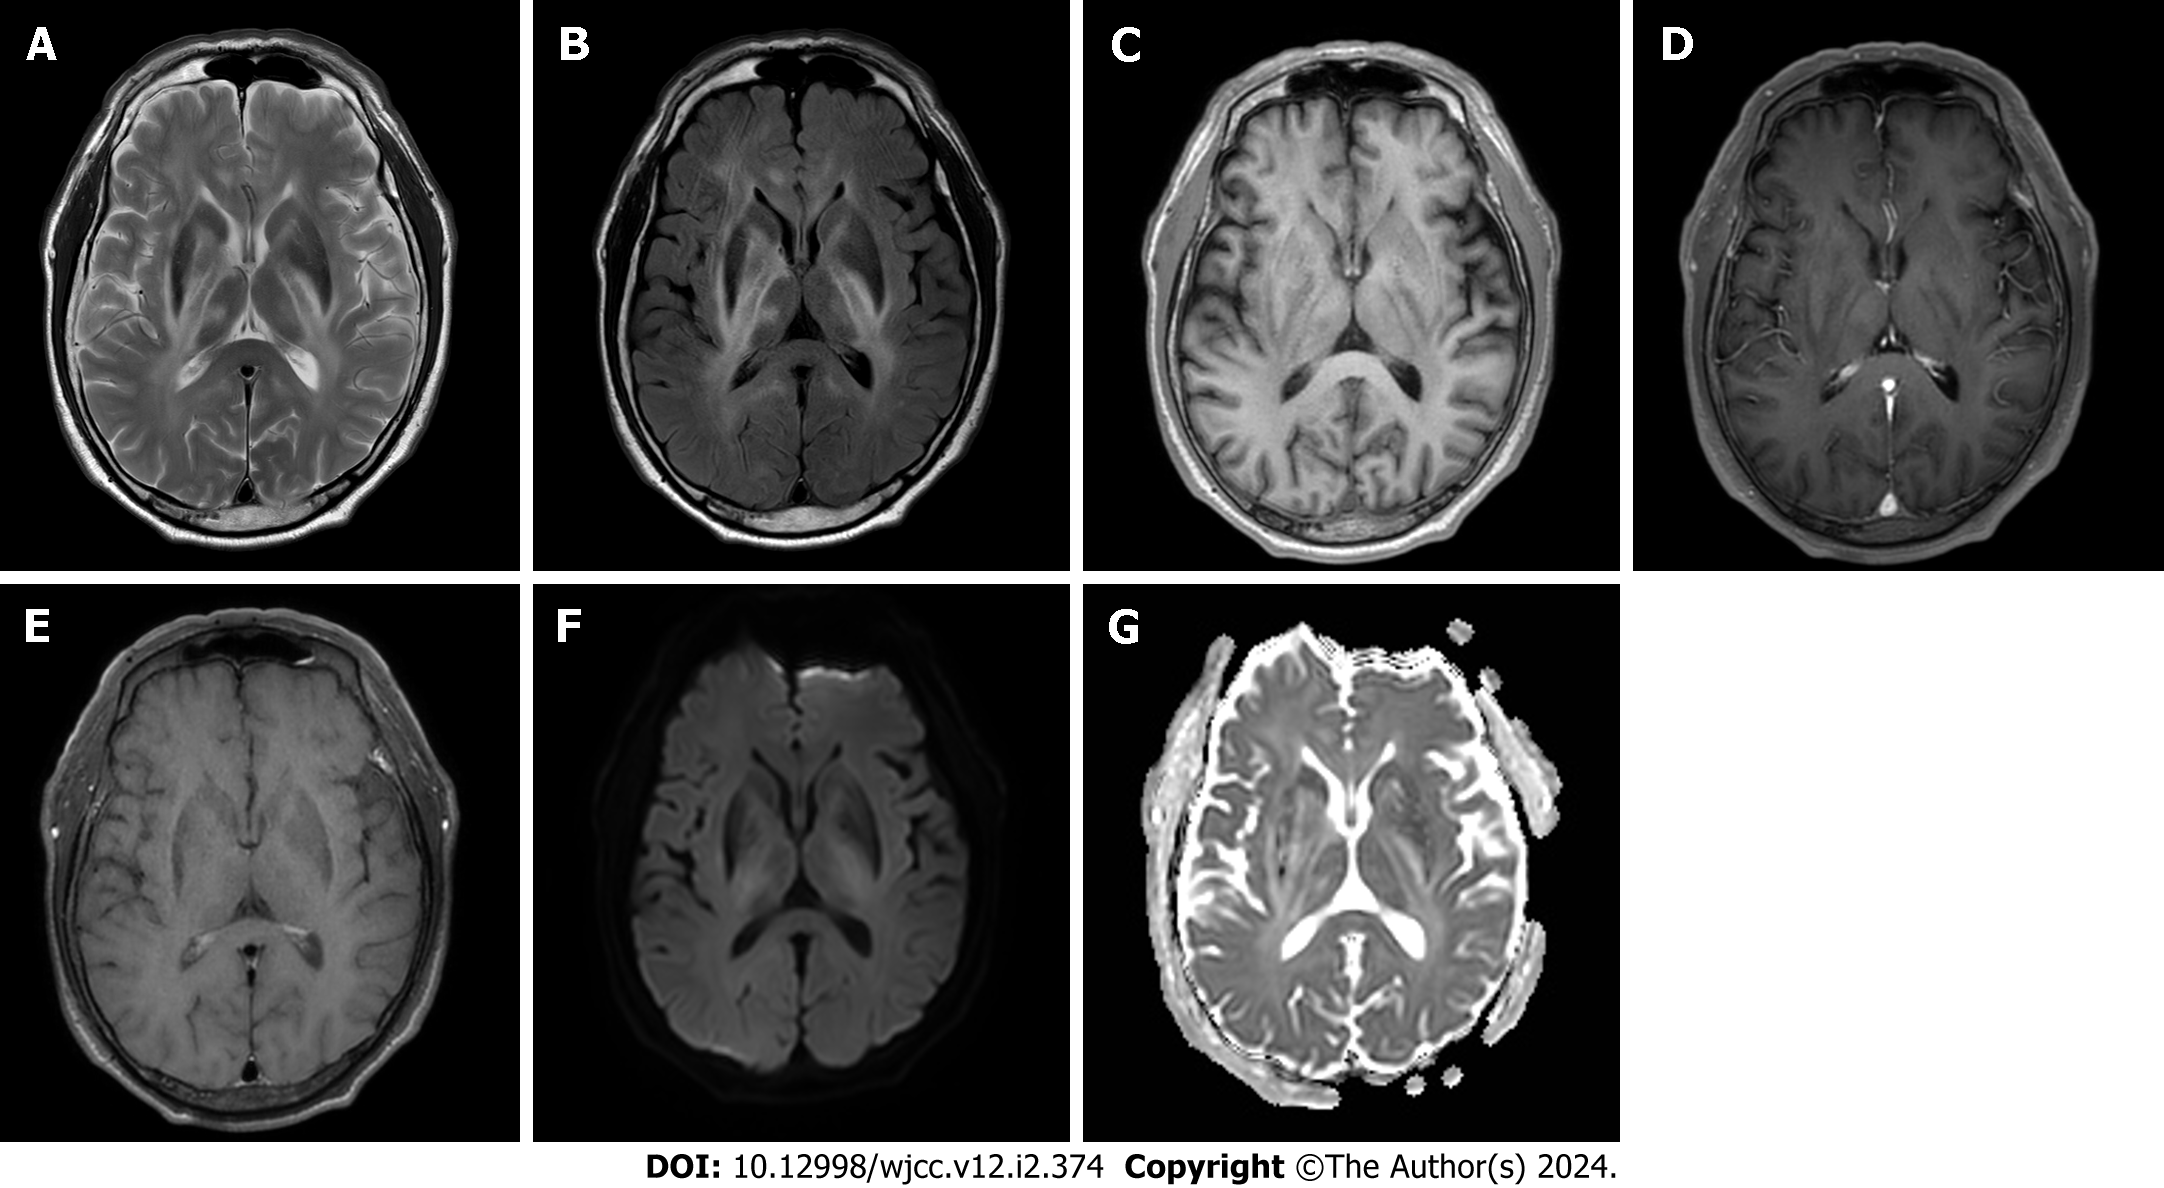
Figure 2 Magnetic resonance imaging scan five days after high-dose steroid therapy is initiated.
A: T2 weighted image; B: T2 fluid attenuated inversion recovery image; C: T1 weighted image, D: Post-contrast T1 weighted image; E: Post-contrast T1 weighted black blood image; F: B1000 diffusion weighted image; G: Apparent diffusion coefficient map showing minimal change of previously noted T2 hyperintense lesions.
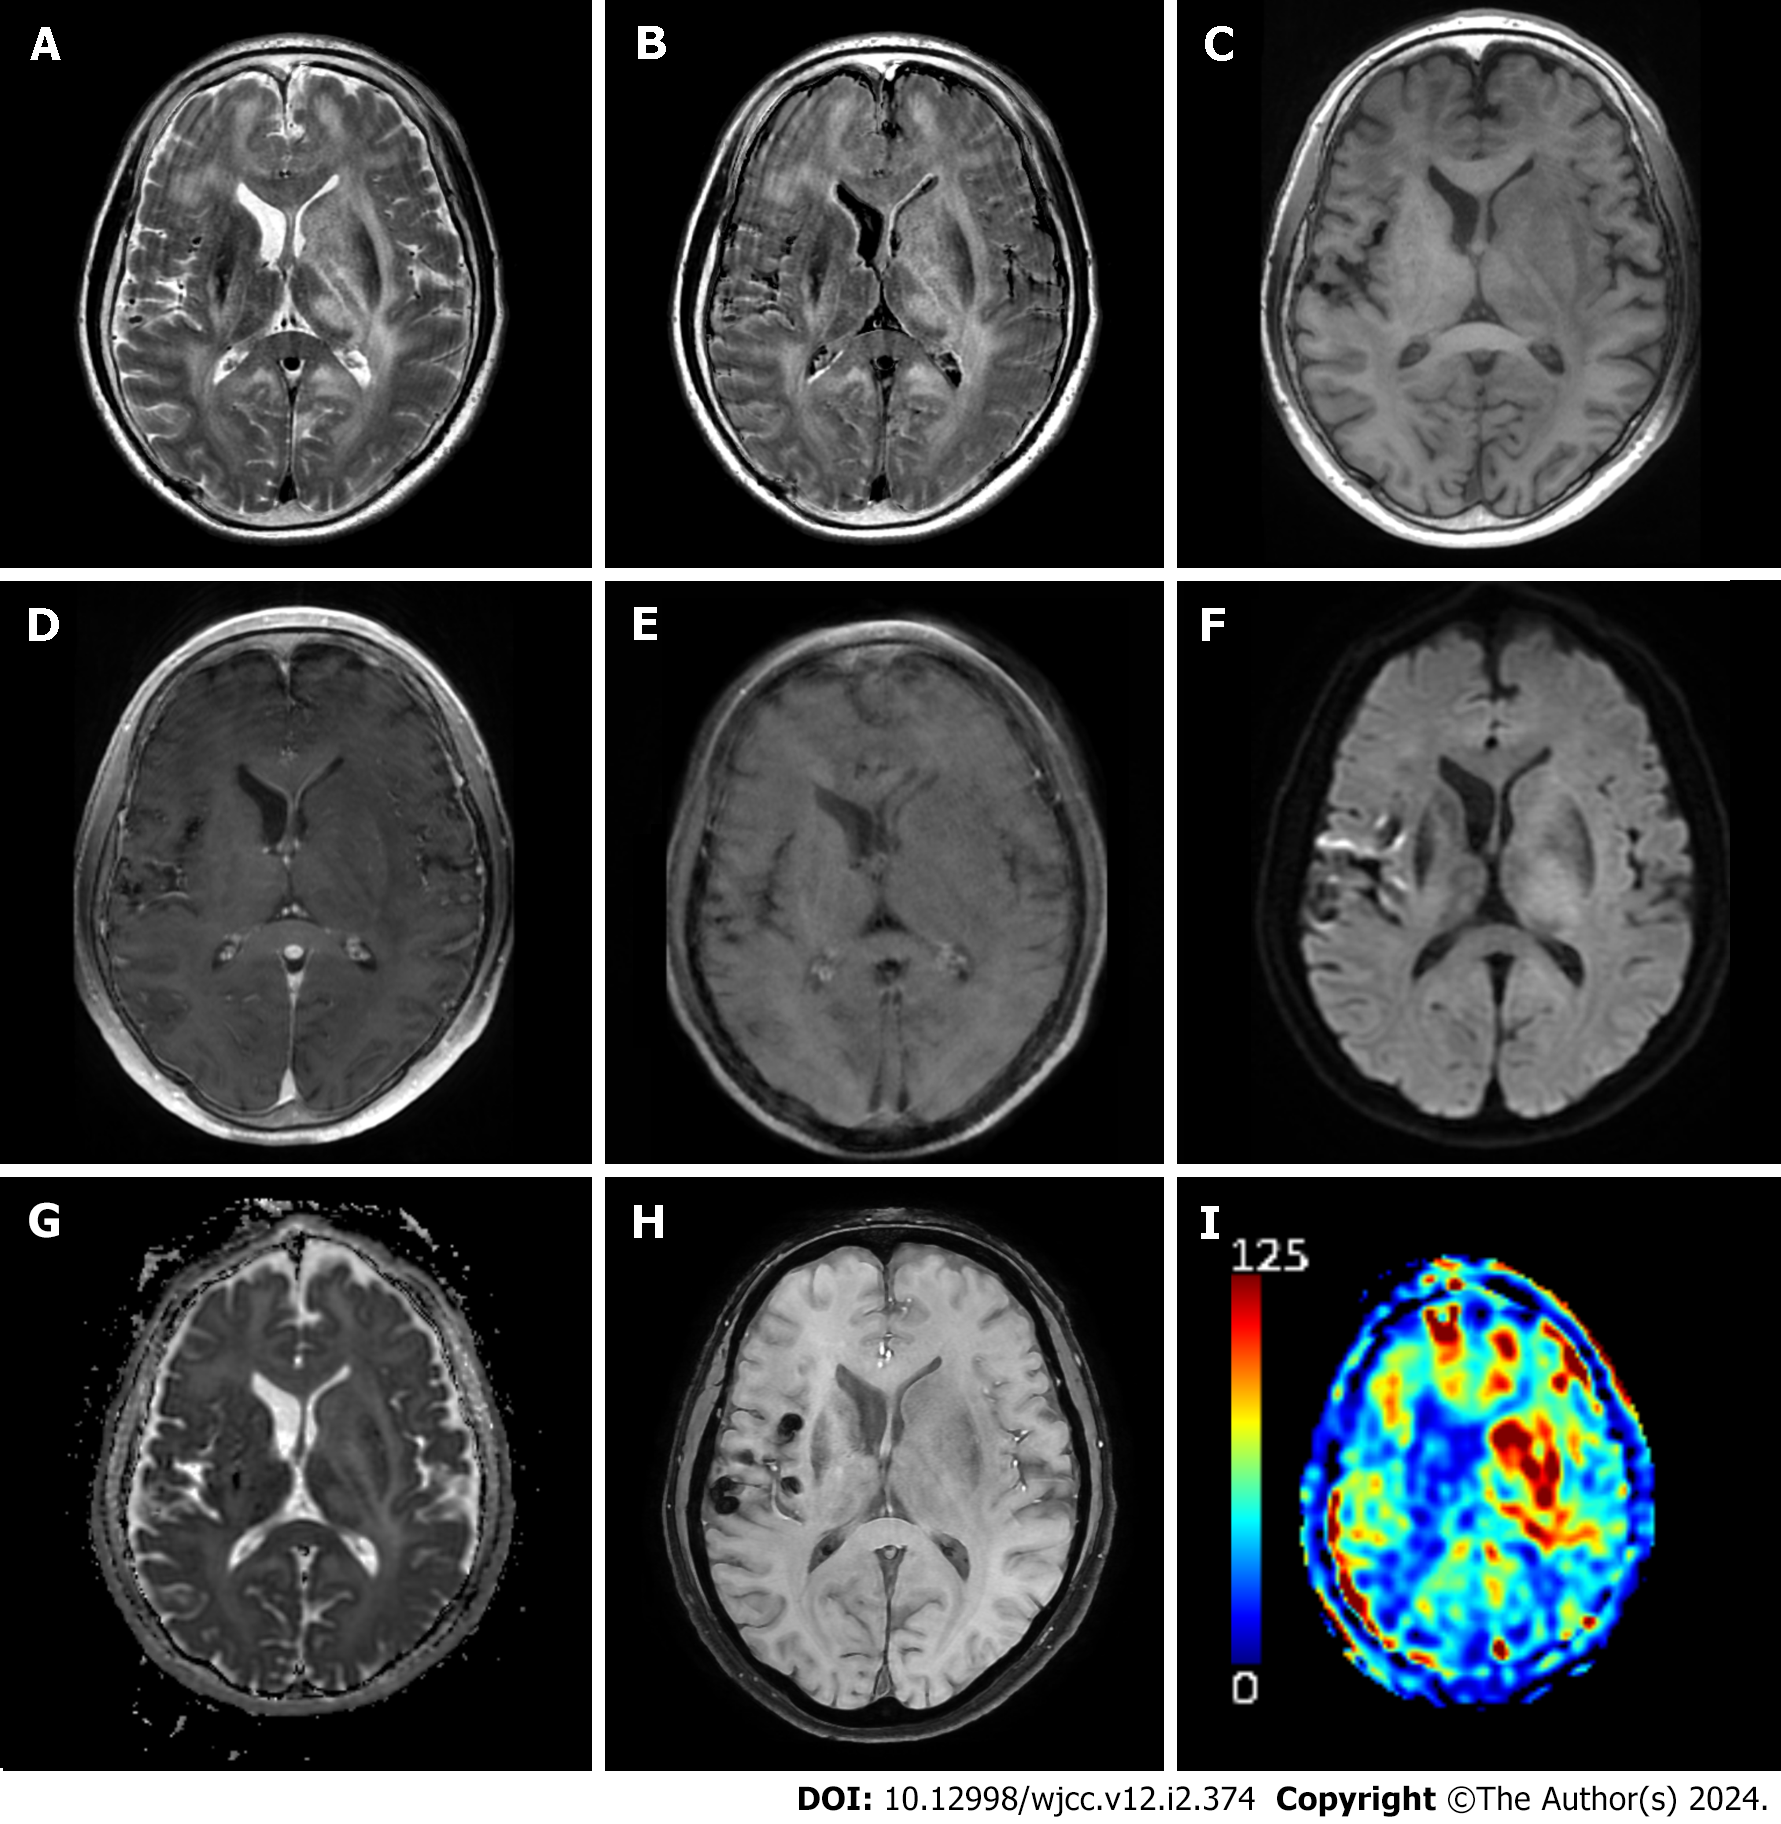
Figure 3 Follow up magnetic resonance imaging one month after initial scan.
A: T2 weighted image; B: T2 fluid attenuated inversion recovery image shows decreased extent of hyperintense lesion at right basal ganglia, but increased extents of remaining hyperintense lesions; C: T1 weighted image; D: Post-contrast T1 weighted image; E: Post-contrast T1 black blood image shows no enhancement at T2 hyperintense lesions; F: B1000 diffusion weighted image; G: Apparent diffusion coefficient map shows mild diffusion restriction at both basal ganglia; H: Susceptibility weighted image shows newly appeared multifocal hemorrhages at subarachnoid space; I: Arterial spin labeling perfusion magnetic resonance imaging shows increased cerebral blood flow of left basal ganglia lesion.
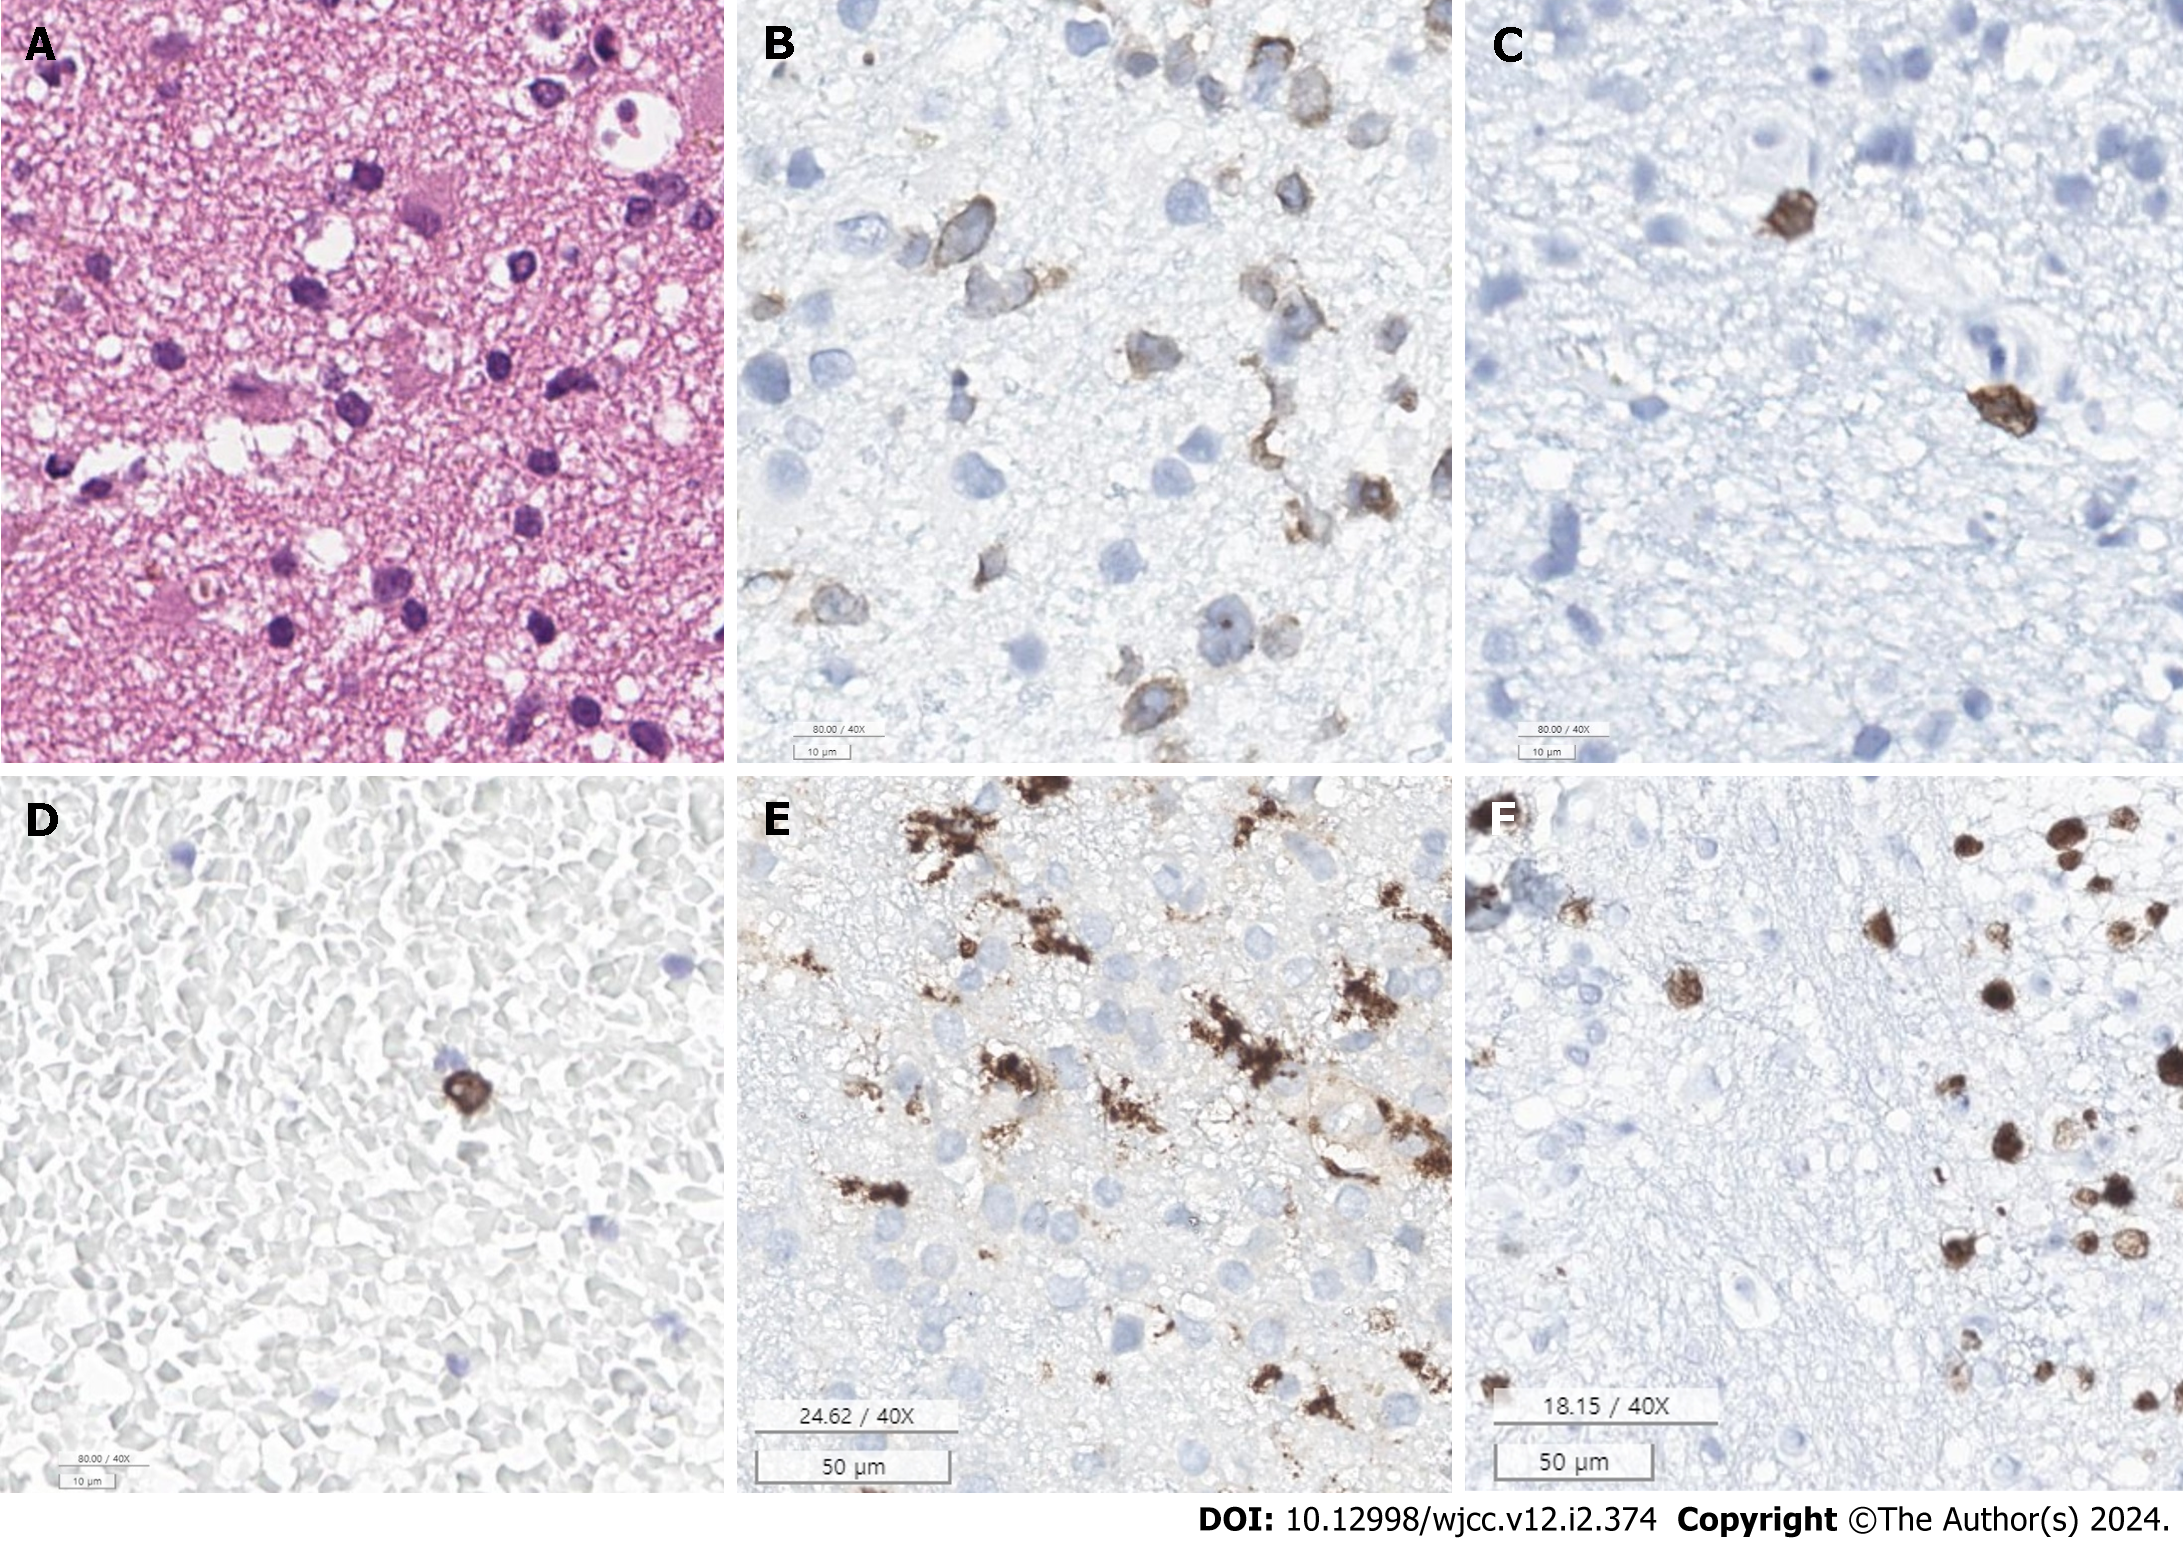
Figure 4 The immunohistochemical staining test results.
A: Hematoxylin & eosin stain (× 40) shows scattered lymphocyte infiltration in the specimen; B: Cluster of differentiation (CD)3 immunostain (× 40); C: CD8 immunostain (× 40), CD3 and CD8 positive lymphocytes suggests T-cell infiltration; D: CD20 immunostain (× 40), CD20 positive cells suggest presence of an immune response, likely towards the neoplastic cells; E: CD68 immunostain (× 40), CD68 positive microglia suggests an ongoing response to an injury or pathology in the brain; F: Antigen Kiel-67 (KI-67) immunostain (× 40), KI-67 index of 40% indicates the presence of high proliferation rate. Overall, these findings suggest a high proliferation neoplastic disorder involving lymphoid cells.
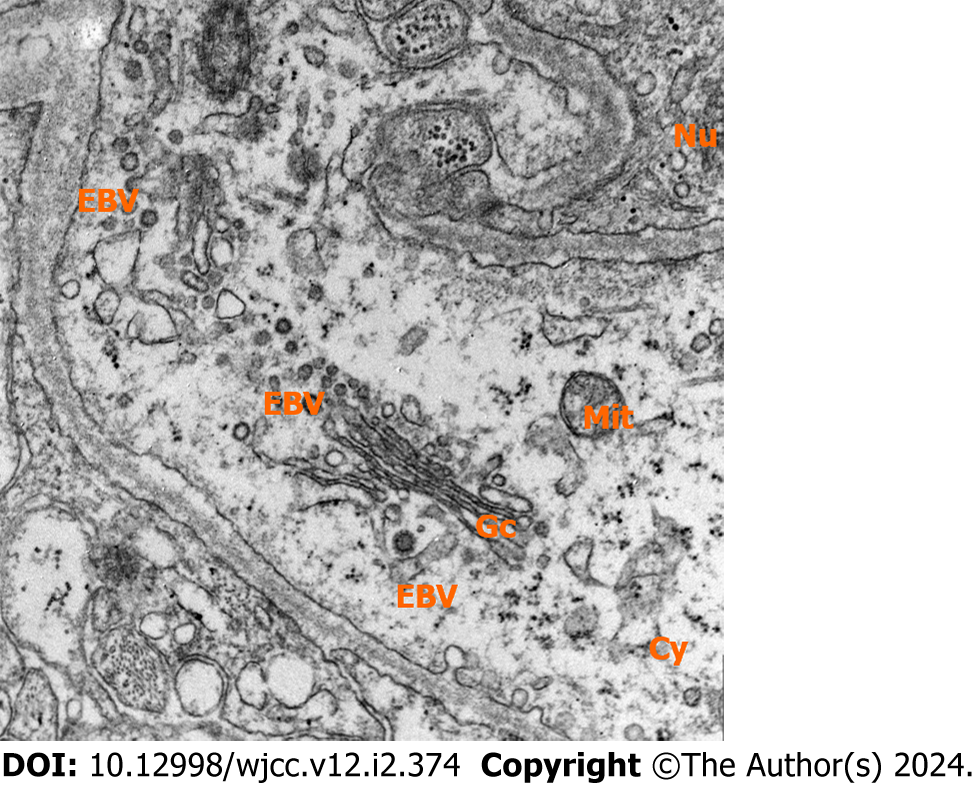
Figure 5 Transmission Electron Microscope revealing the presence of numerous infiltrations of Epstein-Bar virus (80 kV, 40000 ×) within tumor cells.
Nu: nucleus; Cy: Cytoplasm; Gc: Golgi-complex; Mit: Mitochondria; EBV: Epstein-Bar Virus.
- Citation: Kim CS, Choi CH, Yi KS, Kim Y, Lee J, Woo CG, Jeon YH. Absence of enhancement in a lesion does not preclude primary central nervous system T-cell lymphoma: A case report. World J Clin Cases 2024; 12(2): 374-382
- URL: https://www.wjgnet.com/2307-8960/full/v12/i2/374.htm
- DOI: https://dx.doi.org/10.12998/wjcc.v12.i2.374


