Copyright
©The Author(s) 2024.
World J Clin Cases. Jul 6, 2024; 12(19): 3854-3865
Published online Jul 6, 2024. doi: 10.12998/wjcc.v12.i19.3854
Published online Jul 6, 2024. doi: 10.12998/wjcc.v12.i19.3854
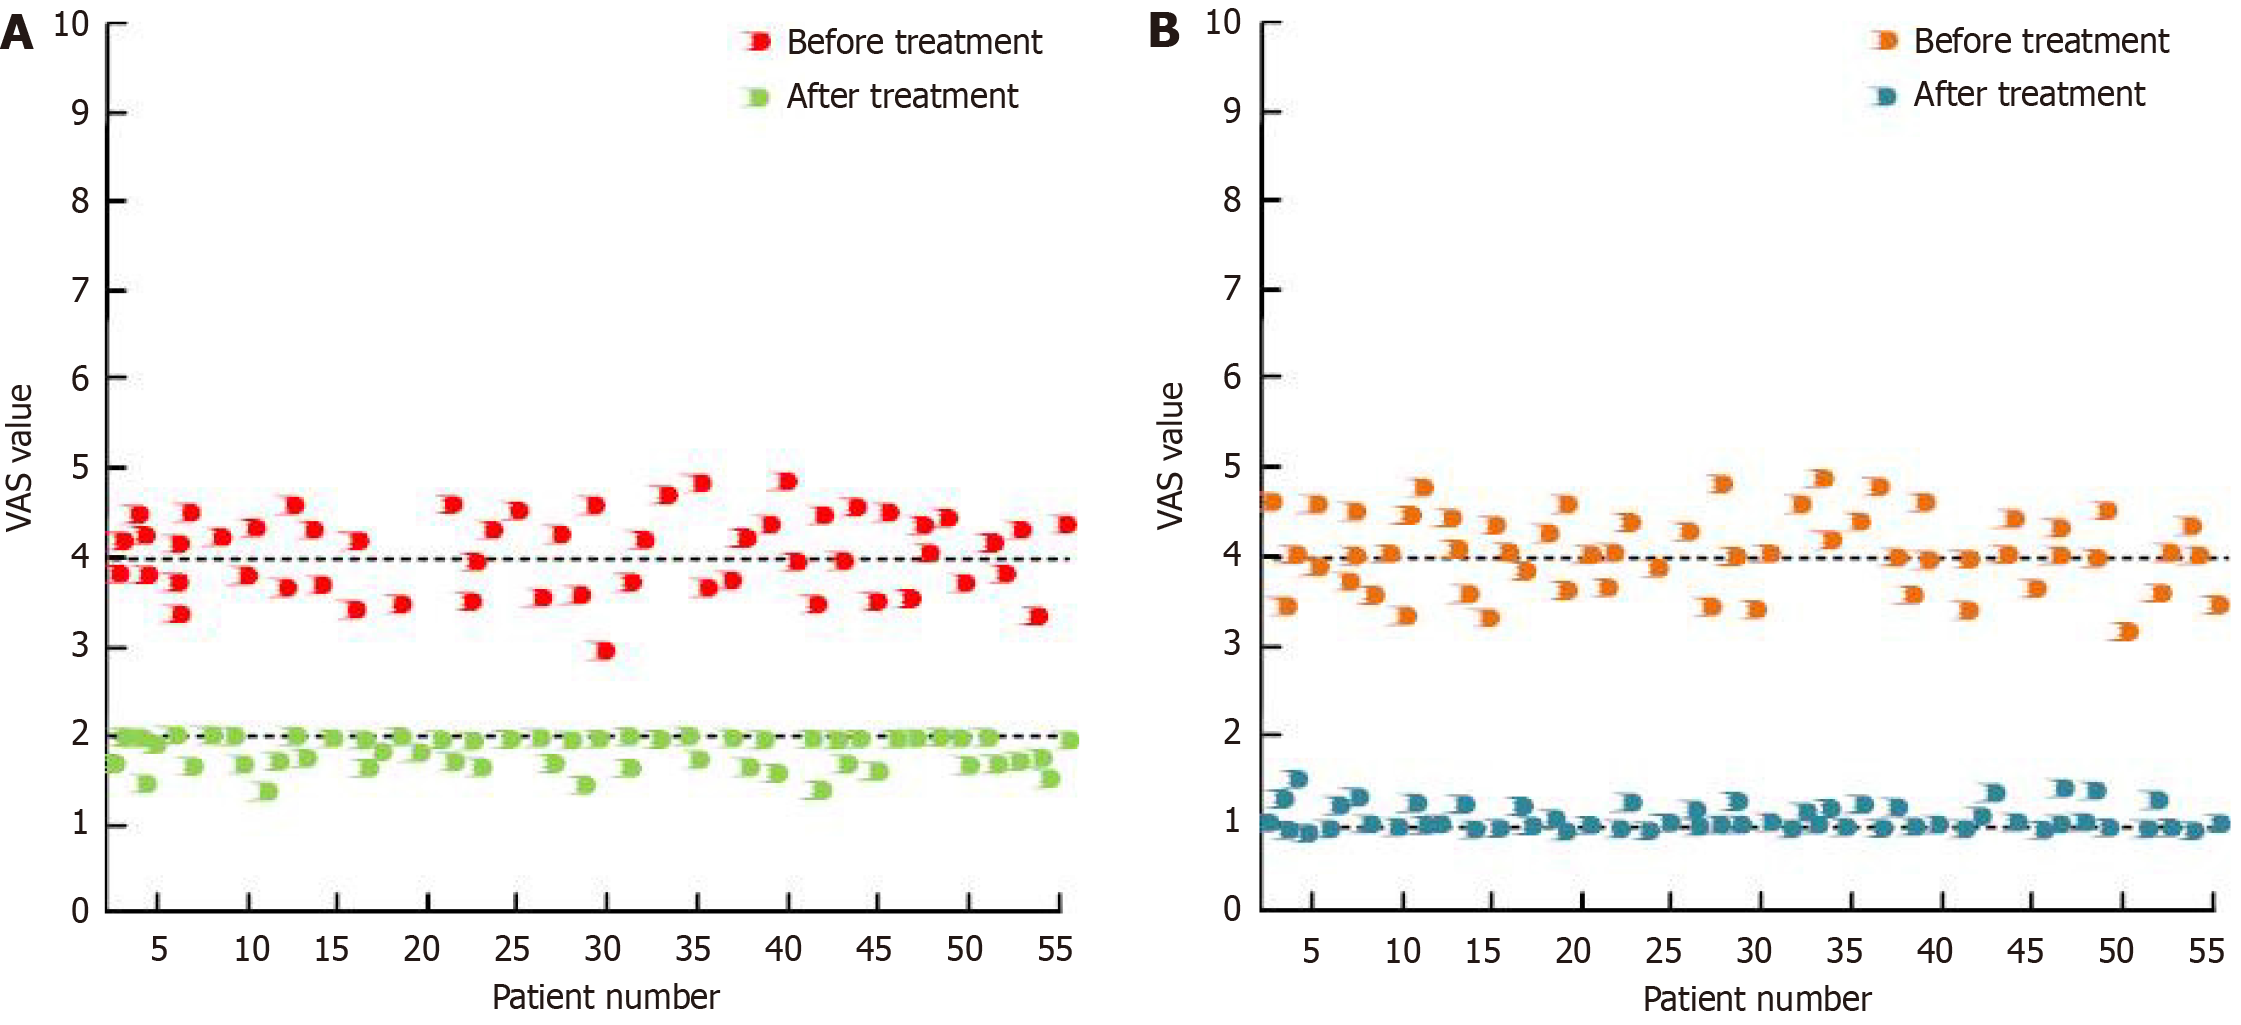
Figure 1 The distribution of visual analysis scale scores between two groups of patients.
A: Control group; B: Test group. VAS: Visual analysis scale.
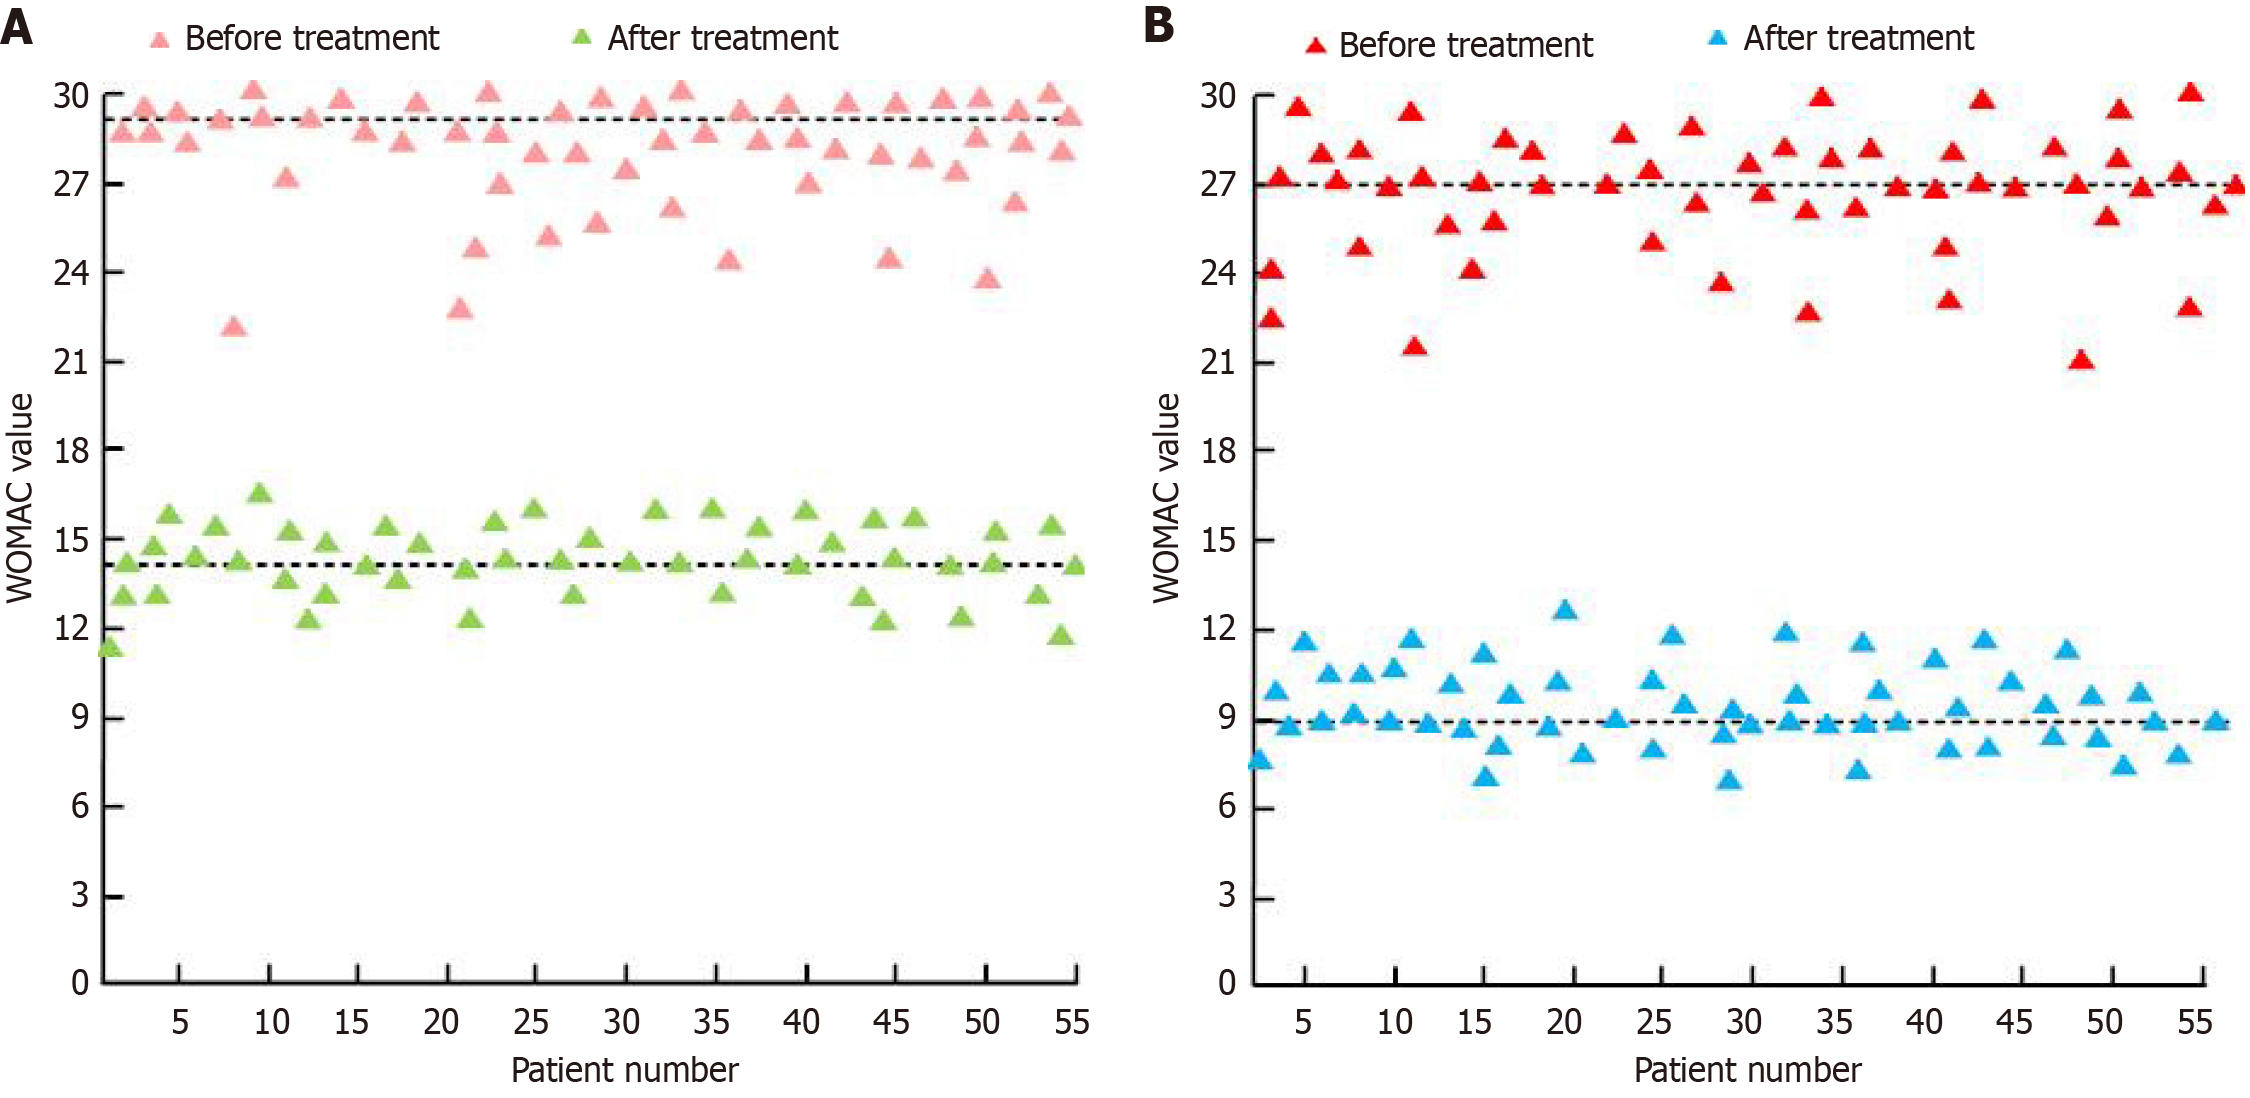
Figure 2 Western Ontario and McMaster Universities Osteoarthritis Index score distribution.
A: Control group; B: Test group. WOMAC: Western Ontario and McMaster Universities Osteoarthritis Index.
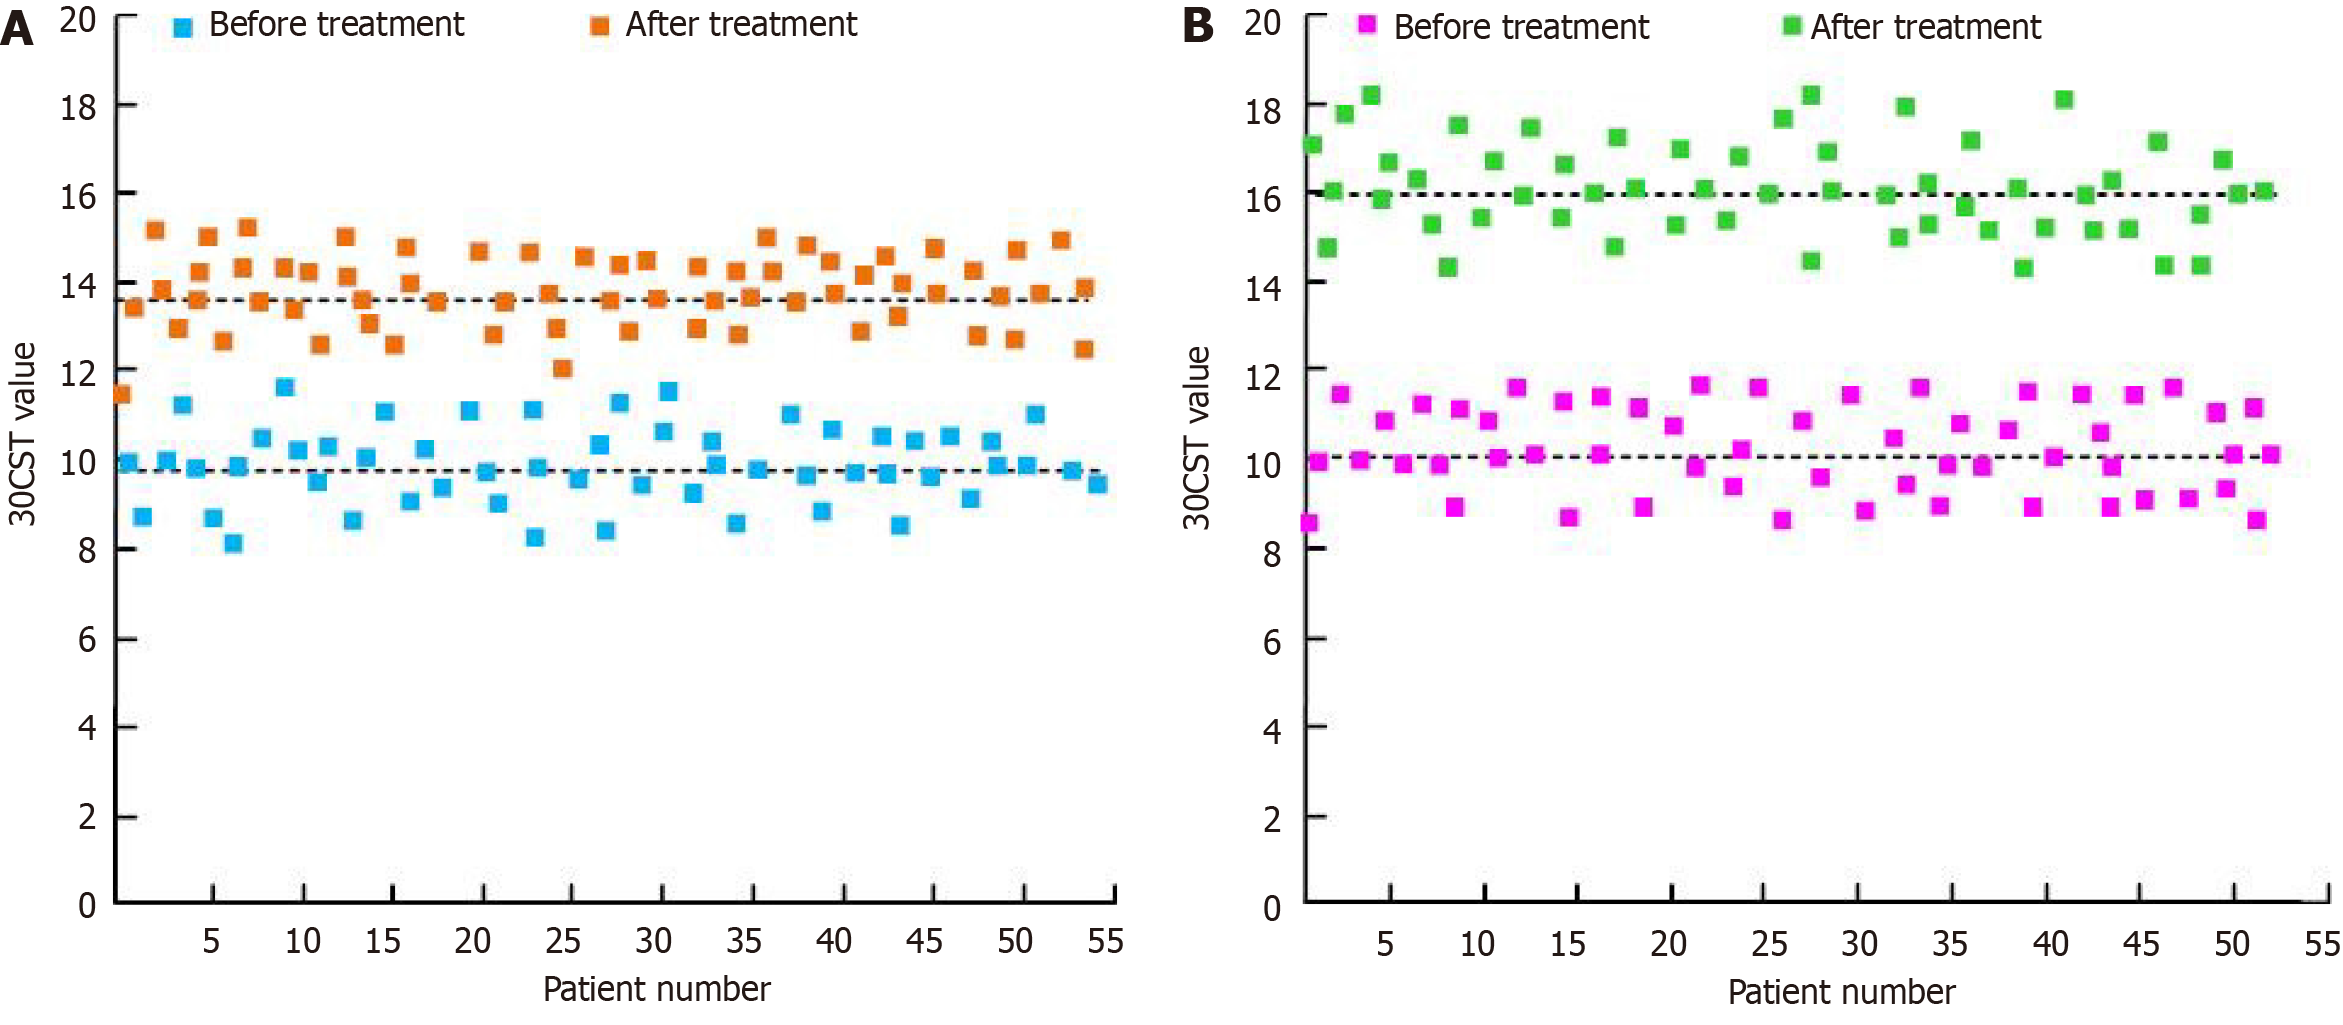
Figure 3 30 s Chair Stand Test results.
A: Control group; B: Test group. 30CST: 30 s Chair Stand Test.
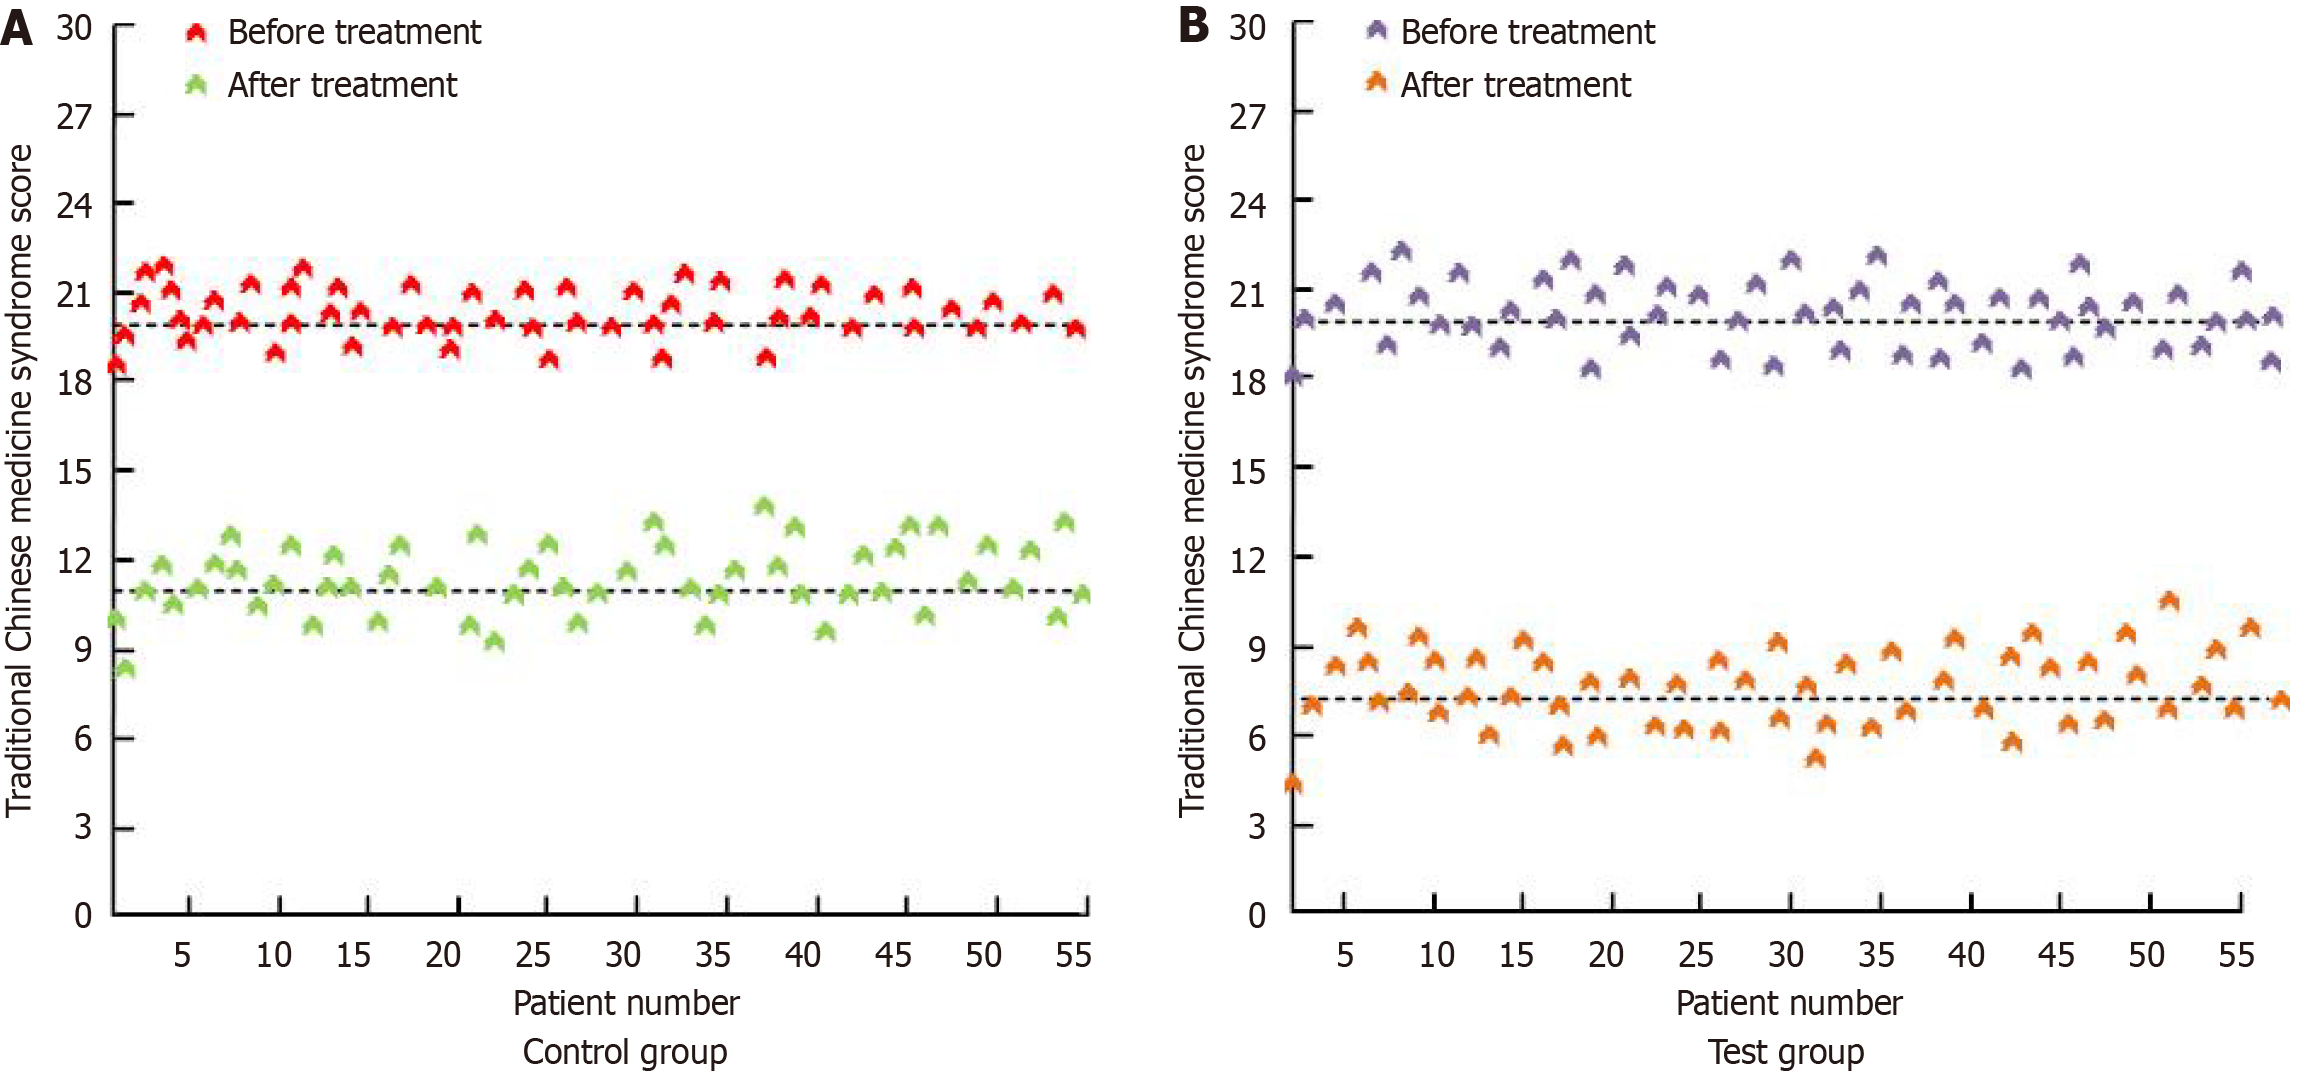
Figure 4 The distribution of traditional Chinese medicine syndrome results.
A: Control group; B: Test group.
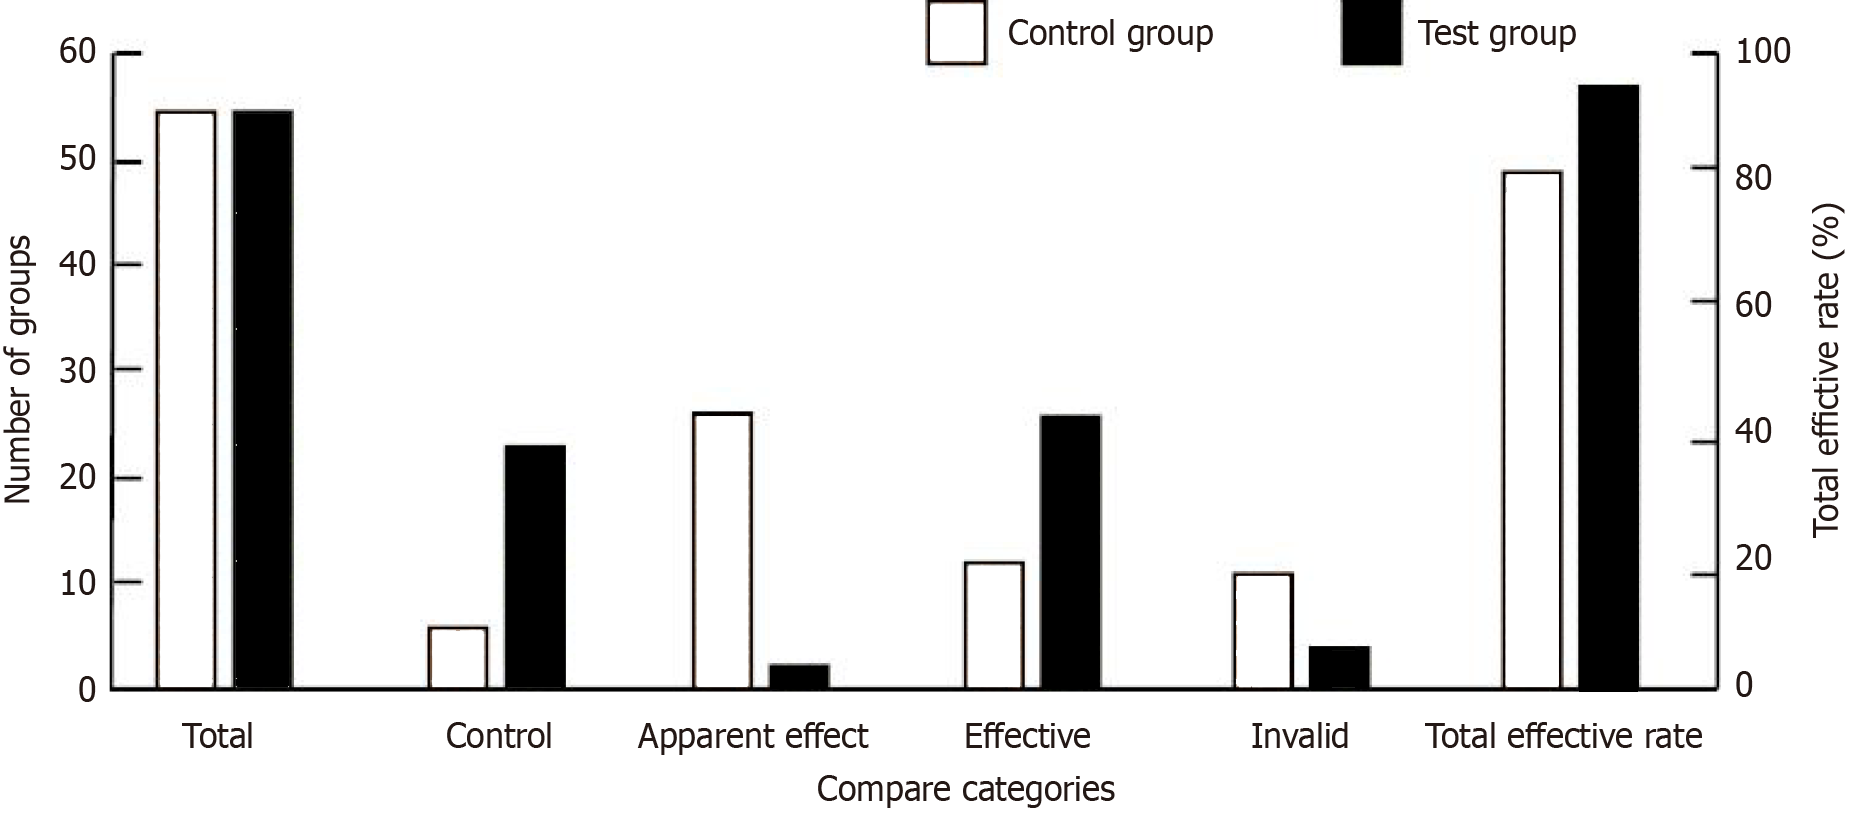
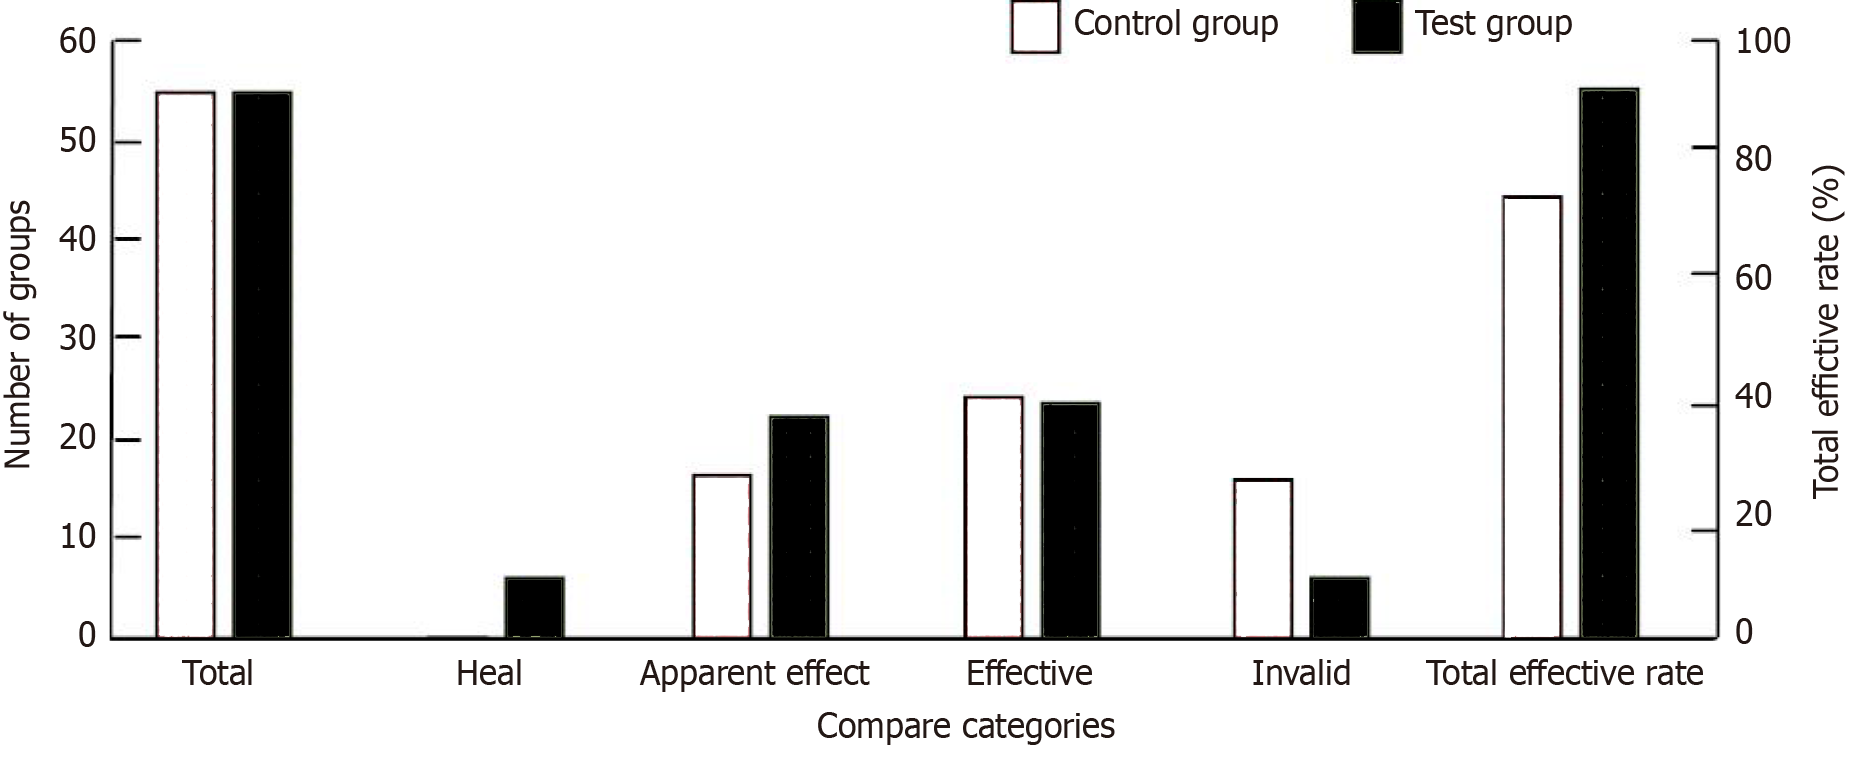
Figure 5 Clinical efficacy of two groups of patients.
Figure 6 Comparison of the therapeutic effects of traditional Chinese medicine symptoms.
- Citation: Ni HY, Zhang YP, Zhang XF. Therapeutic effect of San Bi Tang combined with glucosamine sulfate capsules in cold-dampness-type knee osteoarthritis. World J Clin Cases 2024; 12(19): 3854-3865
- URL: https://www.wjgnet.com/2307-8960/full/v12/i19/3854.htm
- DOI: https://dx.doi.org/10.12998/wjcc.v12.i19.3854


