Copyright
©The Author(s) 2024.
World J Clin Cases. Jun 26, 2024; 12(18): 3428-3437
Published online Jun 26, 2024. doi: 10.12998/wjcc.v12.i18.3428
Published online Jun 26, 2024. doi: 10.12998/wjcc.v12.i18.3428
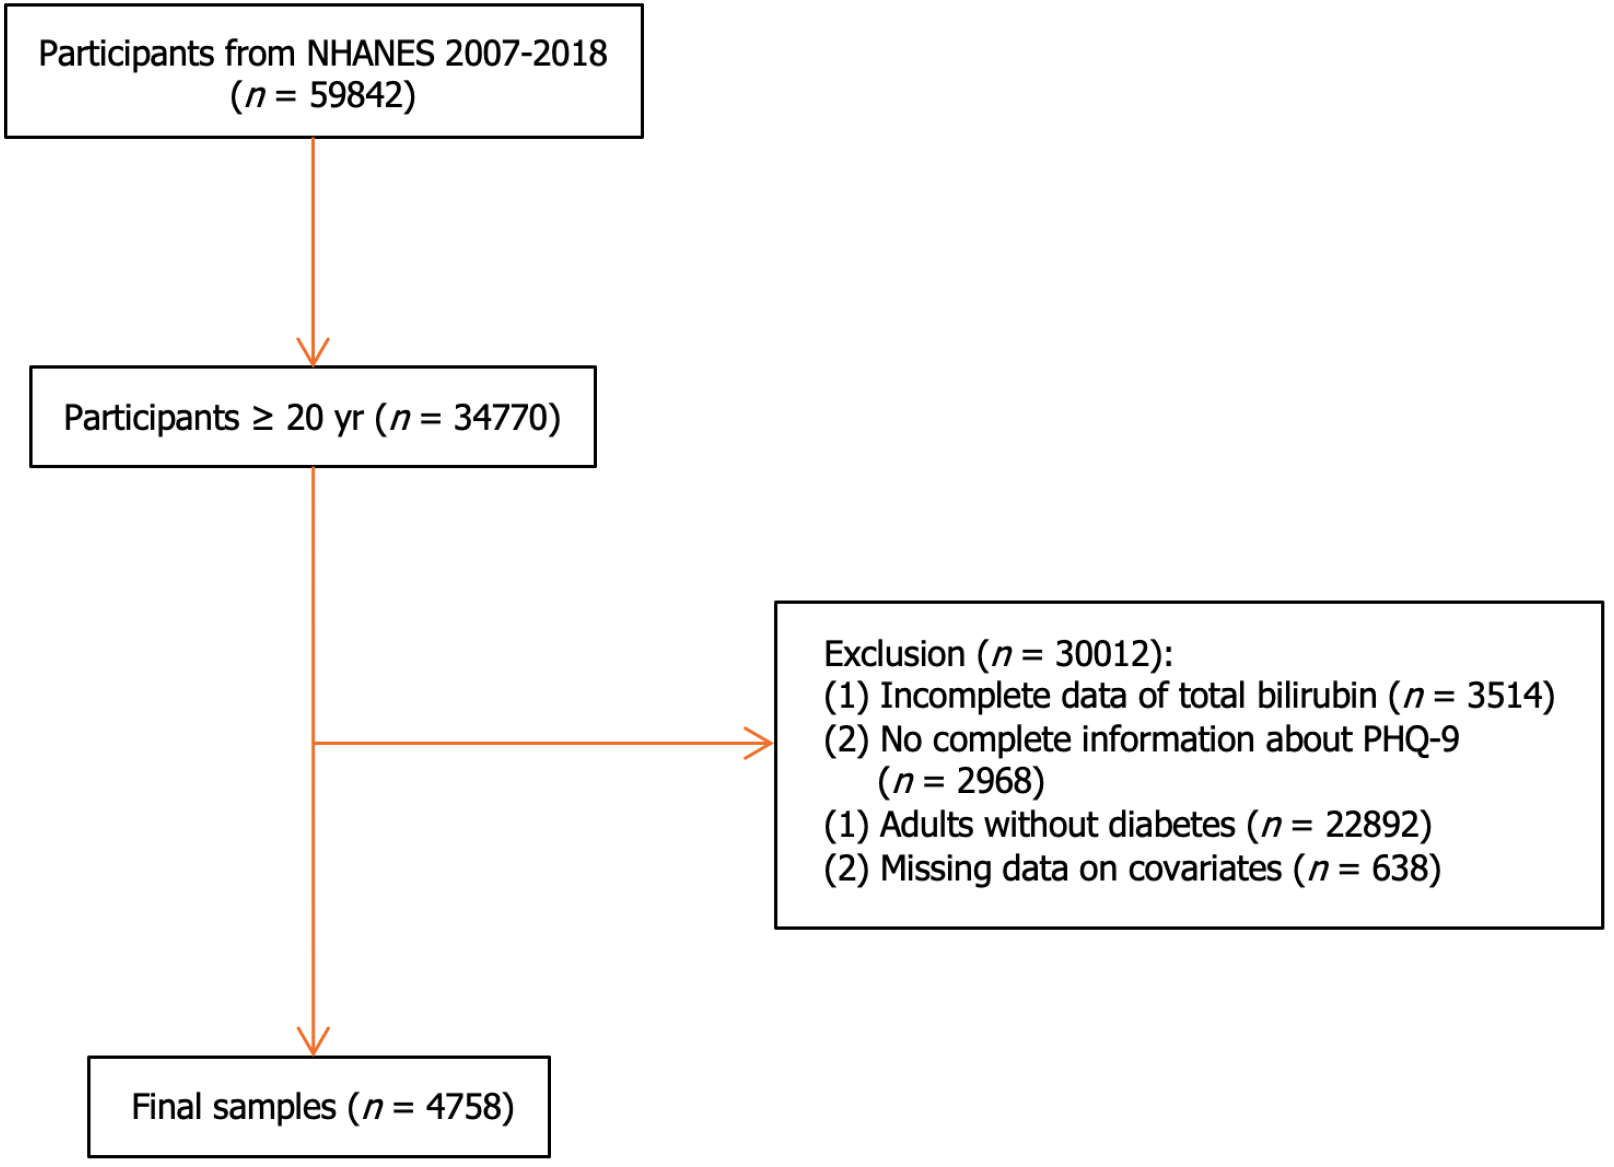
Figure 1 Study flowchart.
NHANES: National Health and Nutrition Examination Survey; PHQ-9: Patient Health Questionnaire-9.
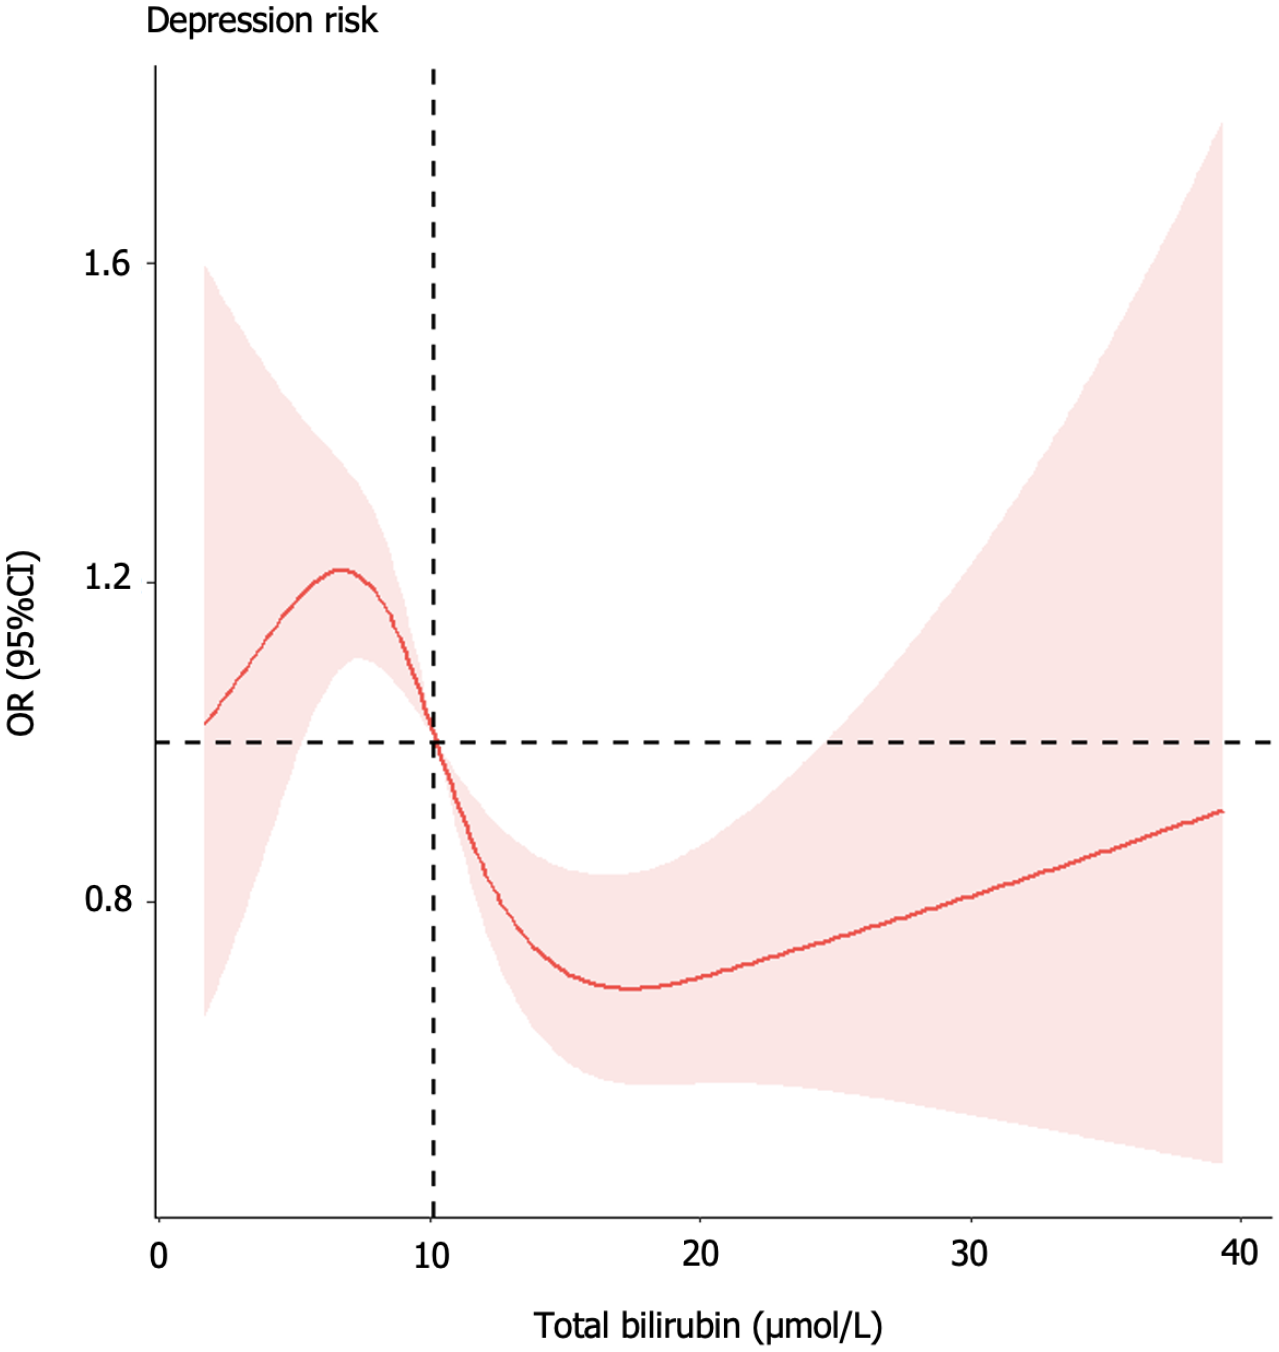
Figure 2 Restricted cubic spline regression curve of the odds ratios (OR) of total bilirubin with depression in adults with diabetes.
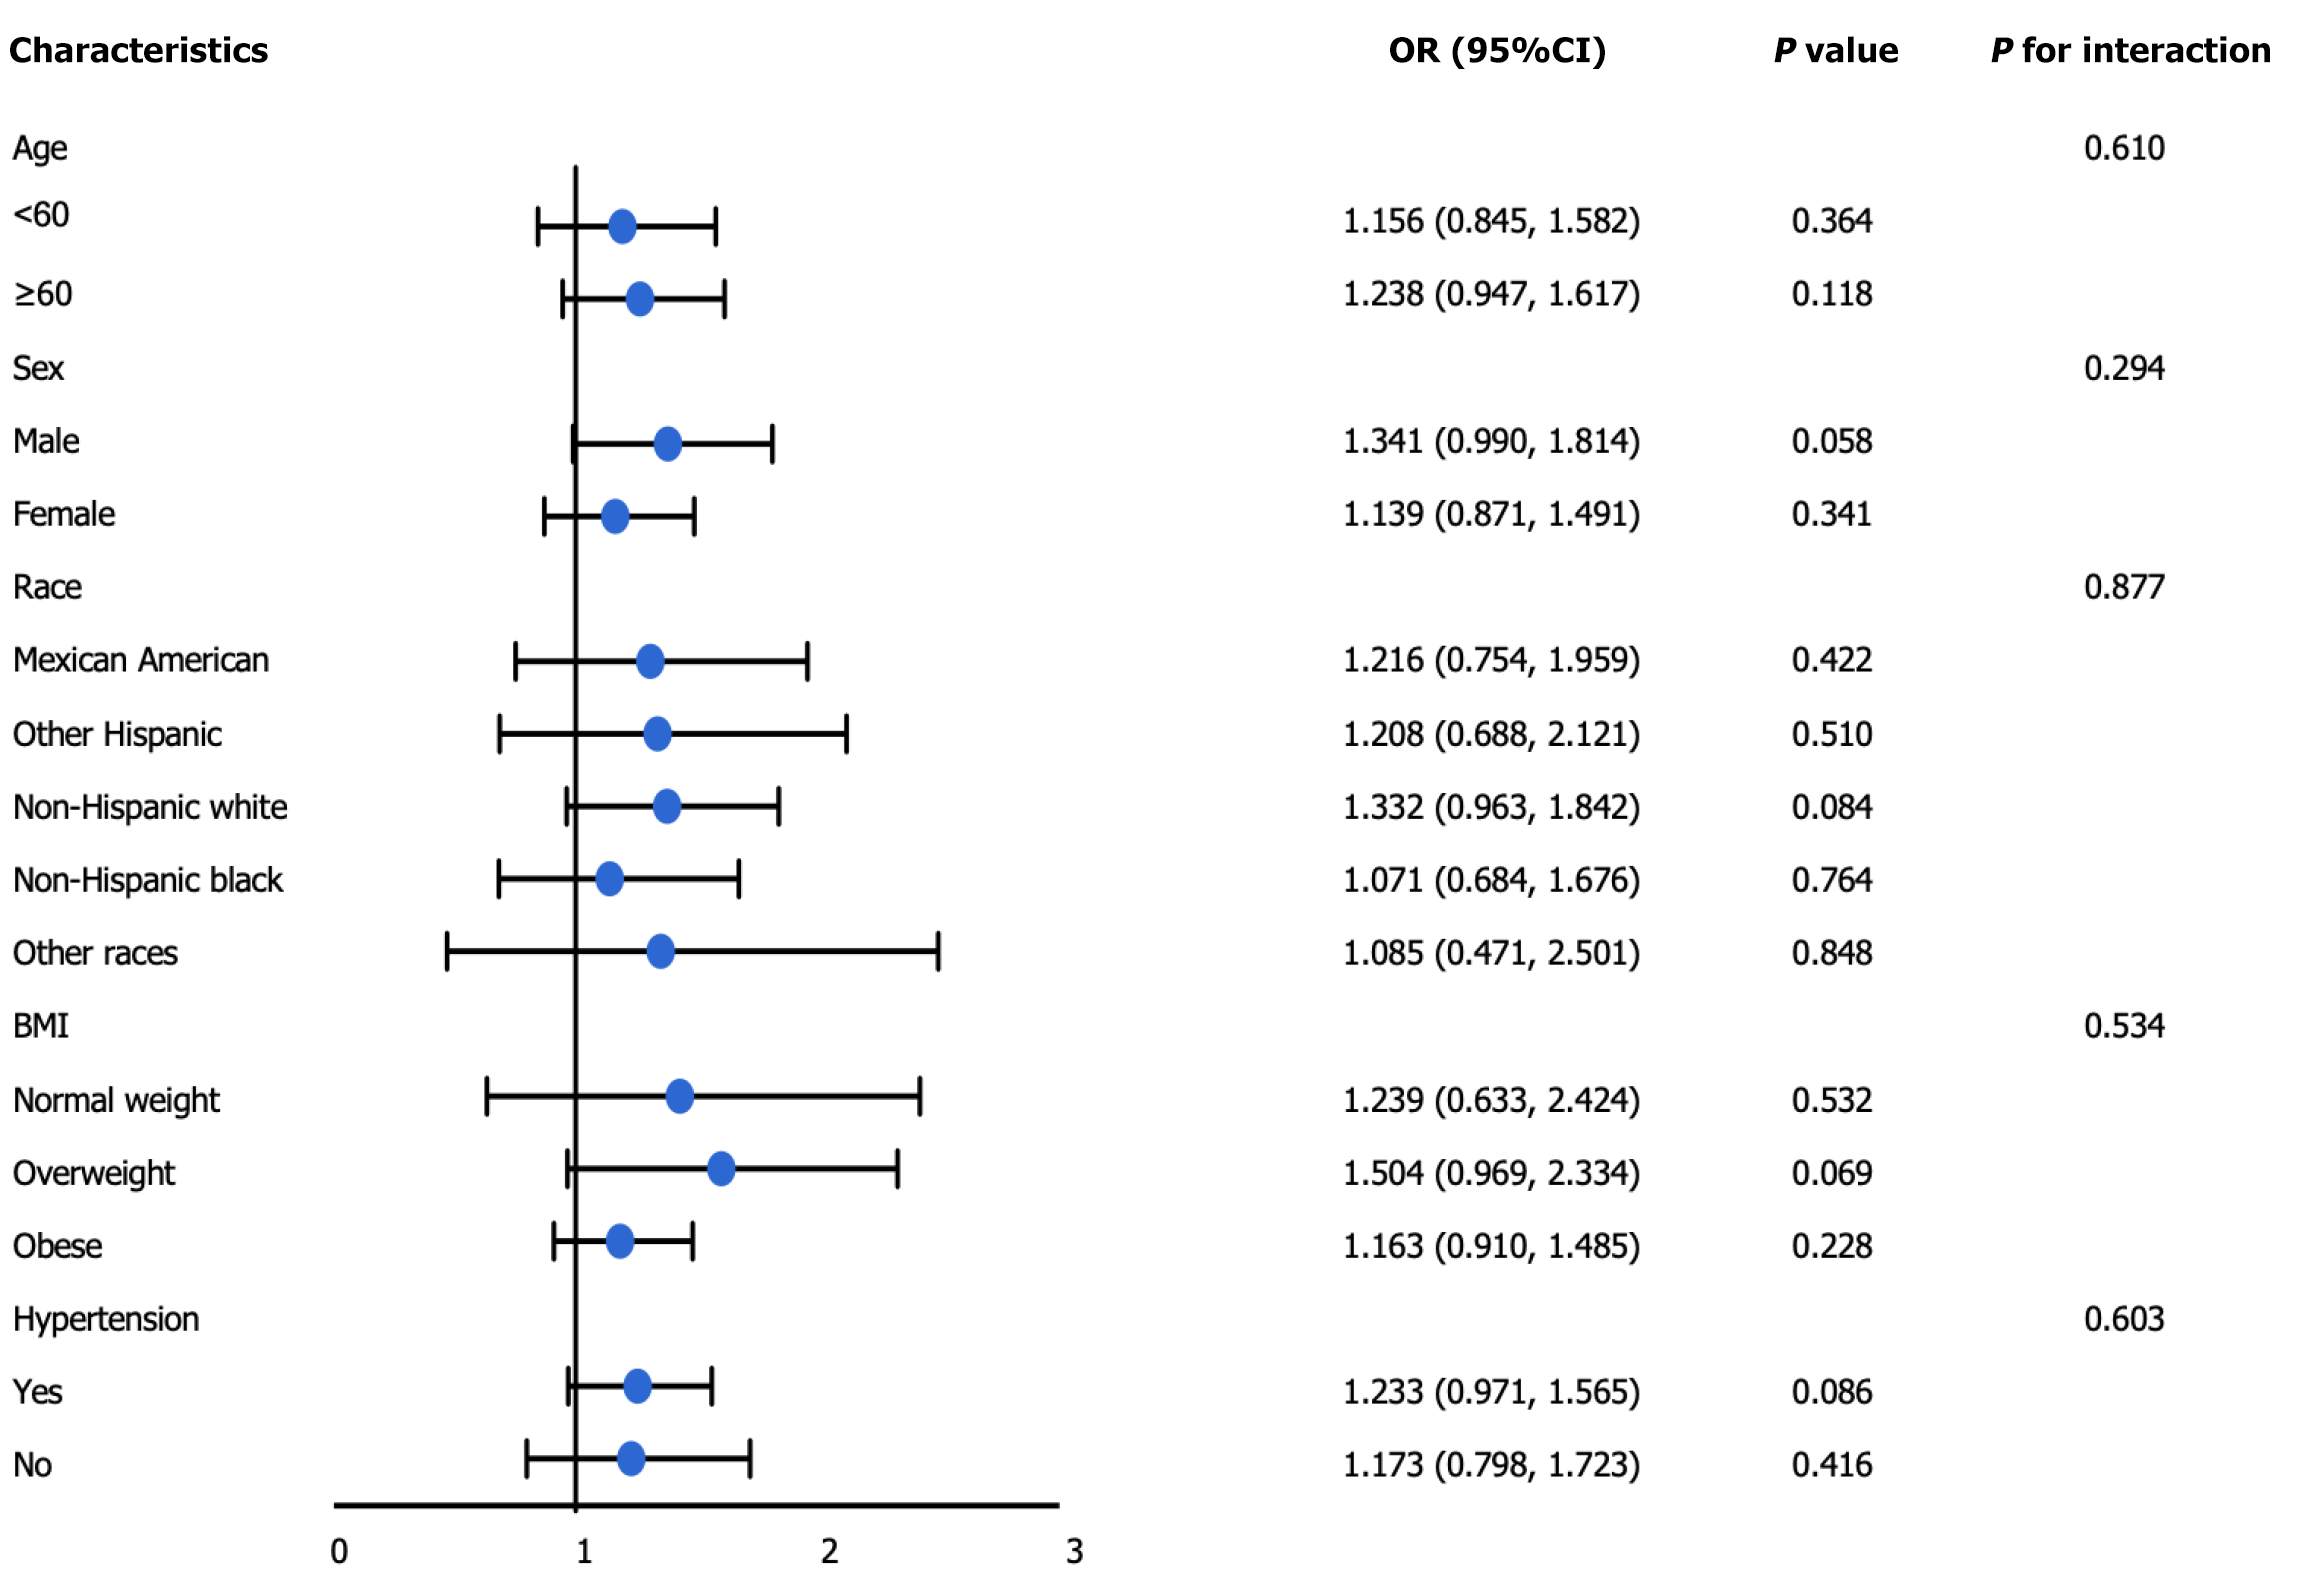
Figure 3 Subgroup analysis for the association between total bilirubin and depression risk in adults with diabetes.
- Citation: Ye ML, Wang JK. Association of total bilirubin with depression risk in adults with diabetes: A cross-sectional study. World J Clin Cases 2024; 12(18): 3428-3437
- URL: https://www.wjgnet.com/2307-8960/full/v12/i18/3428.htm
- DOI: https://dx.doi.org/10.12998/wjcc.v12.i18.3428


