Copyright
©The Author(s) 2024.
World J Clin Cases. Jun 16, 2024; 12(17): 3061-3075
Published online Jun 16, 2024. doi: 10.12998/wjcc.v12.i17.3061
Published online Jun 16, 2024. doi: 10.12998/wjcc.v12.i17.3061
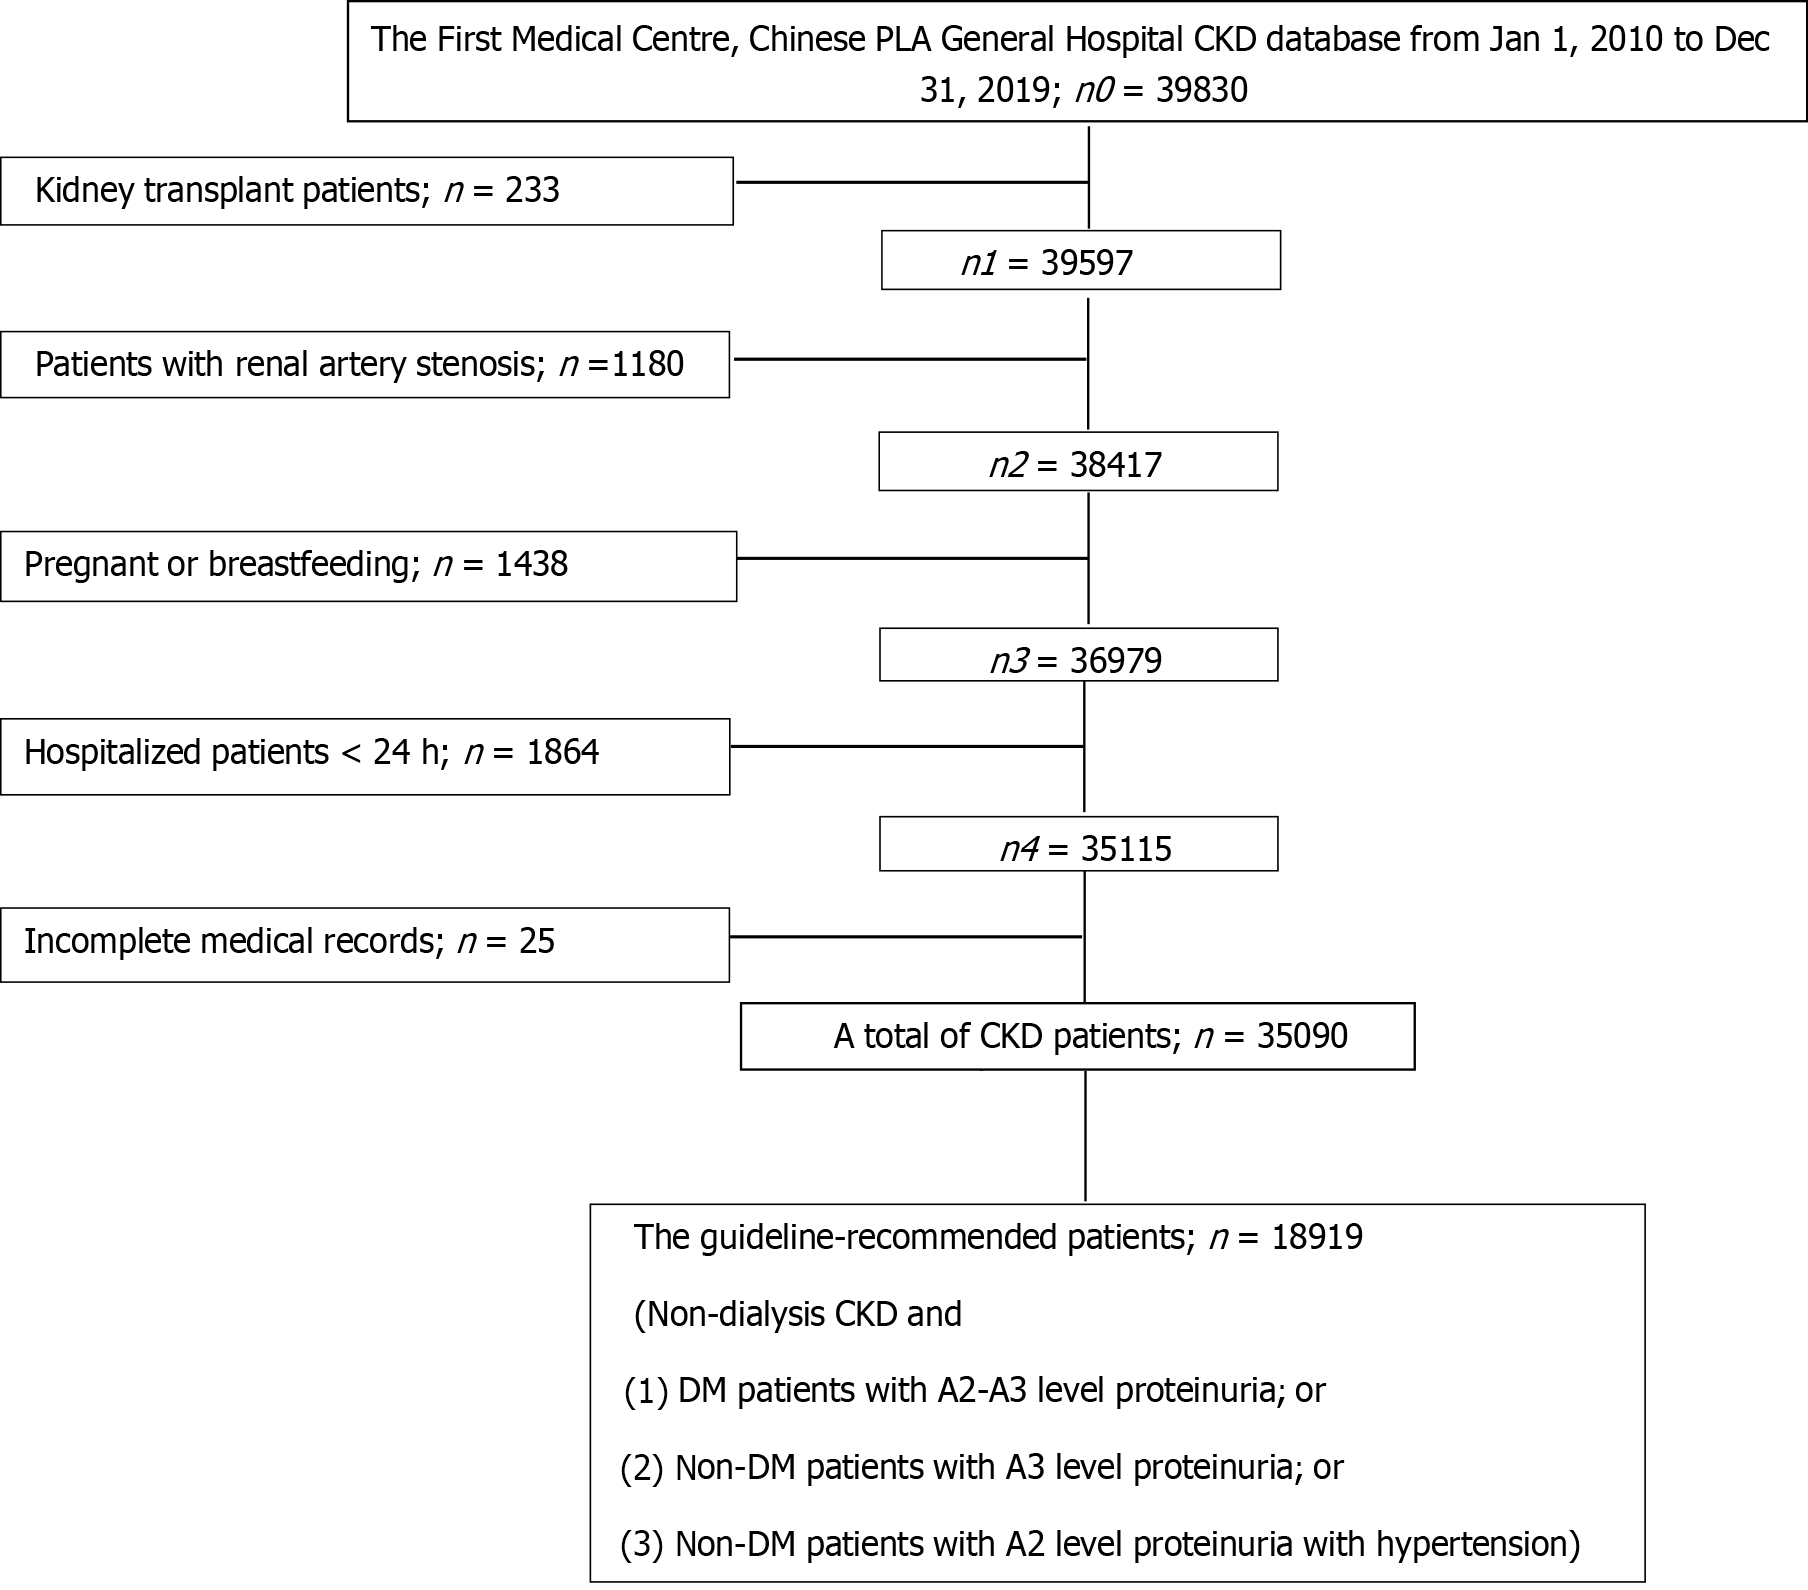
Figure 1 Flow chart of patient selection.
CKD: Chronic kidney disease; DM: Diabetes mellitus.
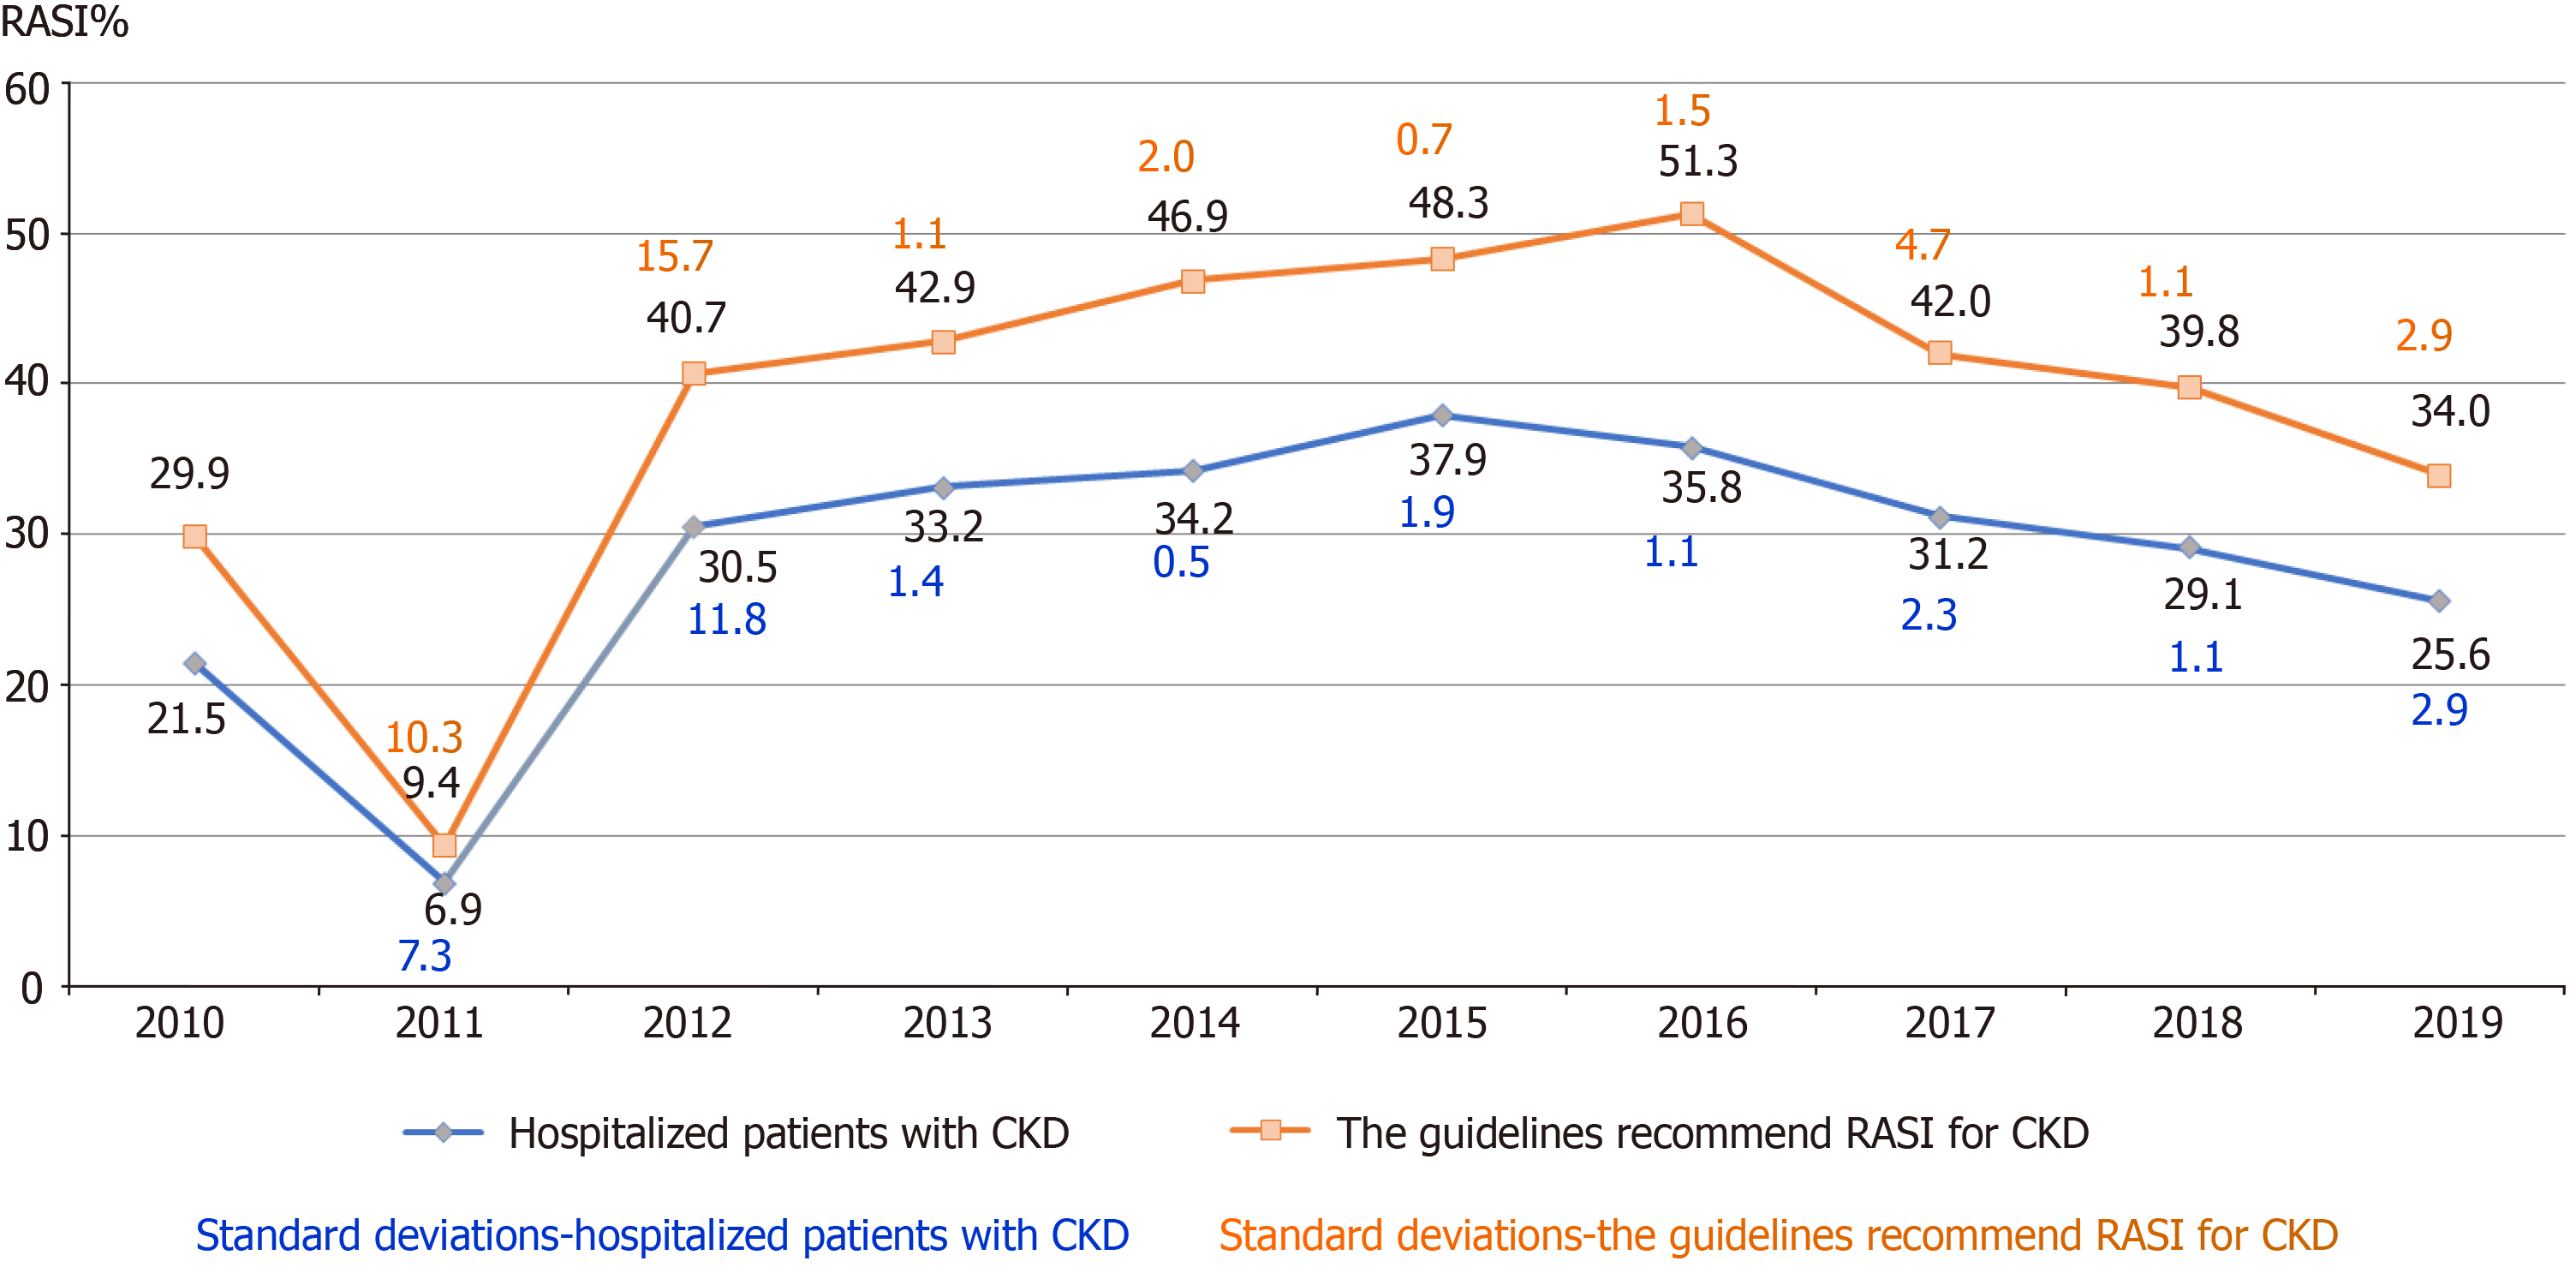
Figure 2 Trends of the frequency of renin-angiotensin system inhibitors prescriptions from 2010 to 2019, in all patients included in the analysis, guideline-recommended patients, elderly patients.
CKD: Chronic kidney disease; RASI: Renin-angiotensin system inhibitors.
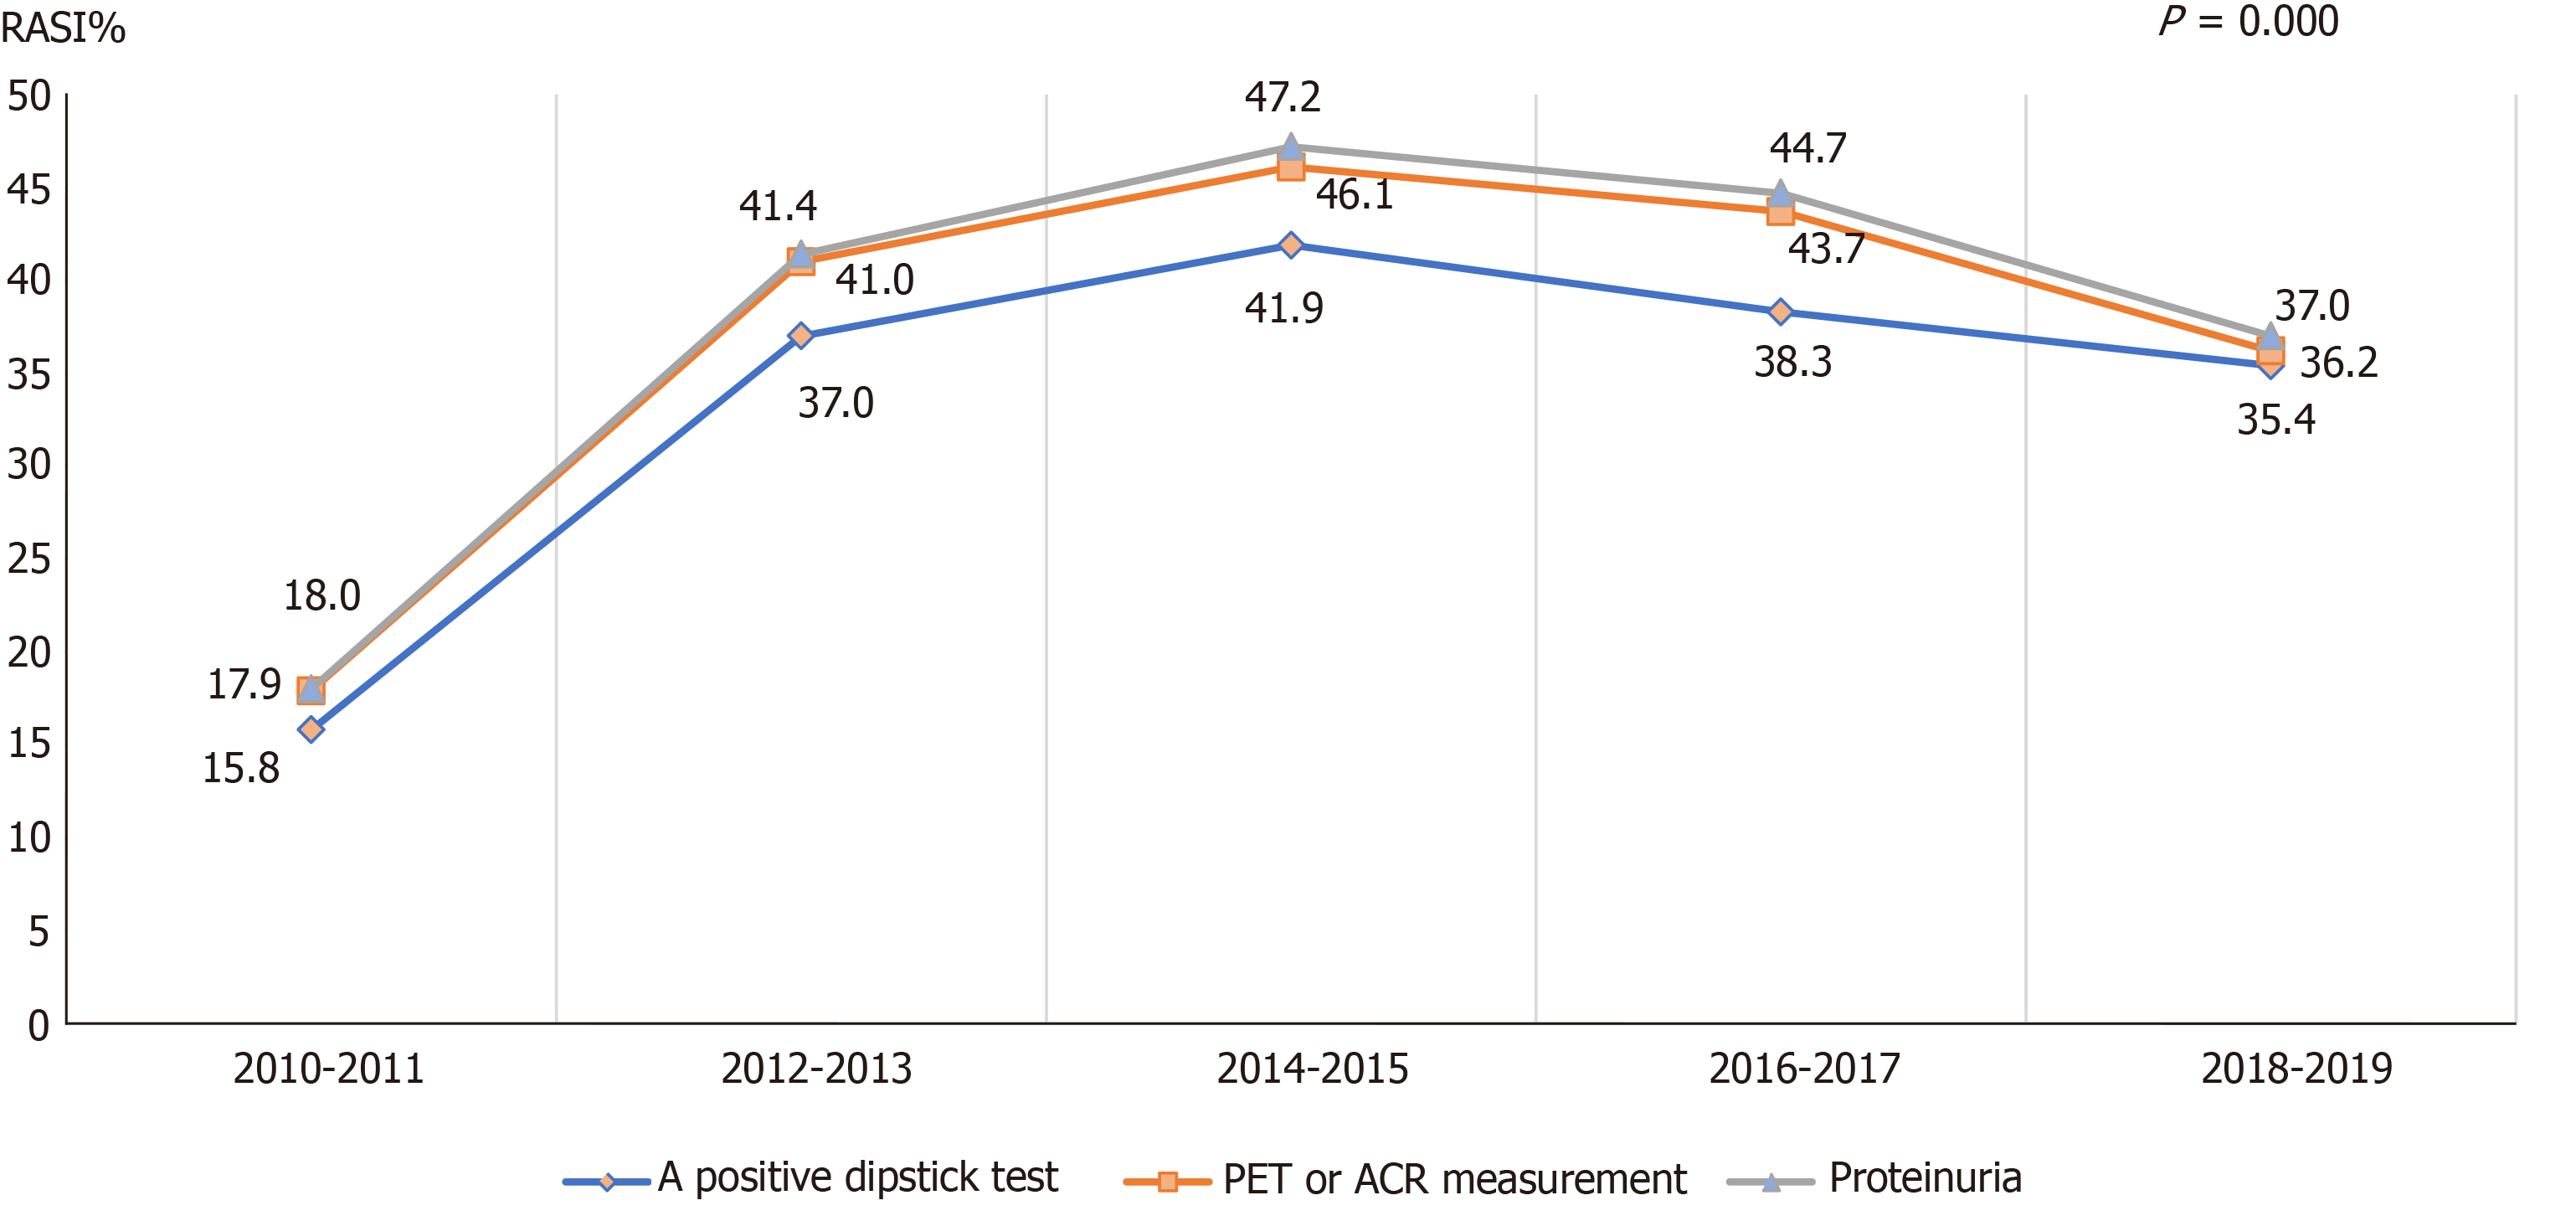
Figure 3 Trends of the frequency of renin-angiotensin system inhibitors prescriptions from 2010 to 2019 in patients where different methods for detecting proteinuria were used.
RASI: Renin-angiotensin system inhibitors; ACR: Albumin to creatinine ratio.
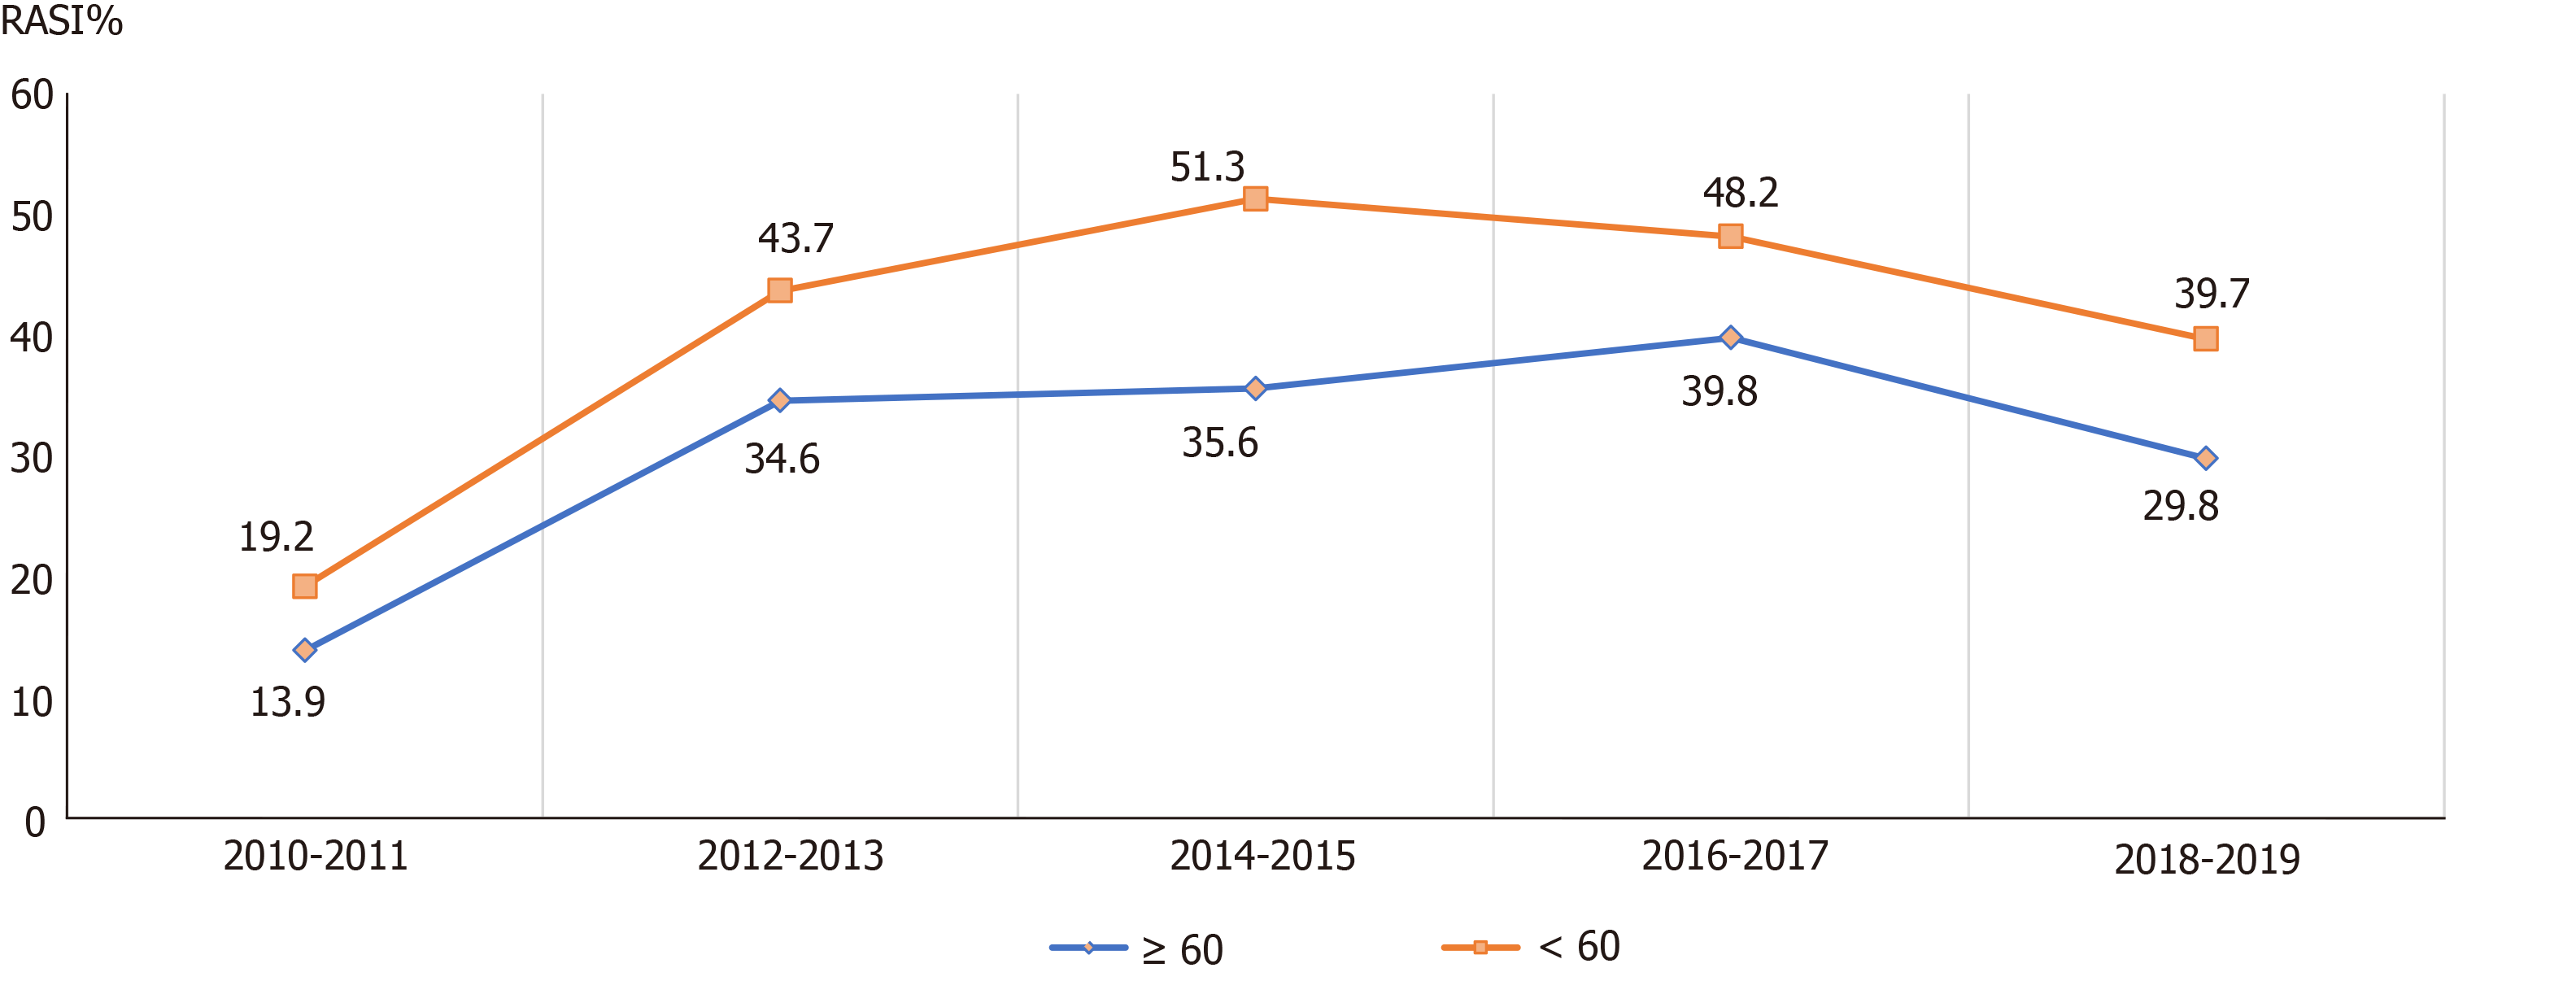
Figure 4 Trends of the frequency of renin-angiotensin system inhibitors prescriptions from 2010 to 2019 in the guideline-recommended chronic kidney disease patients of different age groups.
RASI: Renin-angiotensin system inhibitors.
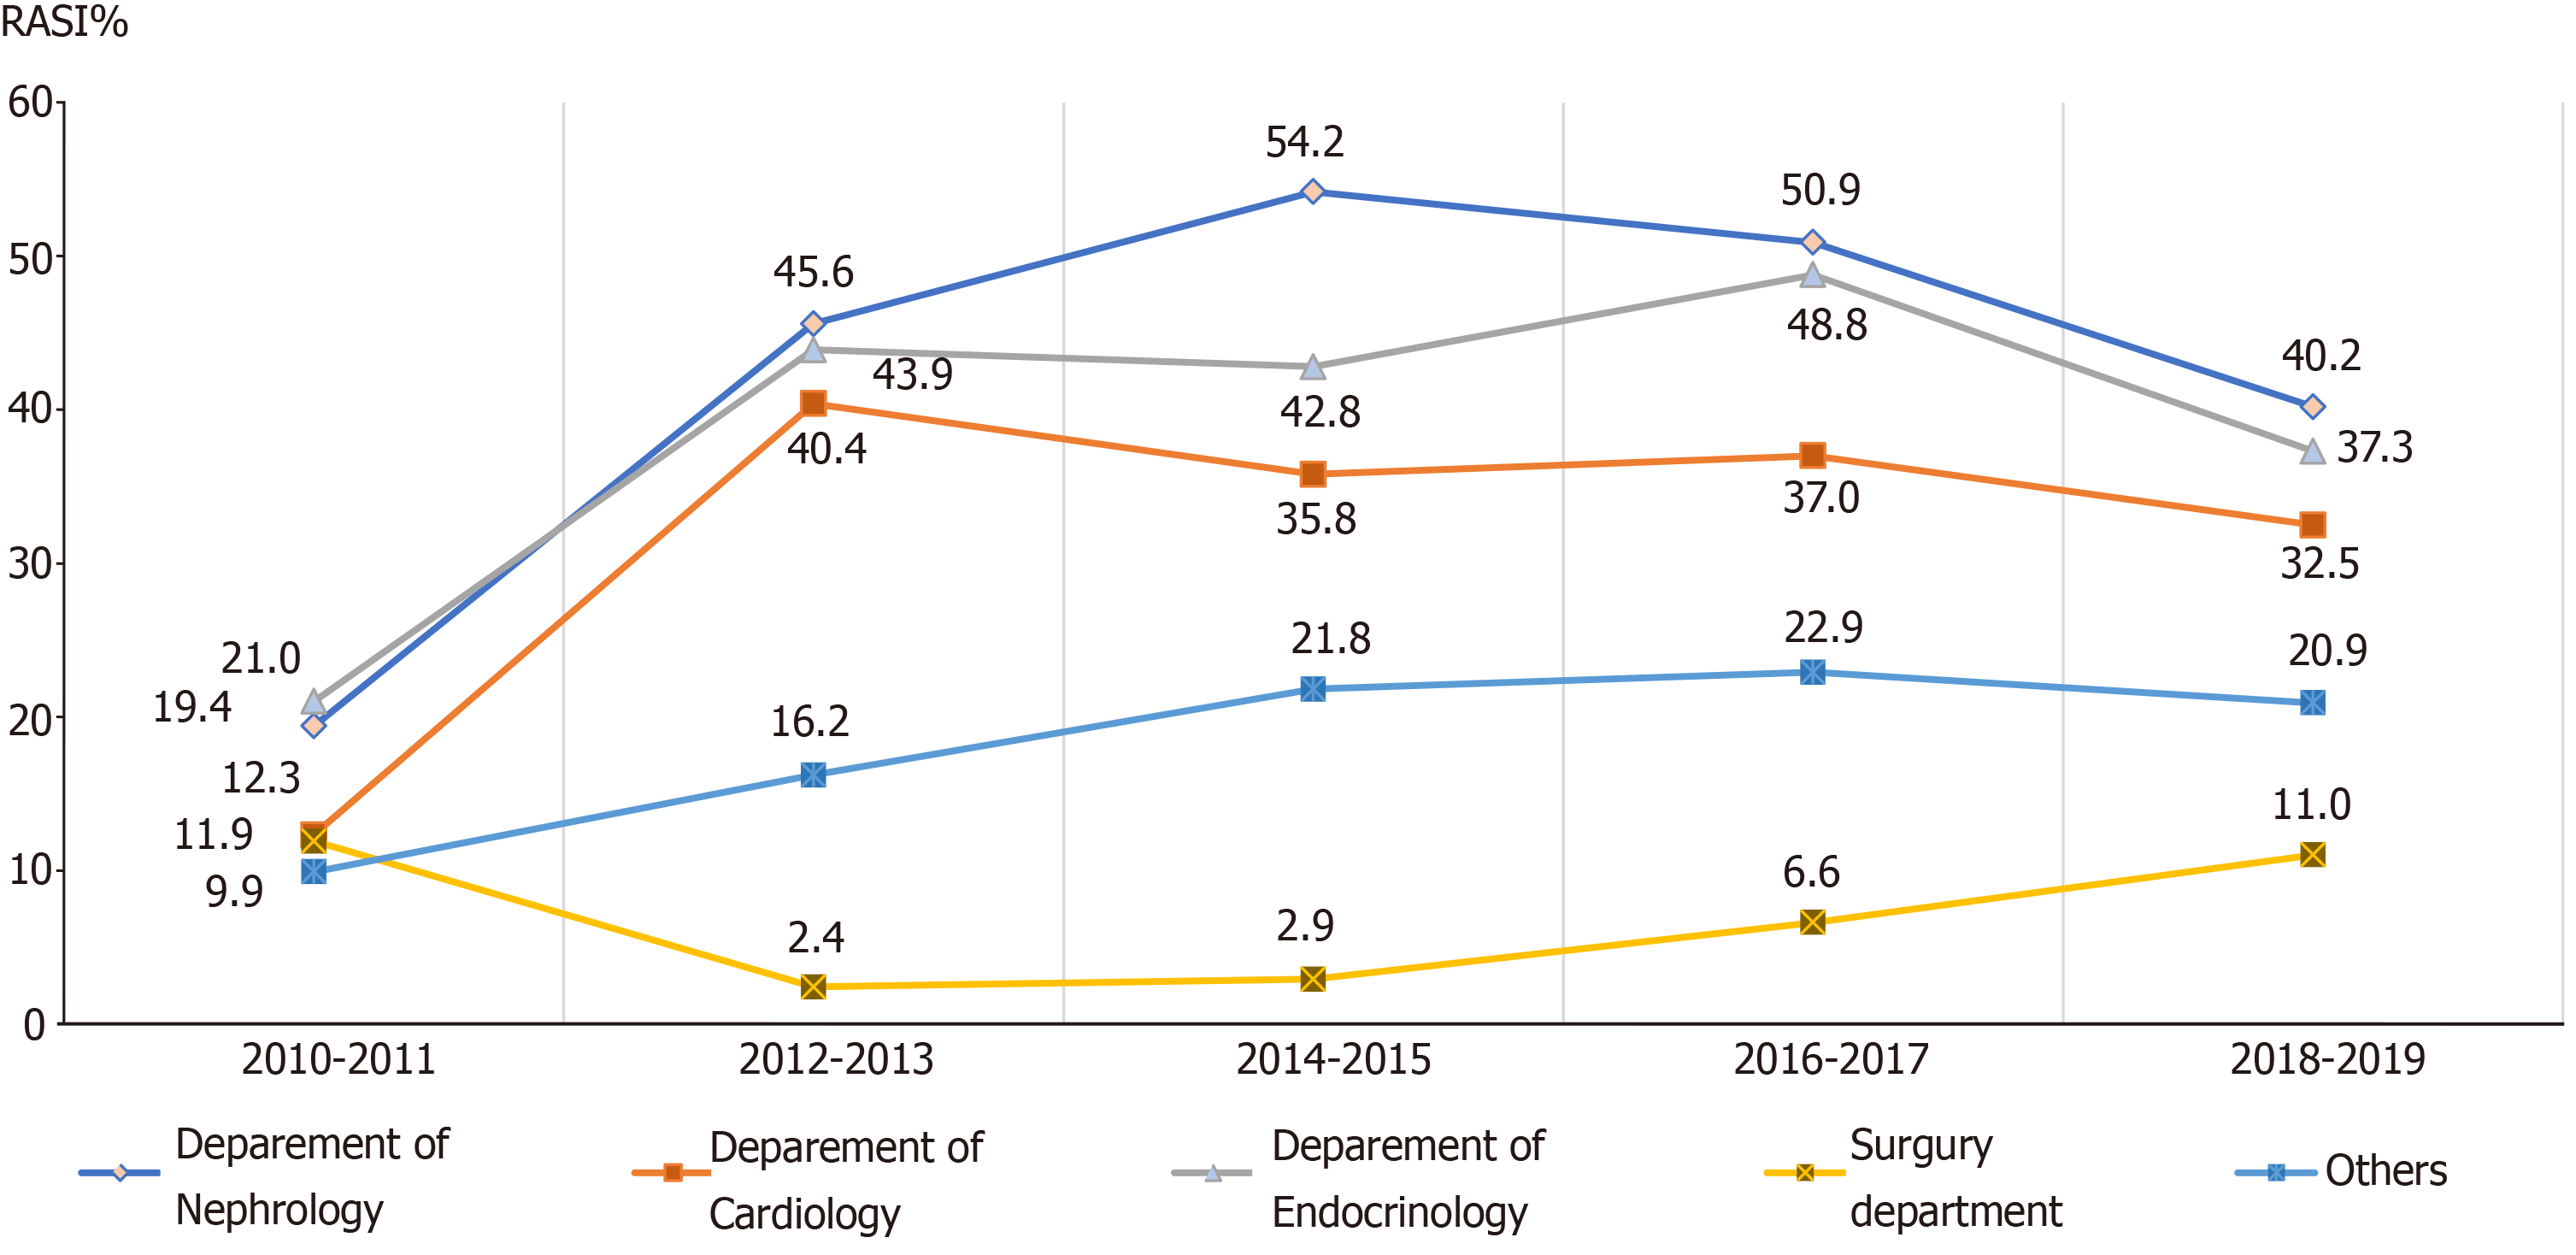
Figure 5 Trends of the frequency of renin-angiotensin system inhibitors prescriptions from 2010 to 2019 in guideline-recommended patients in different admission departments.
RASI: Renin-angiotensin system inhibitors.
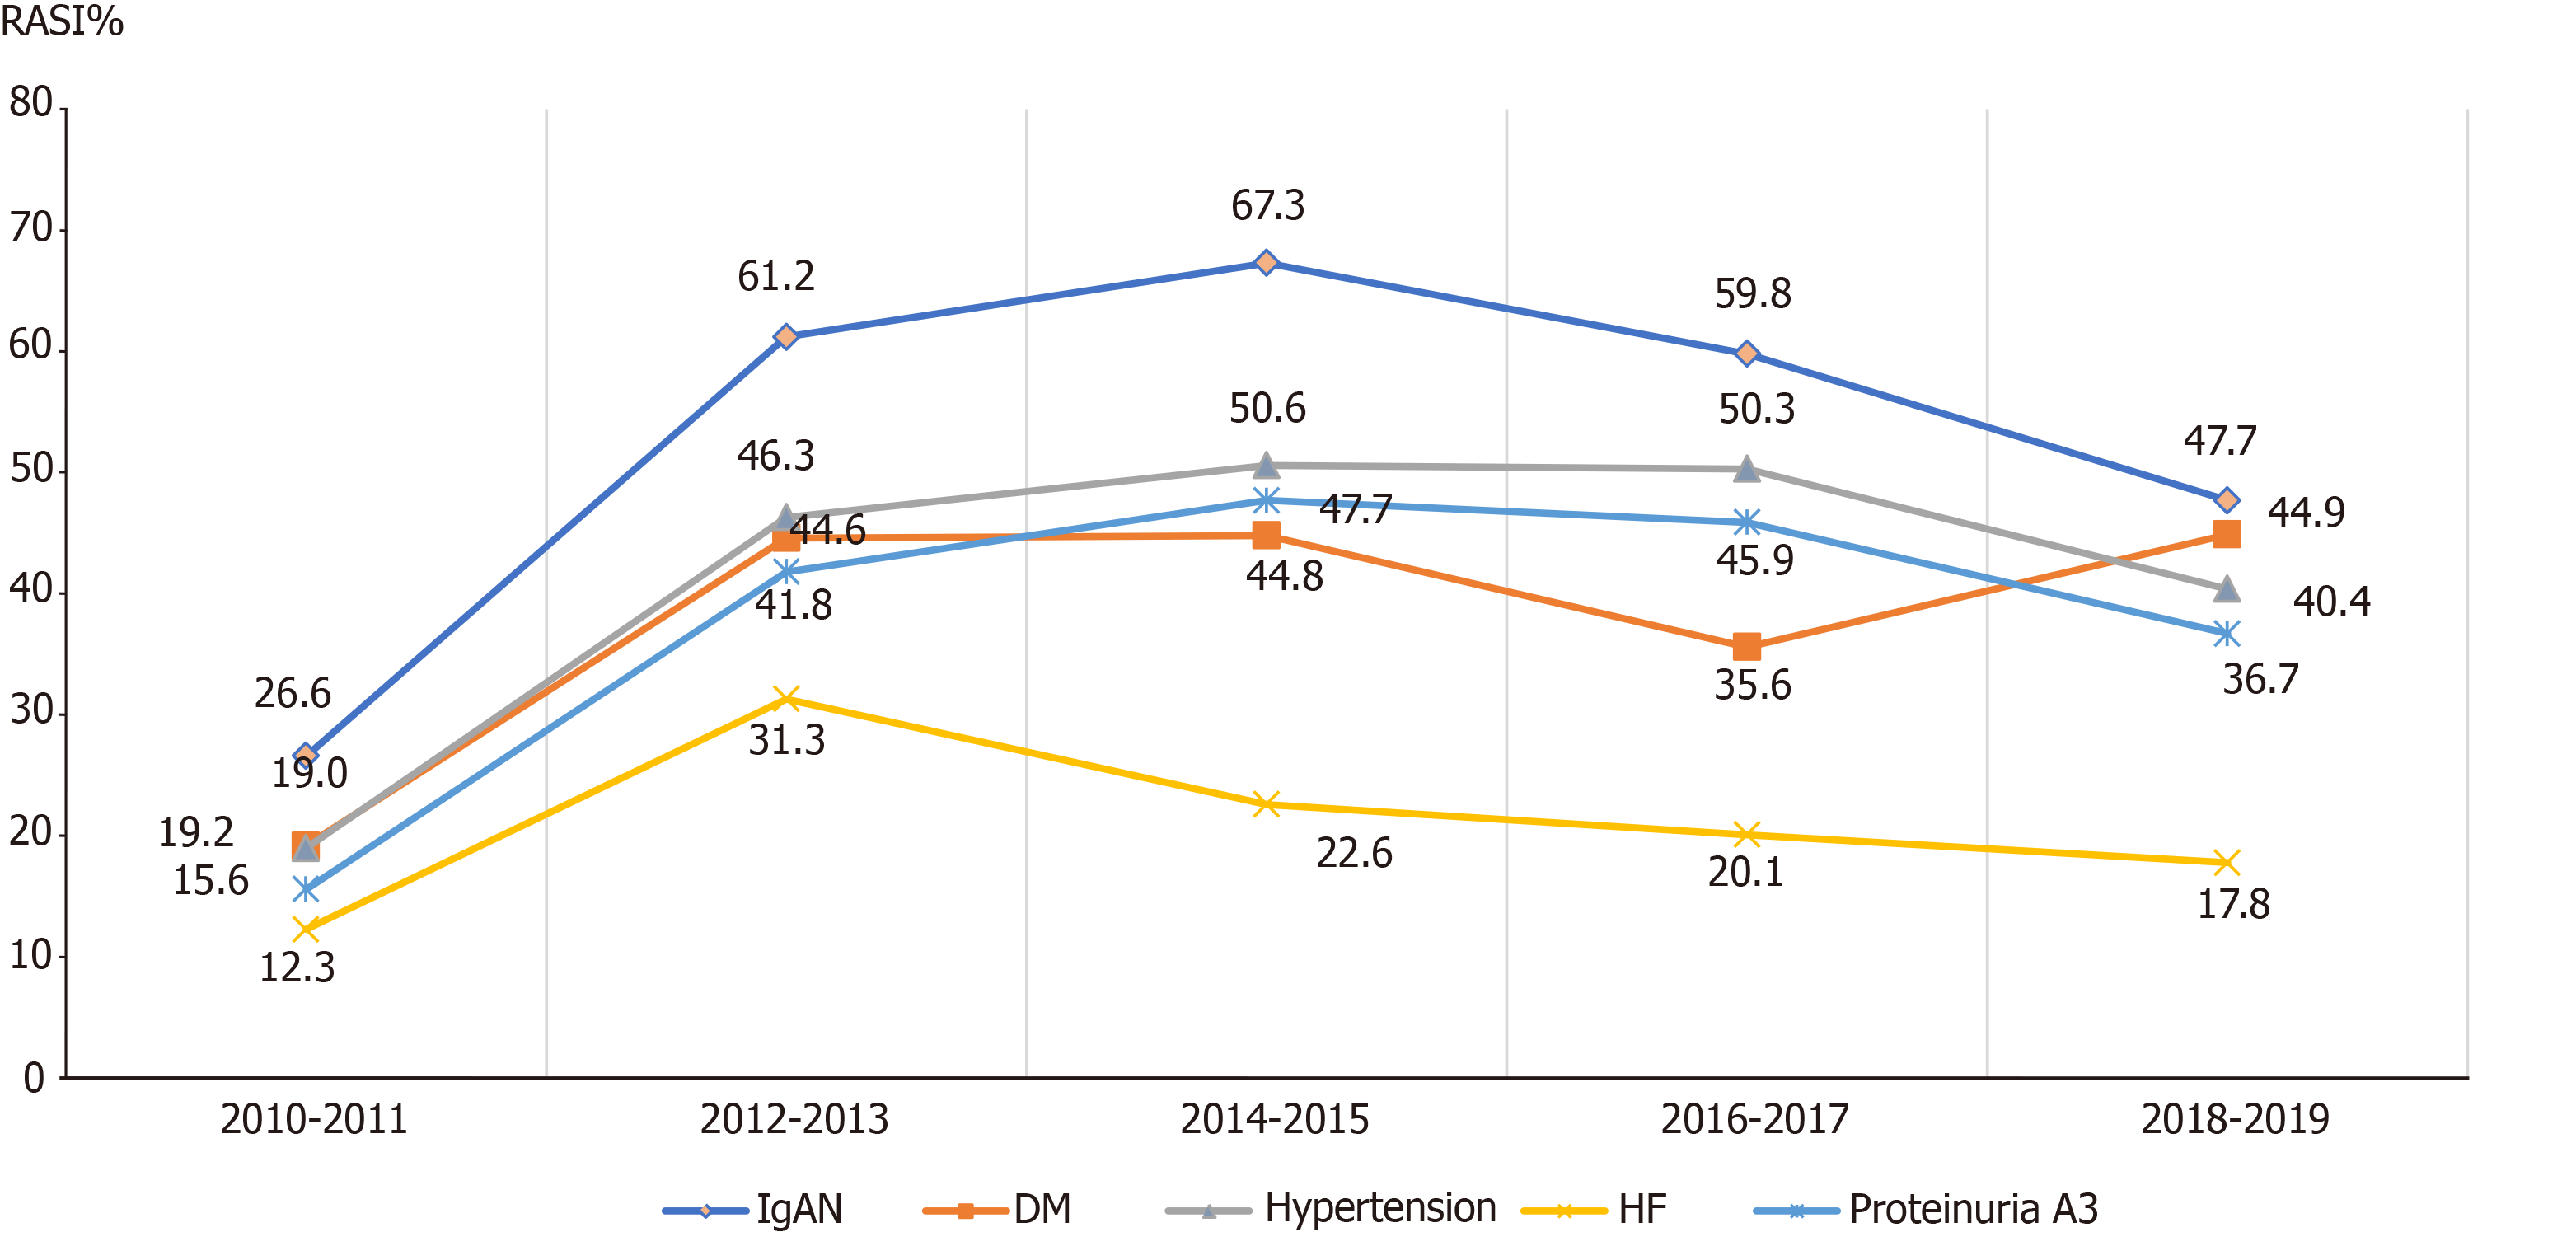
Figure 6 Trends of the frequency of renin-angiotensin system inhibitors prescriptions from 2010 to 2019 in guideline-recommended patients with different chronic kidney disease etiologies.
RASI: Renin-angiotensin system inhibitors; DM: Diastolic blood pressure; HF: Heart failure.
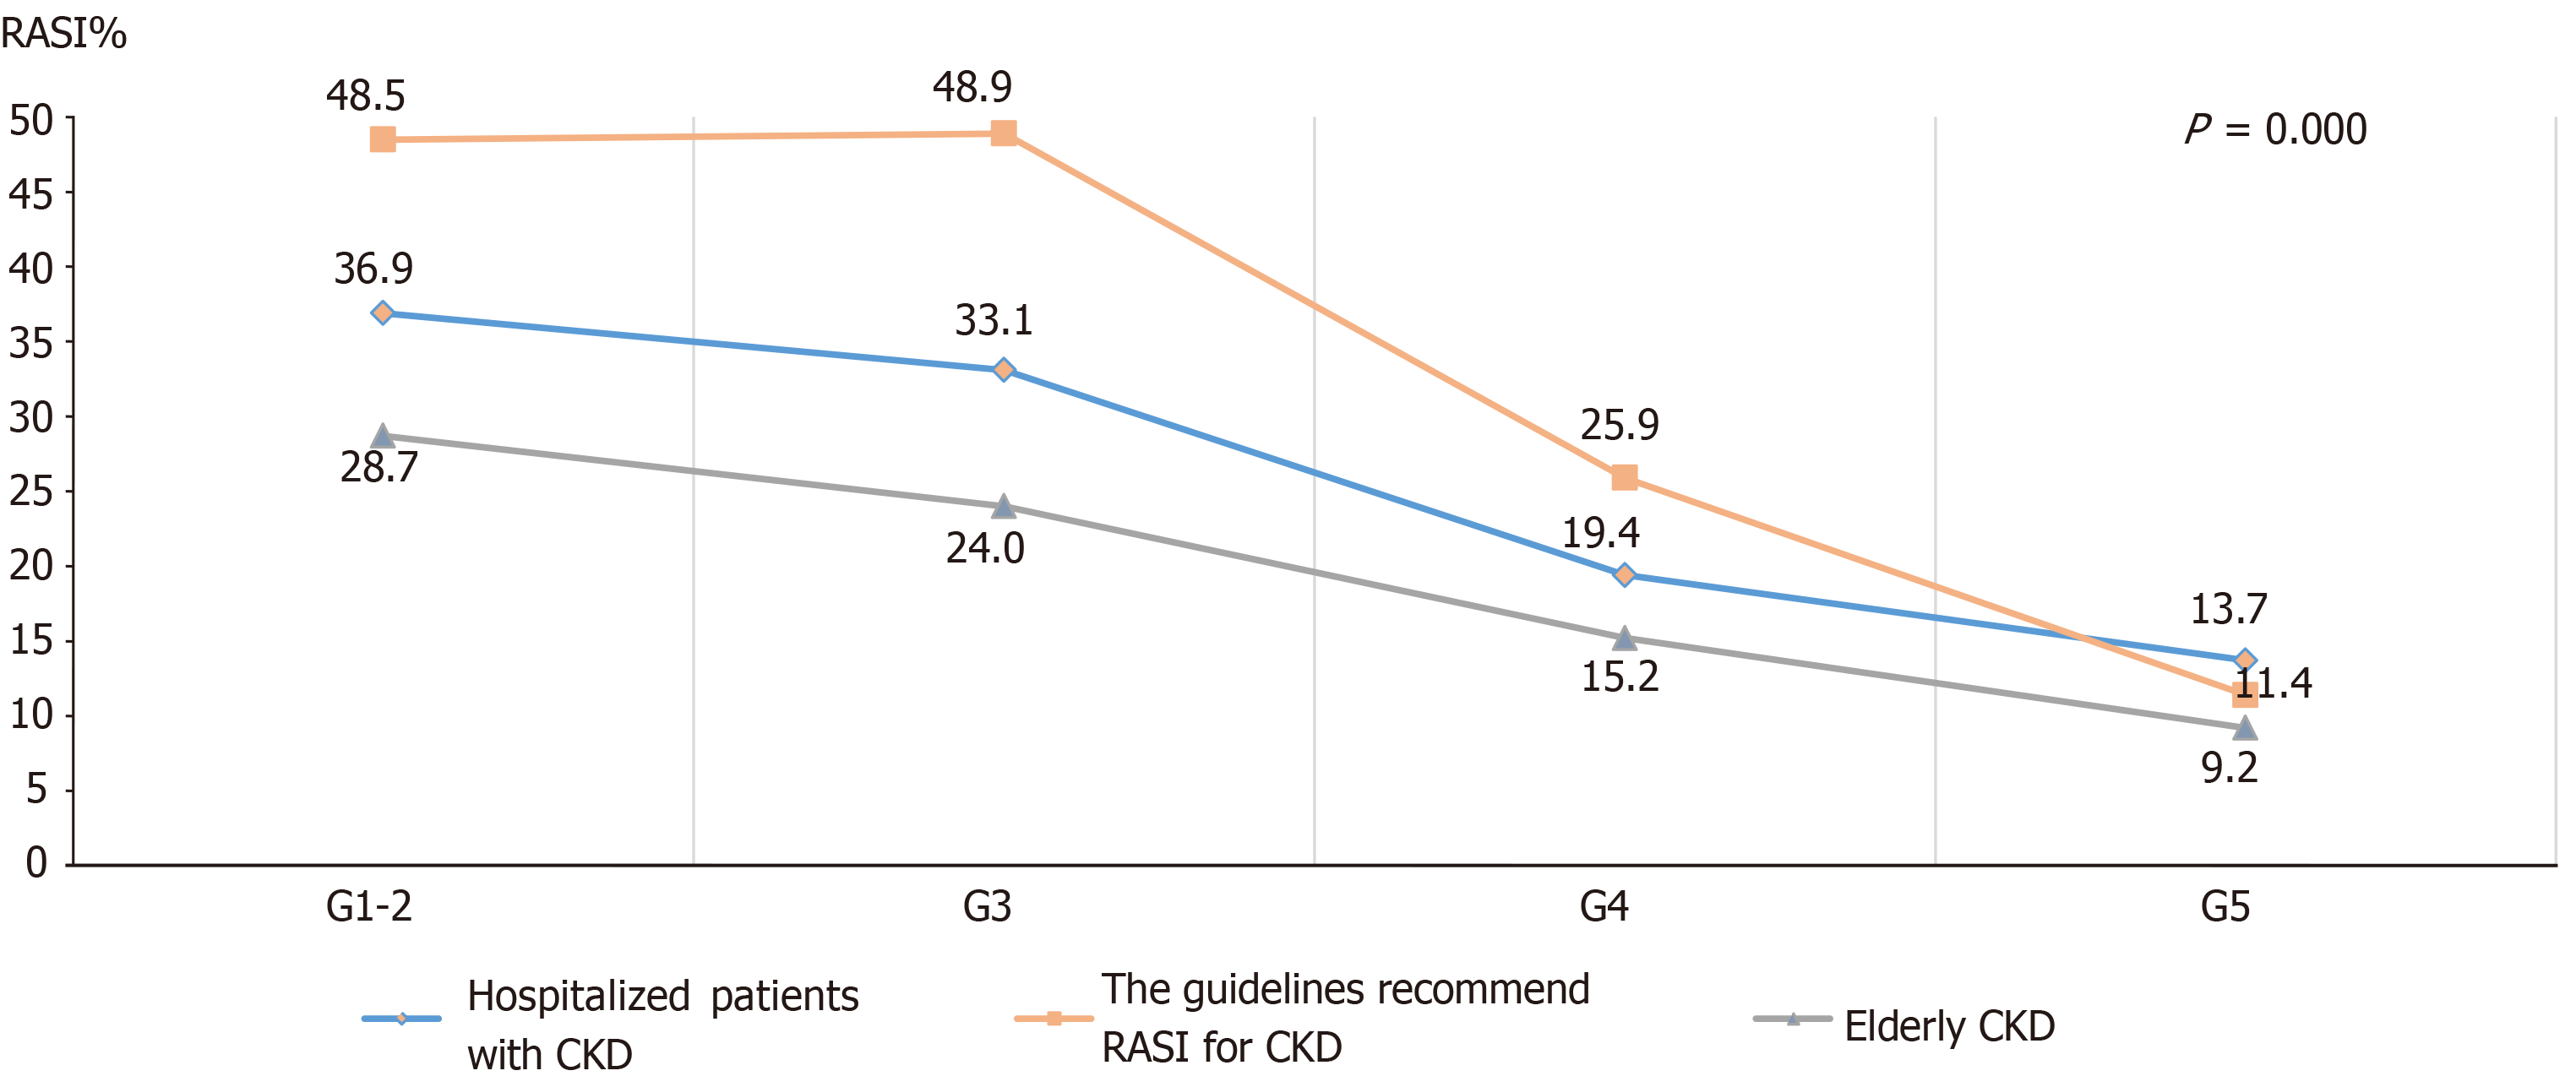
Figure 7 Comparisons of renin-angiotensin system inhibitors prescriptions among patients with different chronic kidney disease stages, in all patients included in the analysis, guideline-recommended patients, and elderly patients.
CKD: Chronic kidney disease; RASI: Renin-angiotensin system inhibitors.
- Citation: Zhang C, Duan ZY, Nie SS, Zhang Z, Guo XR, Zhang CY, Dong J, Cai GY. Renin-angiotensin system inhibitors prescriptions in Chinese hospitalized chronic kidney disease patients. World J Clin Cases 2024; 12(17): 3061-3075
- URL: https://www.wjgnet.com/2307-8960/full/v12/i17/3061.htm
- DOI: https://dx.doi.org/10.12998/wjcc.v12.i17.3061


