Copyright
©The Author(s) 2024.
World J Clin Cases. Jun 6, 2024; 12(16): 2876-2880
Published online Jun 6, 2024. doi: 10.12998/wjcc.v12.i16.2876
Published online Jun 6, 2024. doi: 10.12998/wjcc.v12.i16.2876
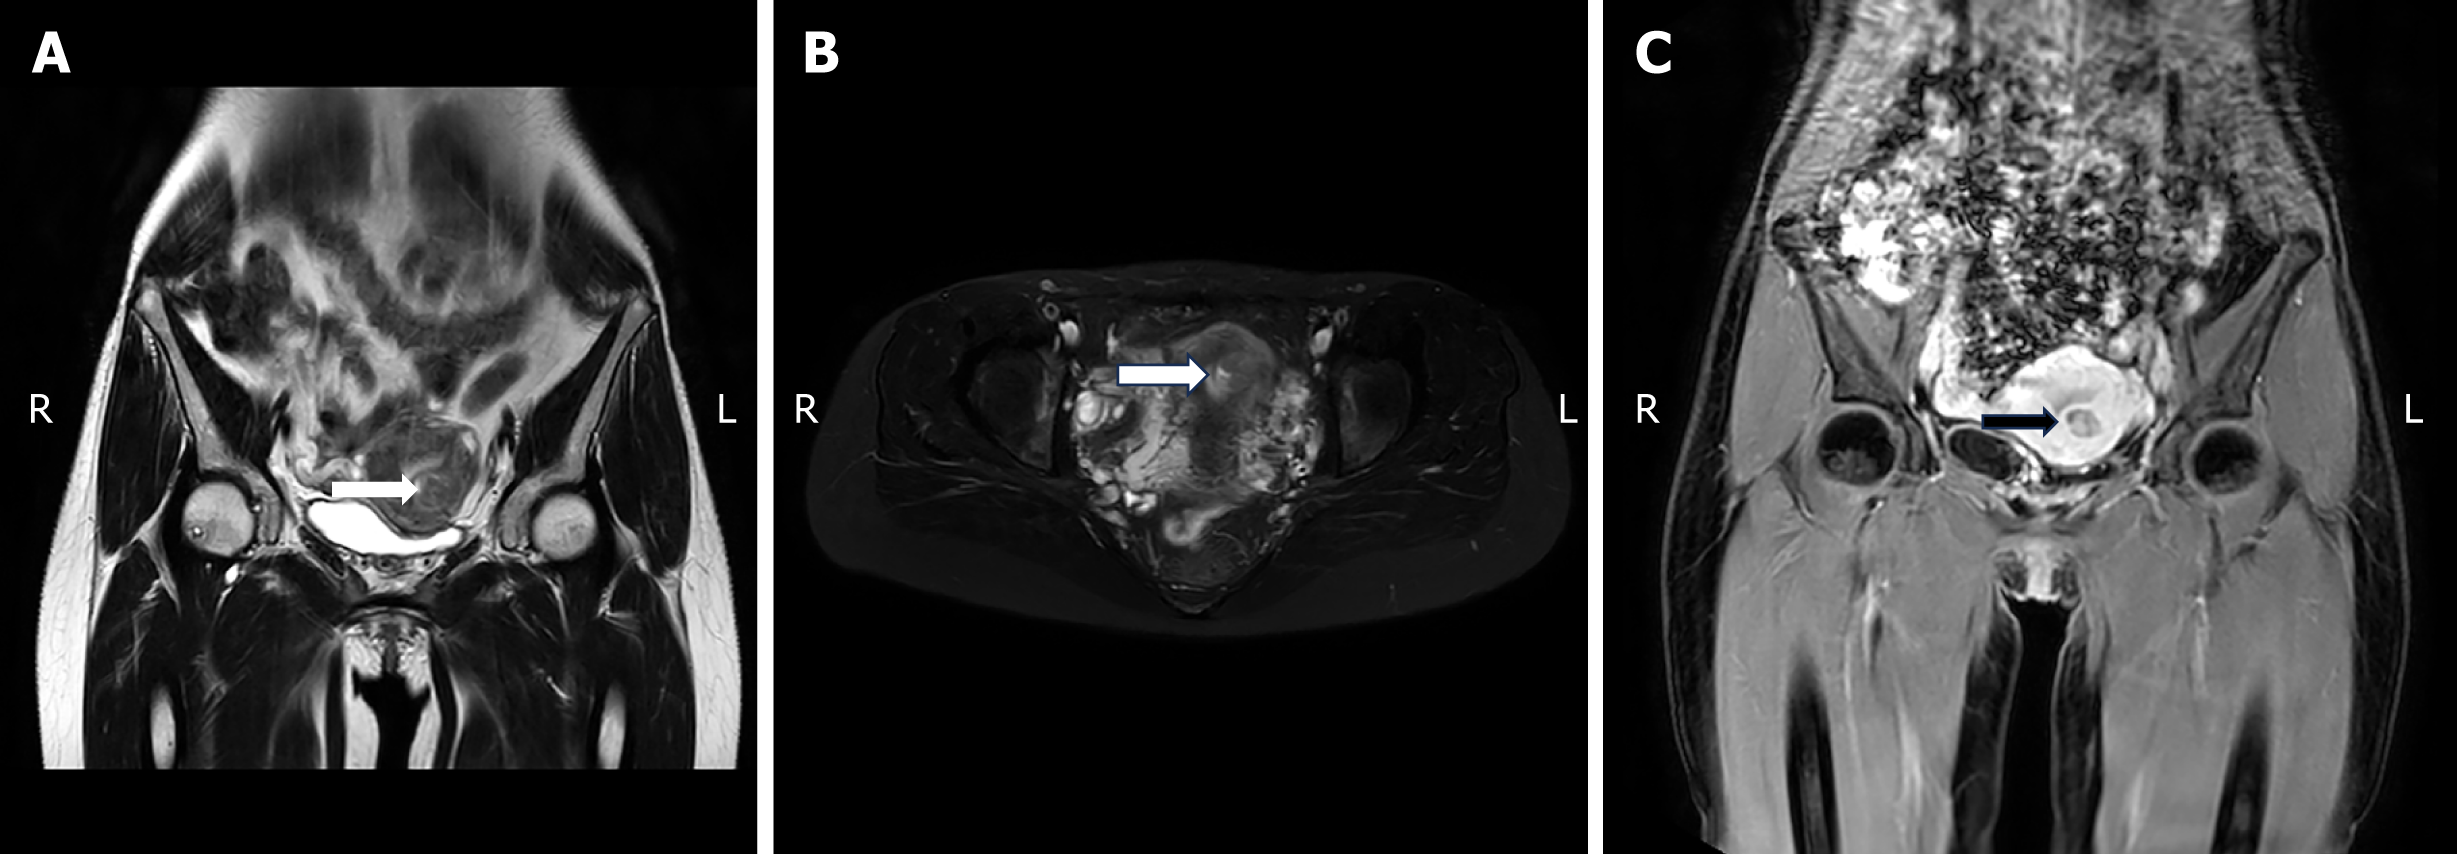
Figure 1 Magnetic resonance imaging of the uterine epithelioid trophoblastic tumor.
A: T2 weighted image (T2WI) coronal view of a mixed T2WI iso-signal nodular mass (arrow) in the myometrium of the left anterior wall of the uterus with local protrusion into the uterine cavity; B: T2WI pectral attenuated onversion recovery (SPAIR) in axial position with a mixed iso-signal mass (arrow); C: T1 weighted image SPAIR-enhanced coronal view with an inhomogeneous enhancement of the mass (arrow).
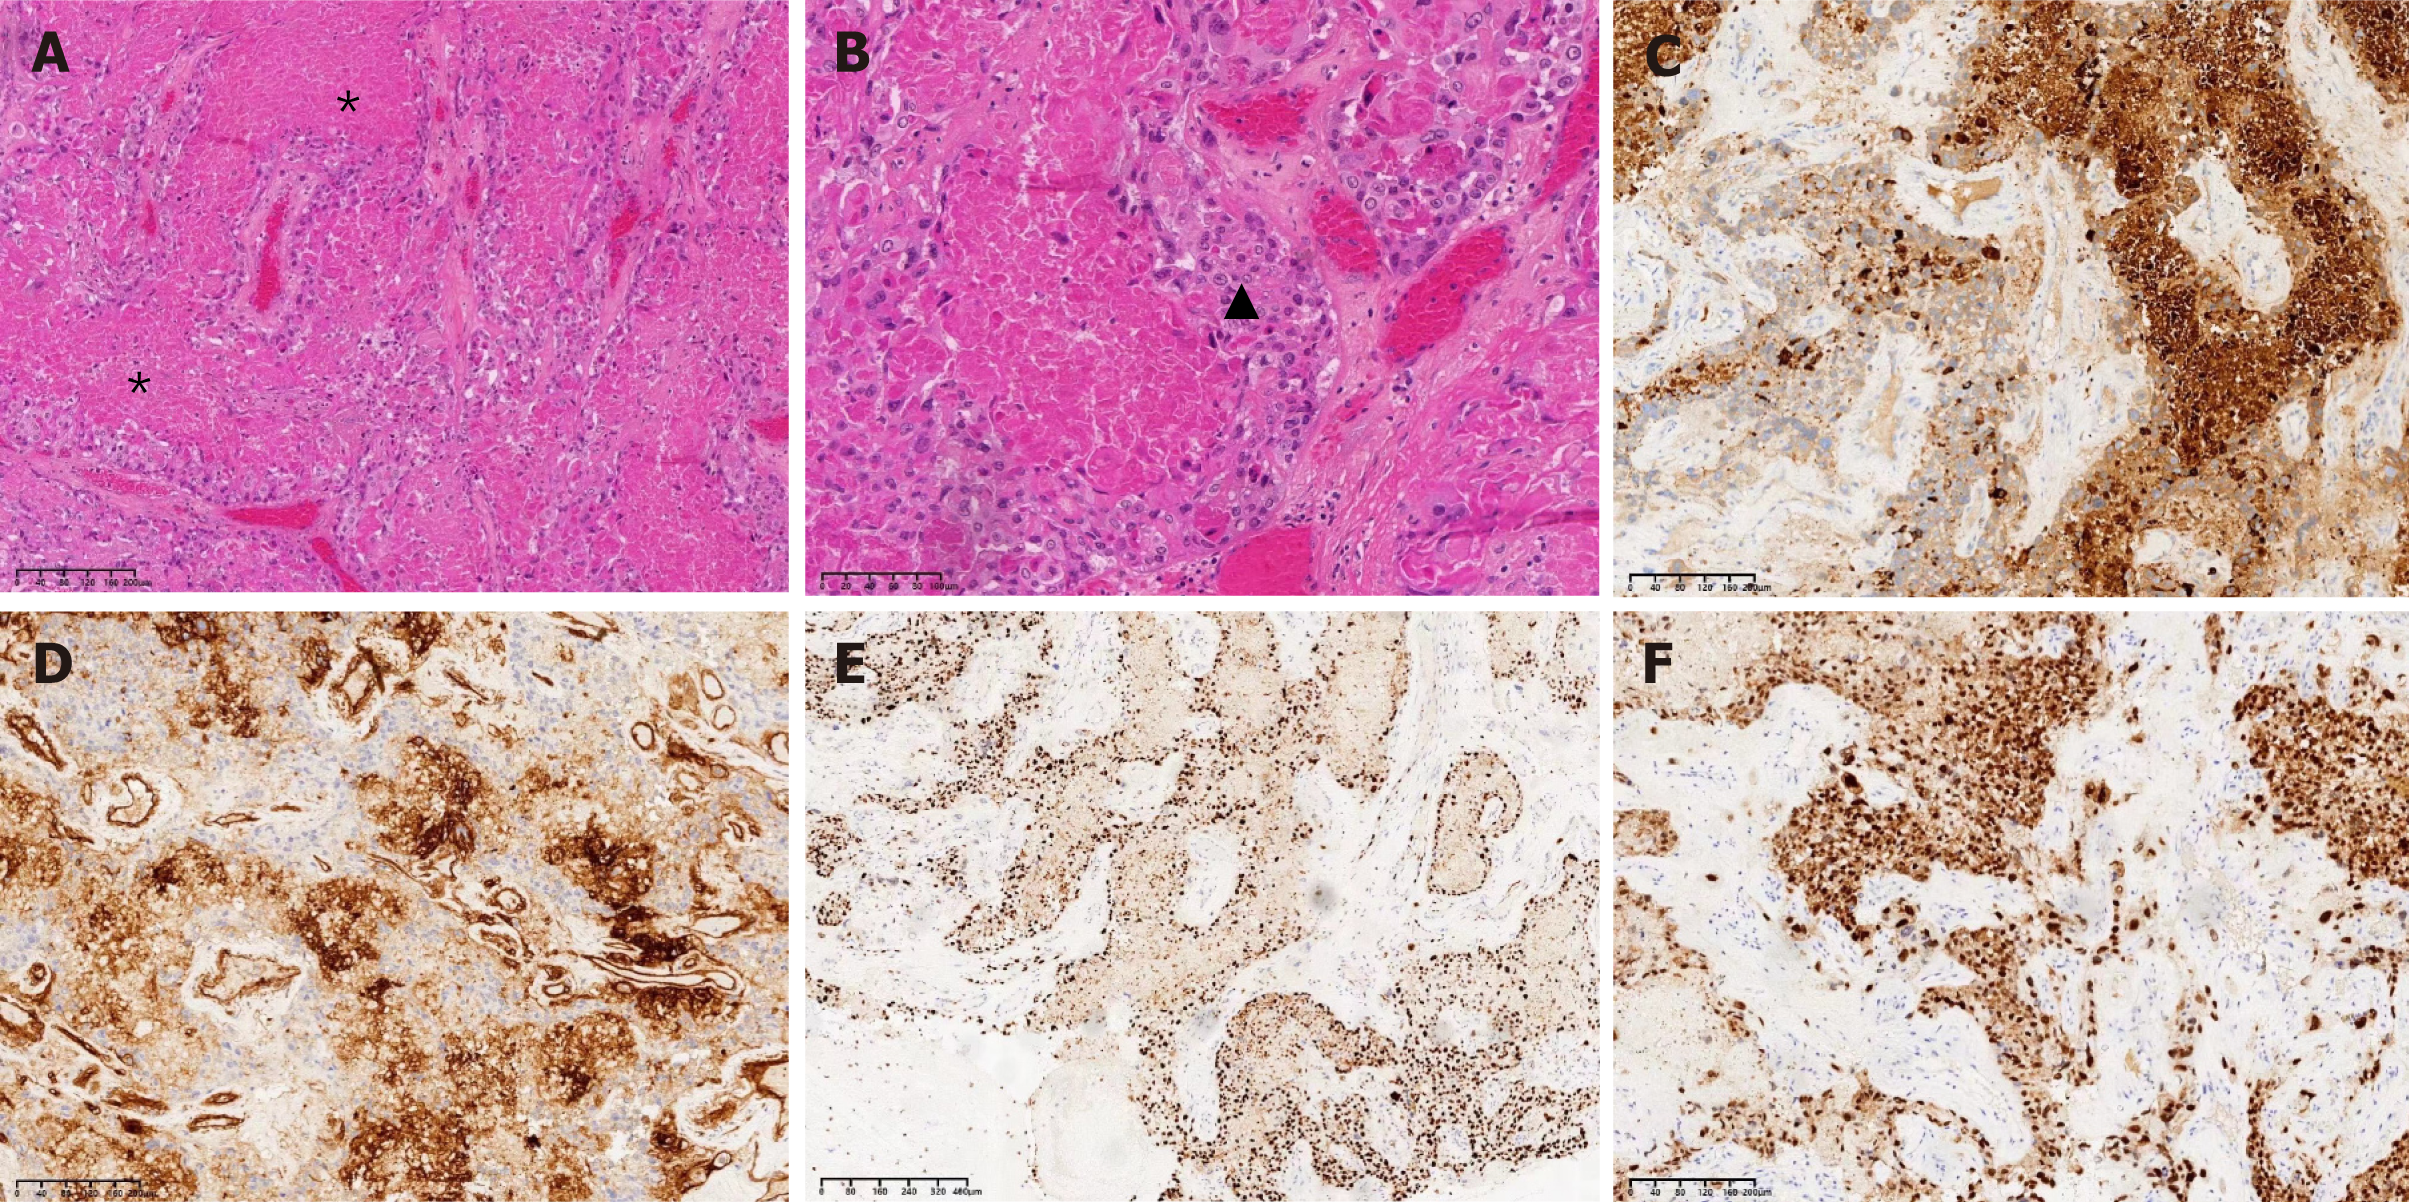
Figure 2 Immunohistochemical findings of uterine epithelioid trophoblastic tumor.
A: Hematoxylin and eosin (HE) (× 10), the tumor cells were arranged in nested clusters, and a large map-like necrosis was seen in the center of the neoplastic nests, marked with an asterisk; B: HE (× 20), most of the tumor cells were uniform in size and showed epithelial-like morphology (black triangle): The cells were polygonal with clear borders, abundant cytoplasm, and eosinophilic, clear cell membrane, rounded and centered nuclei with obvious small nucleoli, and occasional nuclear fission images; C: Immunohistochemistry (IHC) (× 10), tumor cells express β-human chorionic gonadotropin; D: IHC (× 10), tumor cells expressed α-inhibin; E: IHC (× 5), tumor cells expressed p63; F: IHC (× 10), tumor cells Ki-67 proliferation index was about 60%.
- Citation: Huang LN, Deng X, Xu J. Uterine epithelioid trophoblastic tumor with the main manifestation of increased human chorionic gonadotropin: A case report. World J Clin Cases 2024; 12(16): 2876-2880
- URL: https://www.wjgnet.com/2307-8960/full/v12/i16/2876.htm
- DOI: https://dx.doi.org/10.12998/wjcc.v12.i16.2876


