Copyright
©The Author(s) 2024.
World J Clin Cases. May 6, 2024; 12(13): 2243-2247
Published online May 6, 2024. doi: 10.12998/wjcc.v12.i13.2243
Published online May 6, 2024. doi: 10.12998/wjcc.v12.i13.2243
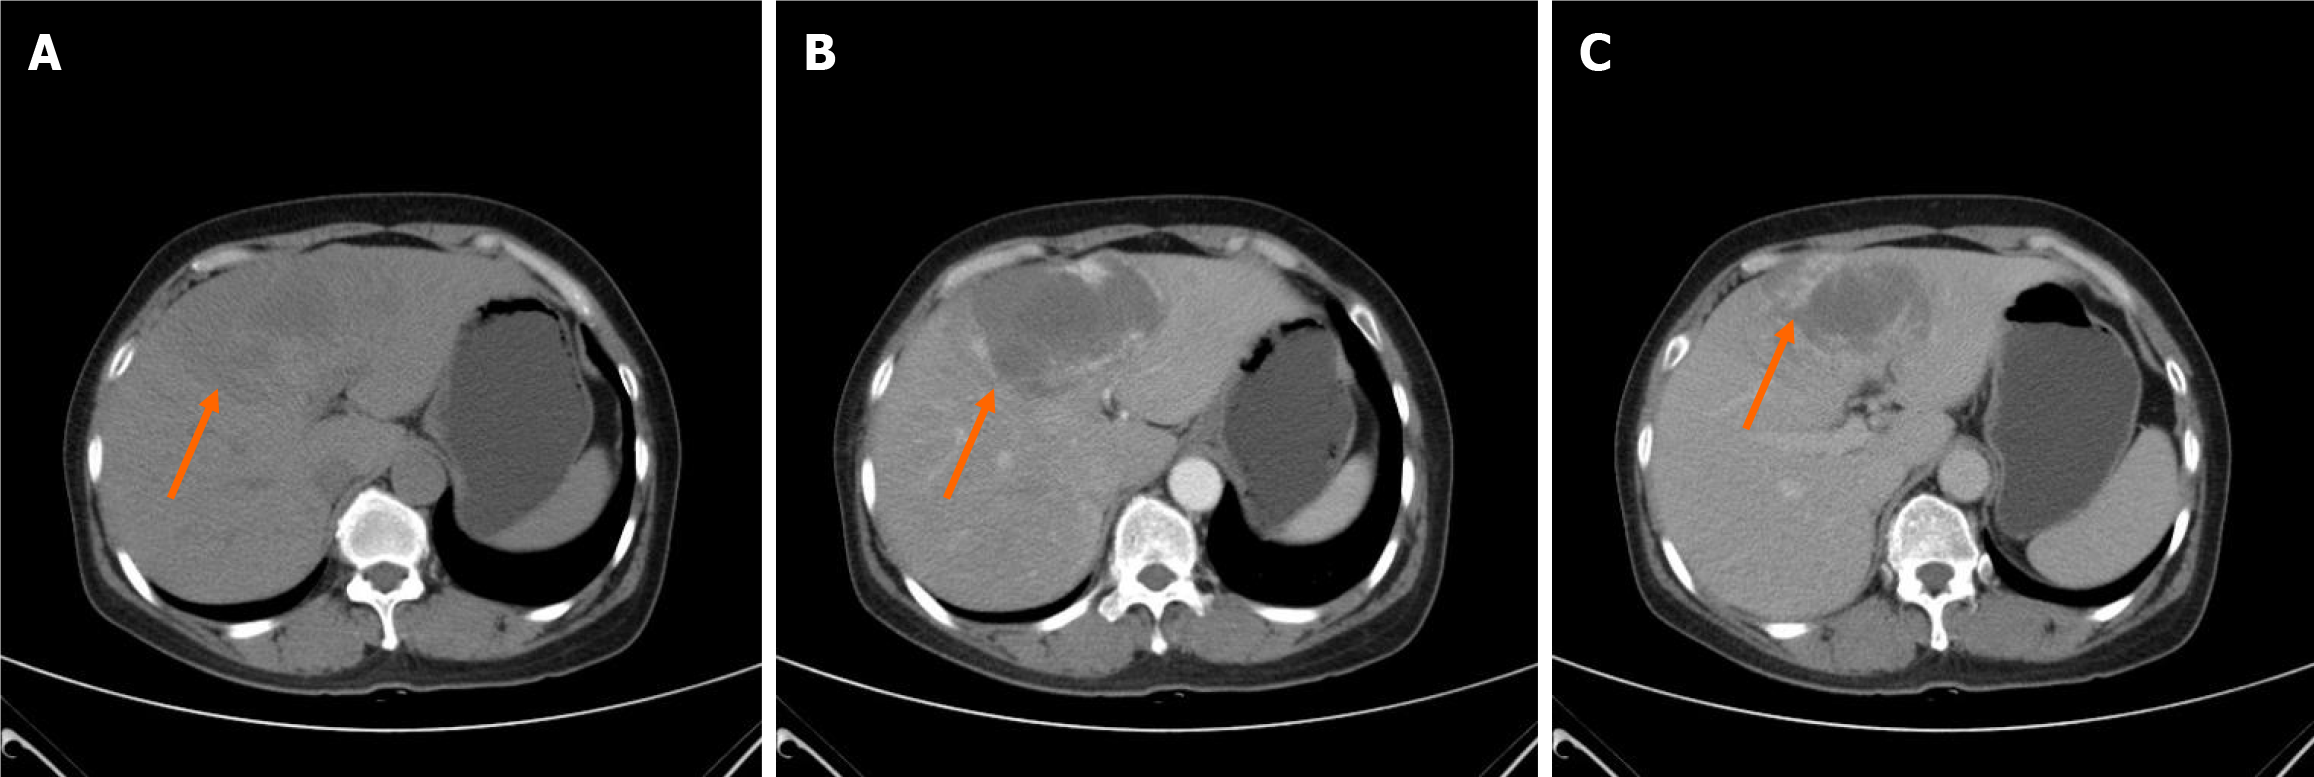
Figure 1 Abdominal computed tomography pre-operation showed a slightly low intensity mass of 10.
0 cm × 7.0 cm (orange arrow) was seen in the left liver lobe on plain computed tomography with peripheral nodular enhancement in the arterial phase and gradual fill-in in the delayed phase. A: Plain computed tomography; B: The arterial phase; C: The delayed phase.
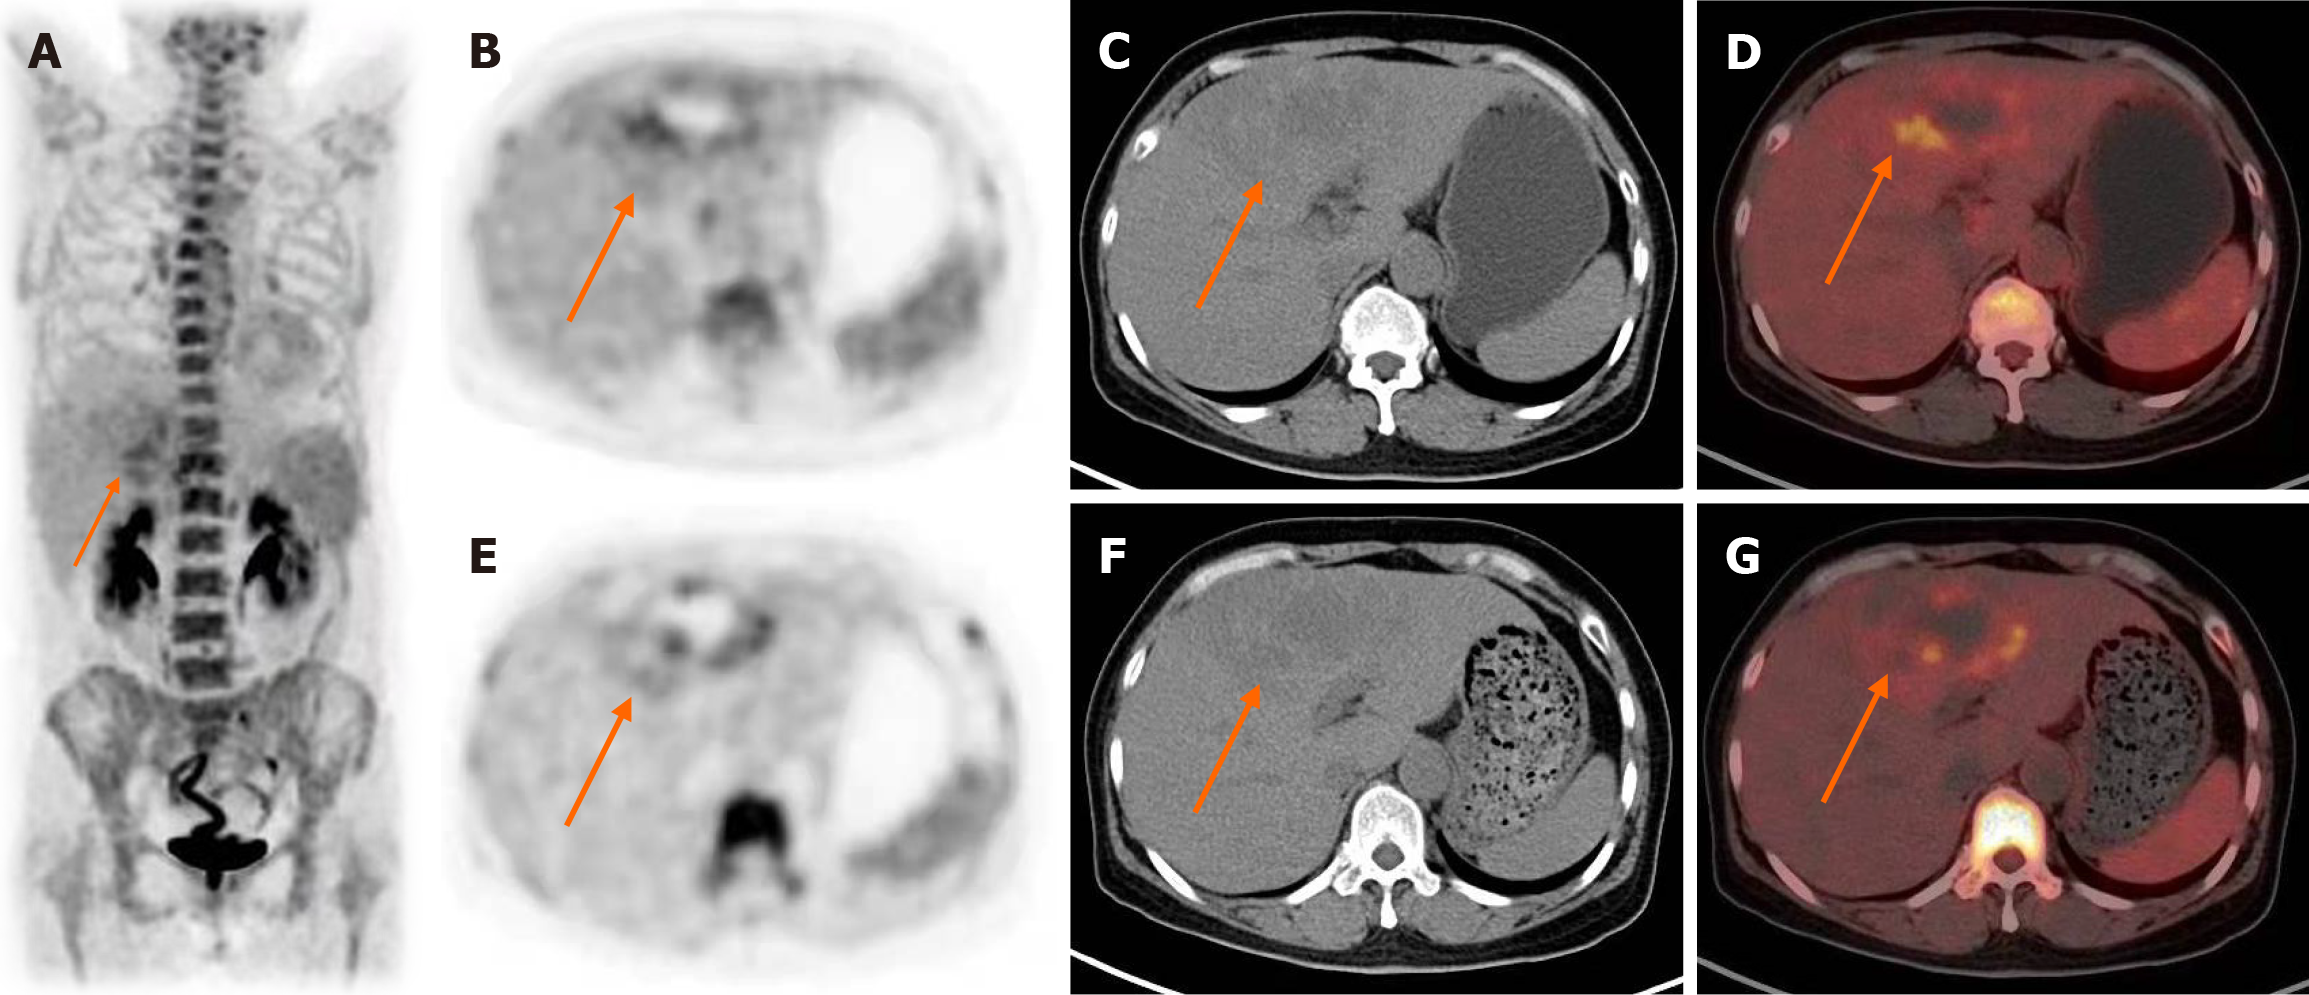
Figure 2 18F-Fluordesoxyglucose positron emission tomography/computed tomography pre-operation showed the liver lesion (orange arrow) with peripheral fluorodeoxyglucose accumulation (SUVmax 3.
5) higher than that of the normal liver parenchyma (SUVmax 1.6) surrounds a hypoactive area. A: Whole body 18F-Fluordesoxyglucose positron emission tomography; B and E: Axial positron emission tomography; C and F: Computed tomography; D and G: Combined positron emission tomography/computed tomography slices.
Figure 3 The result of histopathological examination.
Hematoxylin and Eosin staining showed numerous dilated blood vessels adjacent to hepatocytes with fatty cell (orange arrow). A: Under low magnification (× 40); B: Under high magnification (× 100).
- Citation: Hu YA, Guo YX, Huang QF. Rim 18F-fluorodeoxyglucose uptake of hepatic cavernous hemangioma on positron emission tomography/computed tomography: A case report. World J Clin Cases 2024; 12(13): 2243-2247
- URL: https://www.wjgnet.com/2307-8960/full/v12/i13/2243.htm
- DOI: https://dx.doi.org/10.12998/wjcc.v12.i13.2243


