Copyright
©The Author(s) 2024.
World J Clin Cases. Apr 26, 2024; 12(12): 2050-2055
Published online Apr 26, 2024. doi: 10.12998/wjcc.v12.i12.2050
Published online Apr 26, 2024. doi: 10.12998/wjcc.v12.i12.2050
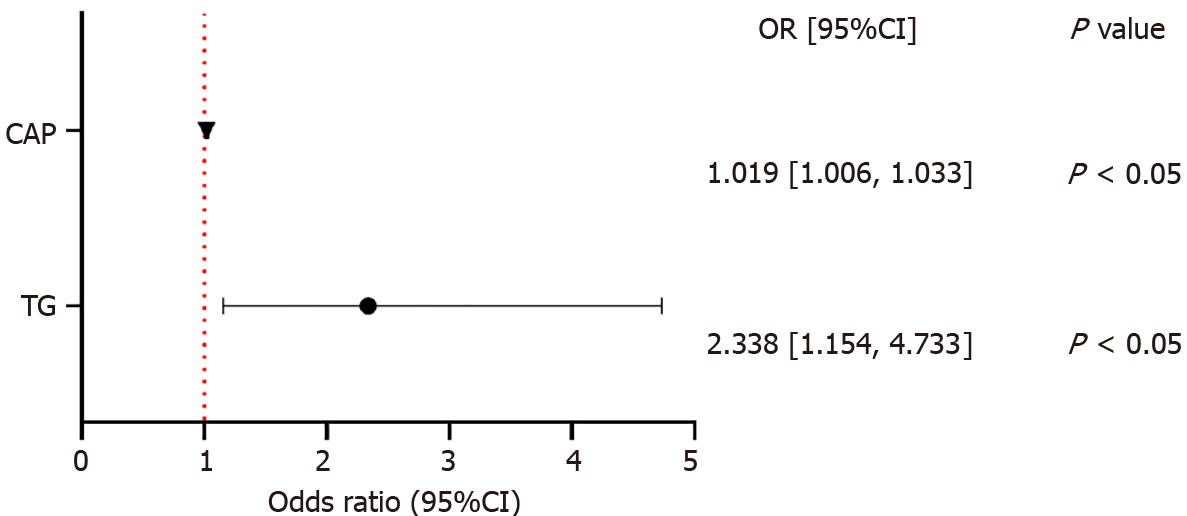
Figure 1 Forest plot of risk factors for colorectal polyps.
The distance between the left and right of each plot represents the confidence interval (CI); the triangle represents the liver-controlled attenuation parameter for colorectal polyps, with an odds ratio of 1.019 (95%CI: 1.006-1.033), P < 0.05; the dot represents the triglyceride for colorectal polyps with an odds ratio of 2.338 (95%CI: 1.154-4.733), P < 0.05. CI: Confidence interval; TG: Triglyceride; CAP: Controlled attenuation parameter.
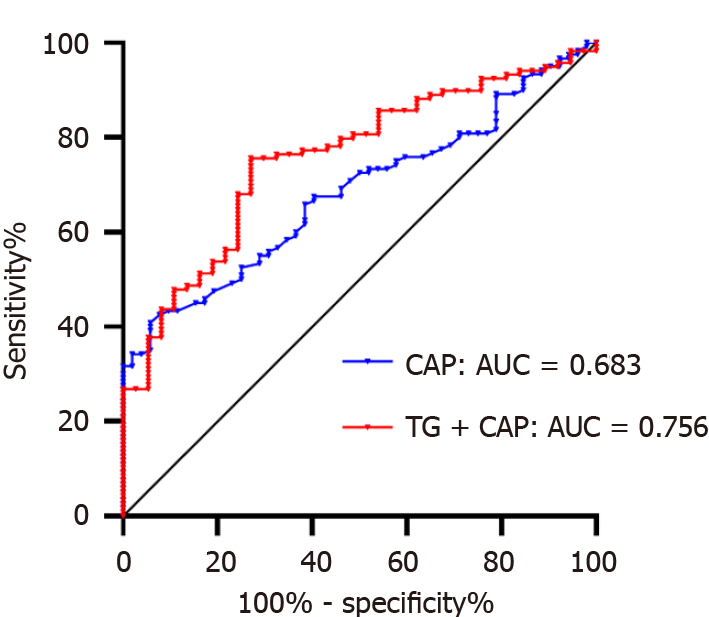
Figure 2 Comparison of the receiver operating characteristic curves of the controlled attenuation parameter and triglyceride combined with controlled attenuation parameter in the diagnosis of colorectal polyps.
The red broken line represents the triglyceride (TG) + controlled attenuation parameter (CAP) for the diagnosis of colorectal polyps, with an area under the curve (AUC) of 0.756, a sensitivity of 0.731, a specificity of 0.694, and a cutoff value of 0.704; the blue broken line represents the CAP for the diagnosis of colorectal polyps, with an AUC of 0.683, a sensitivity of 0.408, a specificity of 0.942, and a cutoff value of 291 db/m. ROC: The receiver operating characteristic curve; TG: Triglyceride; CAP: Controlled attenuation parameter; AUC: area under curve.
- Citation: Wang L, Li YF, Dong LF. Transient elastography with controlled attenuation parameter for the diagnosis of colorectal polyps in patients with nonalcoholic fatty liver disease. World J Clin Cases 2024; 12(12): 2050-2055
- URL: https://www.wjgnet.com/2307-8960/full/v12/i12/2050.htm
- DOI: https://dx.doi.org/10.12998/wjcc.v12.i12.2050


