Copyright
©The Author(s) 2023.
World J Clin Cases. Mar 6, 2023; 11(7): 1560-1568
Published online Mar 6, 2023. doi: 10.12998/wjcc.v11.i7.1560
Published online Mar 6, 2023. doi: 10.12998/wjcc.v11.i7.1560
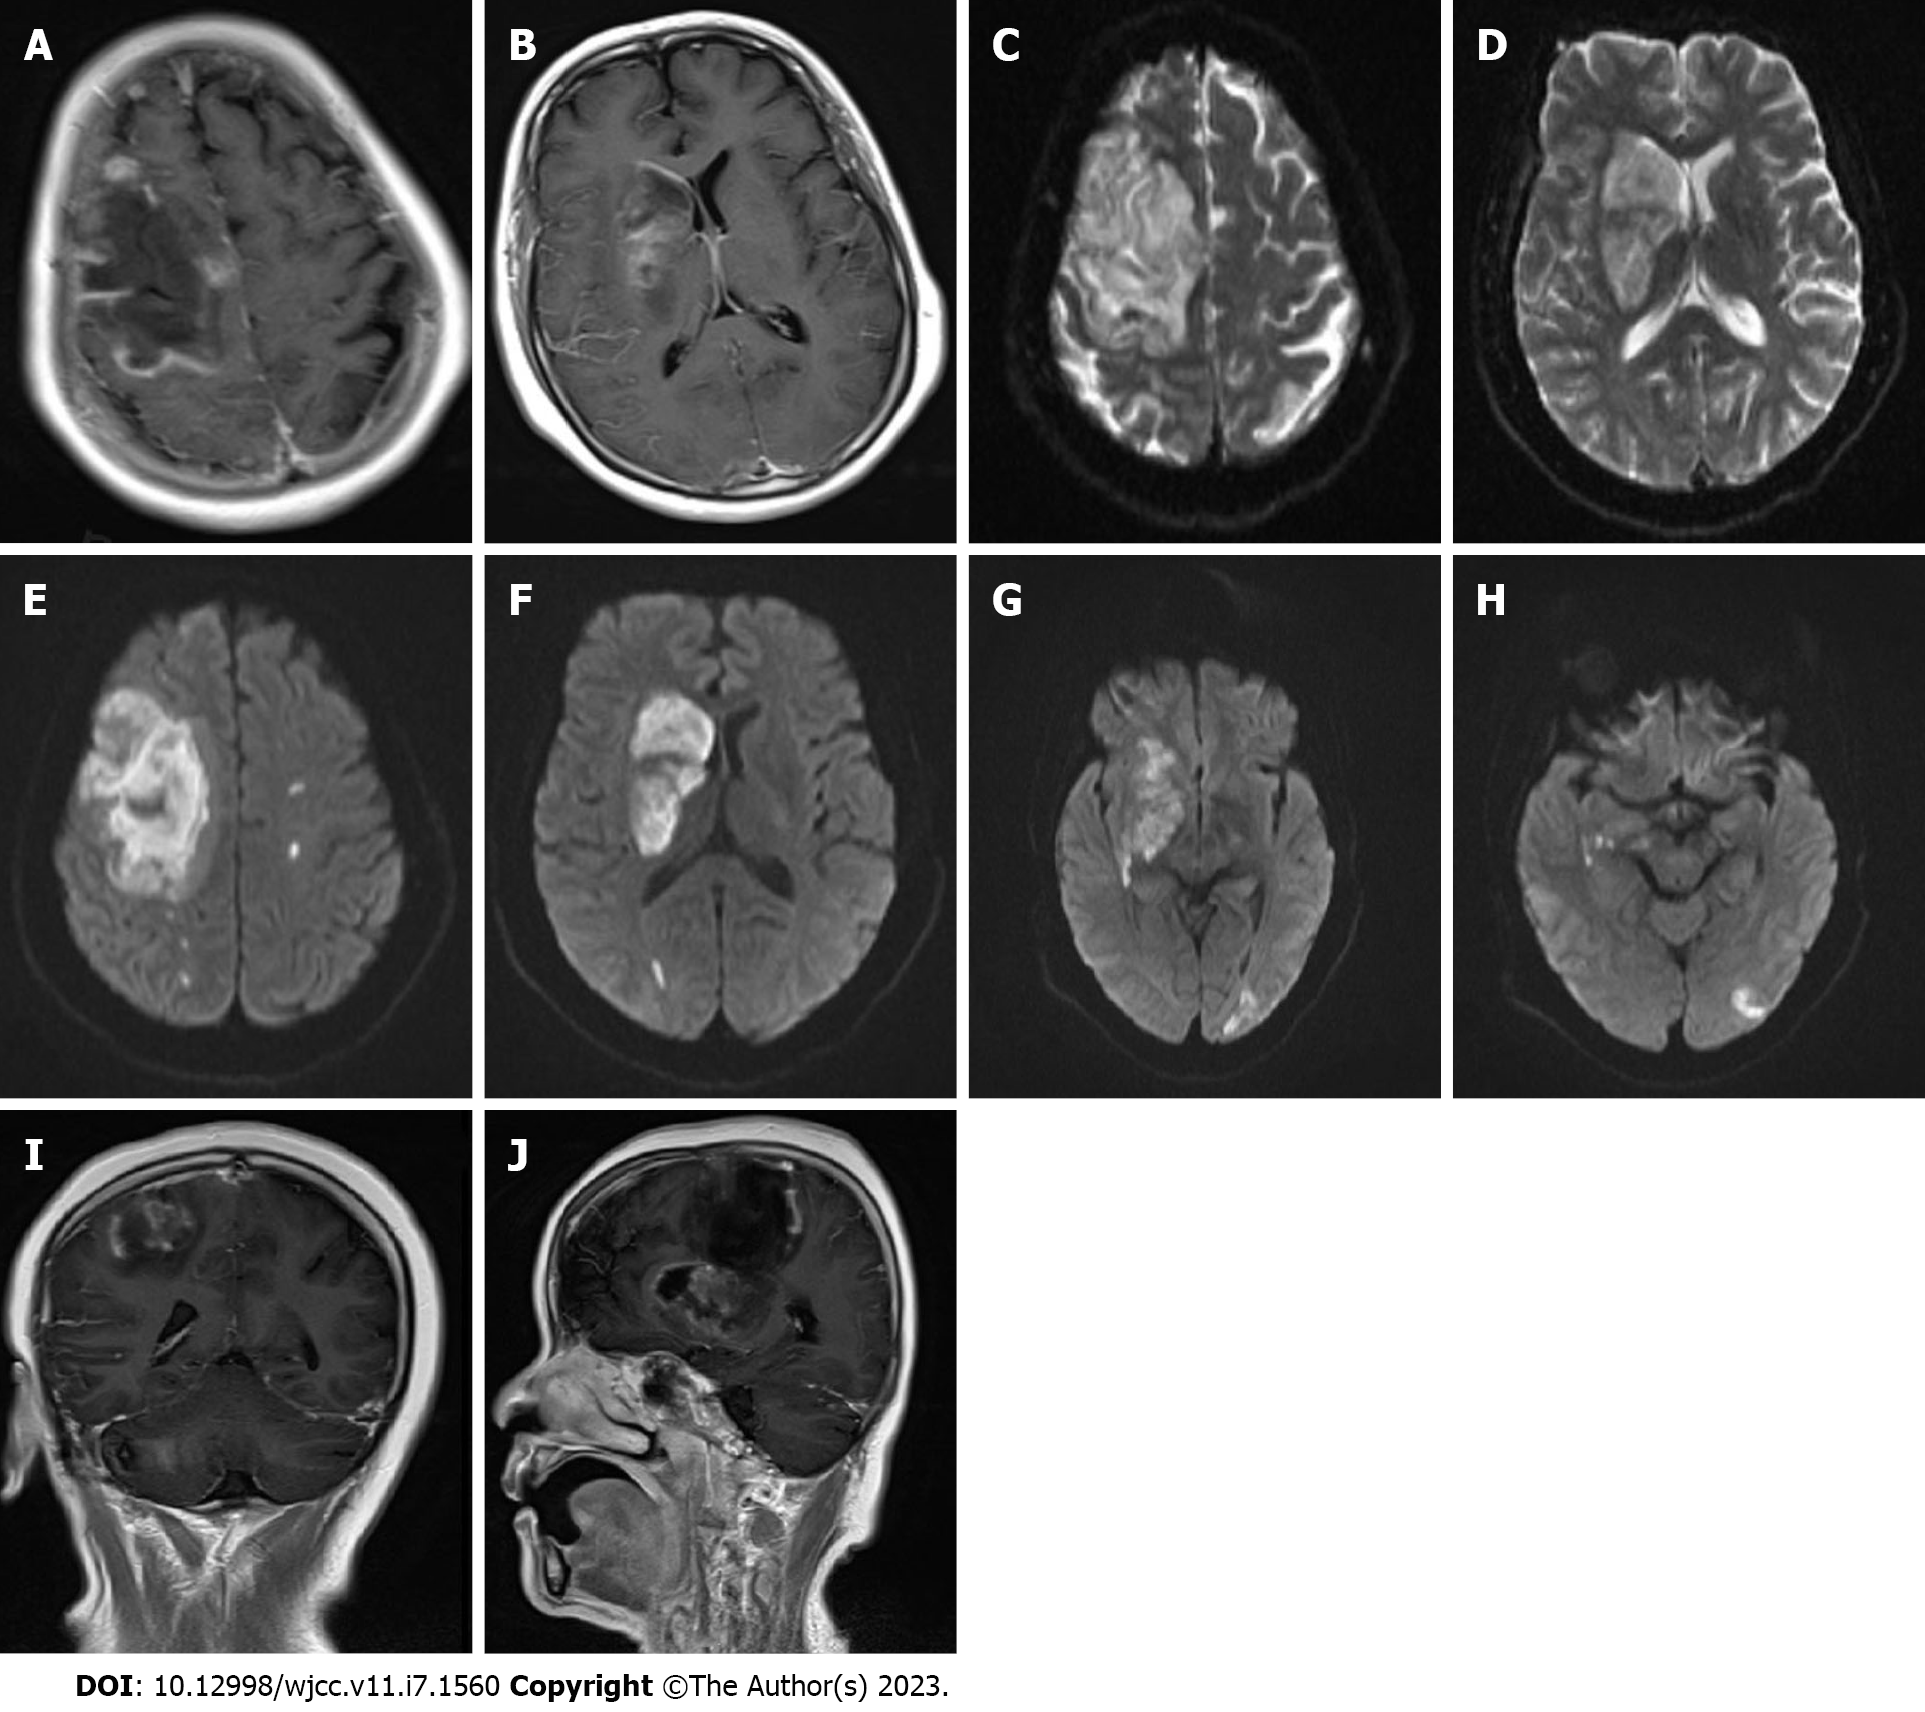
Figure 1 Head magnetic resonance imaging findings.
A-D: In the right frontal lobes and basal ganglia, large-scale abnormal signal lesions were found with low signal on T1-weighted imaging and slightly higher signal on T2-weighted imaging; E-H: Diffusion-weighted imaging signals were enhanced in the right frontal lobe and right basal ganglia, and multiple spotted high signals were observed in the left hemisphere; I and J: After enhancement, no ring enhancement was observed around the lesion, and there was no obvious space-occupying effect.
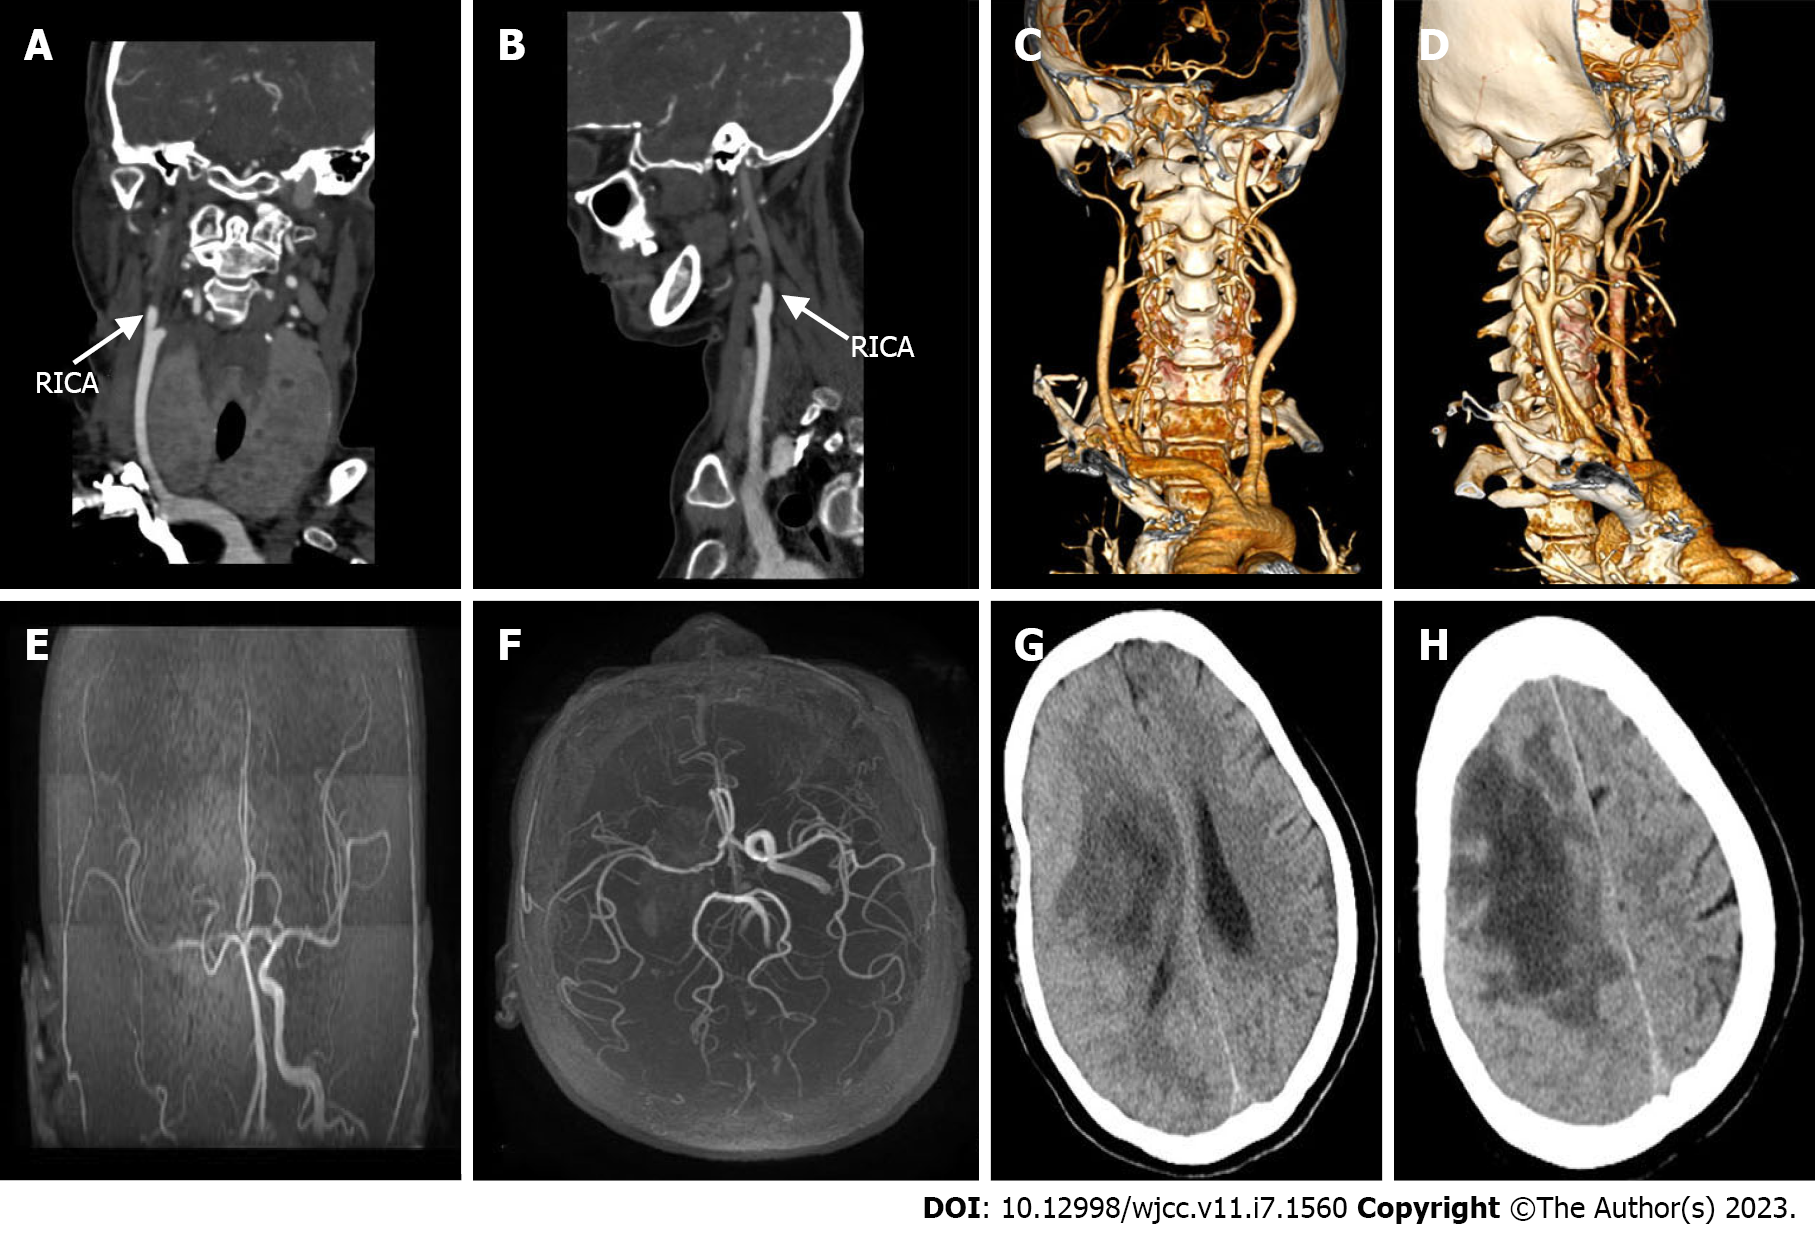
Figure 2 Vascular examination and head computed tomography review.
A-D: The right internal carotid artery was occluded, and the distal end was not shown. No obvious abnormalities were observed in the left carotid artery and vertebral artery; E and F: The right internal carotid artery skull base and intracranial segment were occluded, and the anterior and posterior cerebral arteries were supplied by the traffic branch; G and H: The right frontal lobe and basal ganglia showed lamellar low-density shadows, most of which tended to be liquid density, the right lateral ventricle was slightly stressed, and the midline was shifted to the left. RICA: Right internal carotid artery.
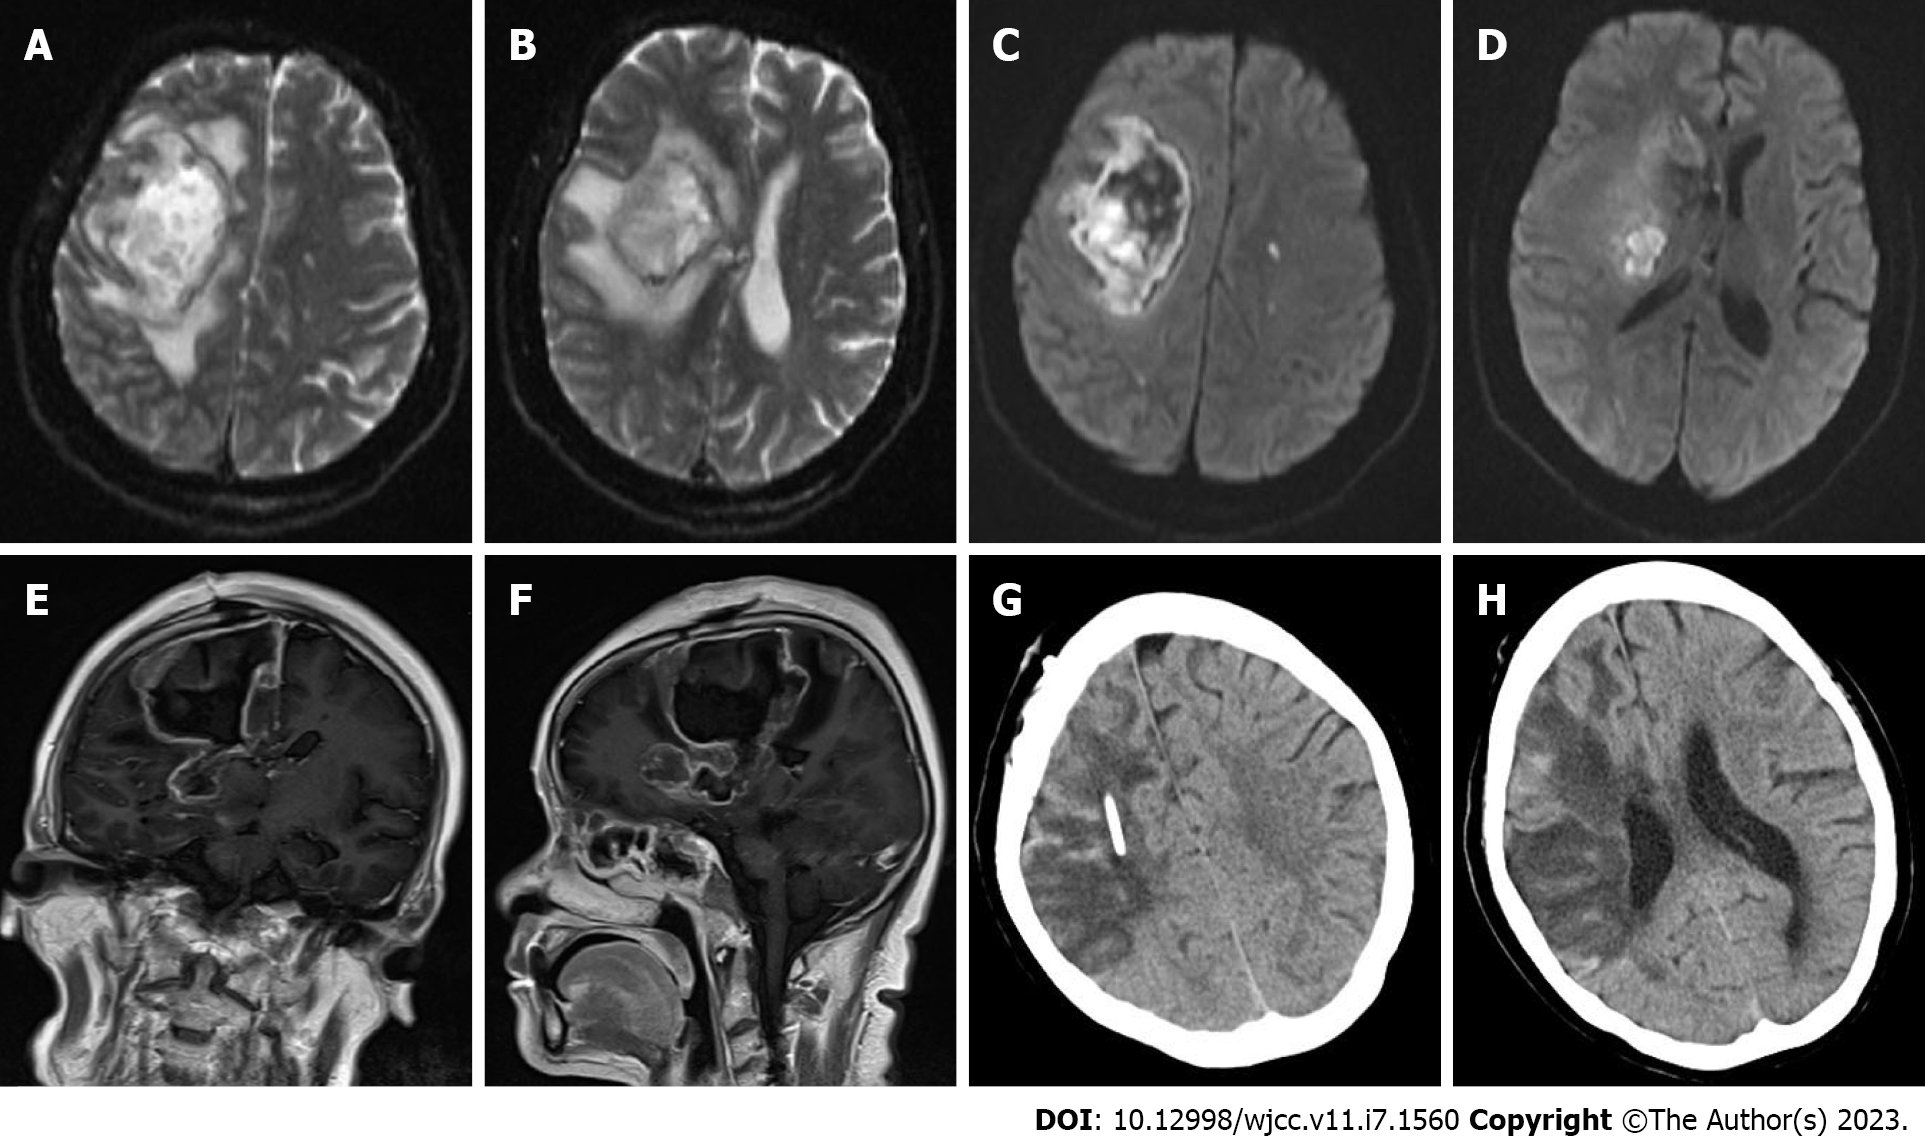
Figure 3 Head magnetic resonance imaging and postoperative head computed tomography review.
A-D: Flaky T2 mixed signal was observed in the right frontal lobe and basal ganglia, there was a mixed signal on diffusion-weighted imaging (DWI), and the right lateral ventricle was compressed. In the left cerebral hemisphere, multiple long T2 signals were observed, some of which were high on DWI, and the midline was shifted to the left; E and F: After enhancement, partial ring enhancement was observed; G and H: On the 10th d after the brain lesion resection, repeat head computed tomography showed a large low-density shadow, and the midline returned to normal.
Figure 4 Histopathological examination findings.
A and B: Hematoxylin-eosin staining (100 and 400 × magnification) showed a large area of necrotic brain tissue, focal suppurative inflammation, and a blood vessel infiltrated by non-septate hyphae (black arrows); C: Periodic acid-silver methenamine staining (400 × magnification) showed sporangium, characteristic of Mucorales fungi (black arrows); D: Periodic acid-Schiff staining (400 × magnification) showed multiple broad hyphae.
- Citation: Chen CH, Chen JN, Du HG, Guo DL. Isolated cerebral mucormycosis that looks like stroke and brain abscess: A case report and review of the literature. World J Clin Cases 2023; 11(7): 1560-1568
- URL: https://www.wjgnet.com/2307-8960/full/v11/i7/1560.htm
- DOI: https://dx.doi.org/10.12998/wjcc.v11.i7.1560


