Copyright
©The Author(s) 2023.
World J Clin Cases. Feb 16, 2023; 11(5): 1165-1174
Published online Feb 16, 2023. doi: 10.12998/wjcc.v11.i5.1165
Published online Feb 16, 2023. doi: 10.12998/wjcc.v11.i5.1165
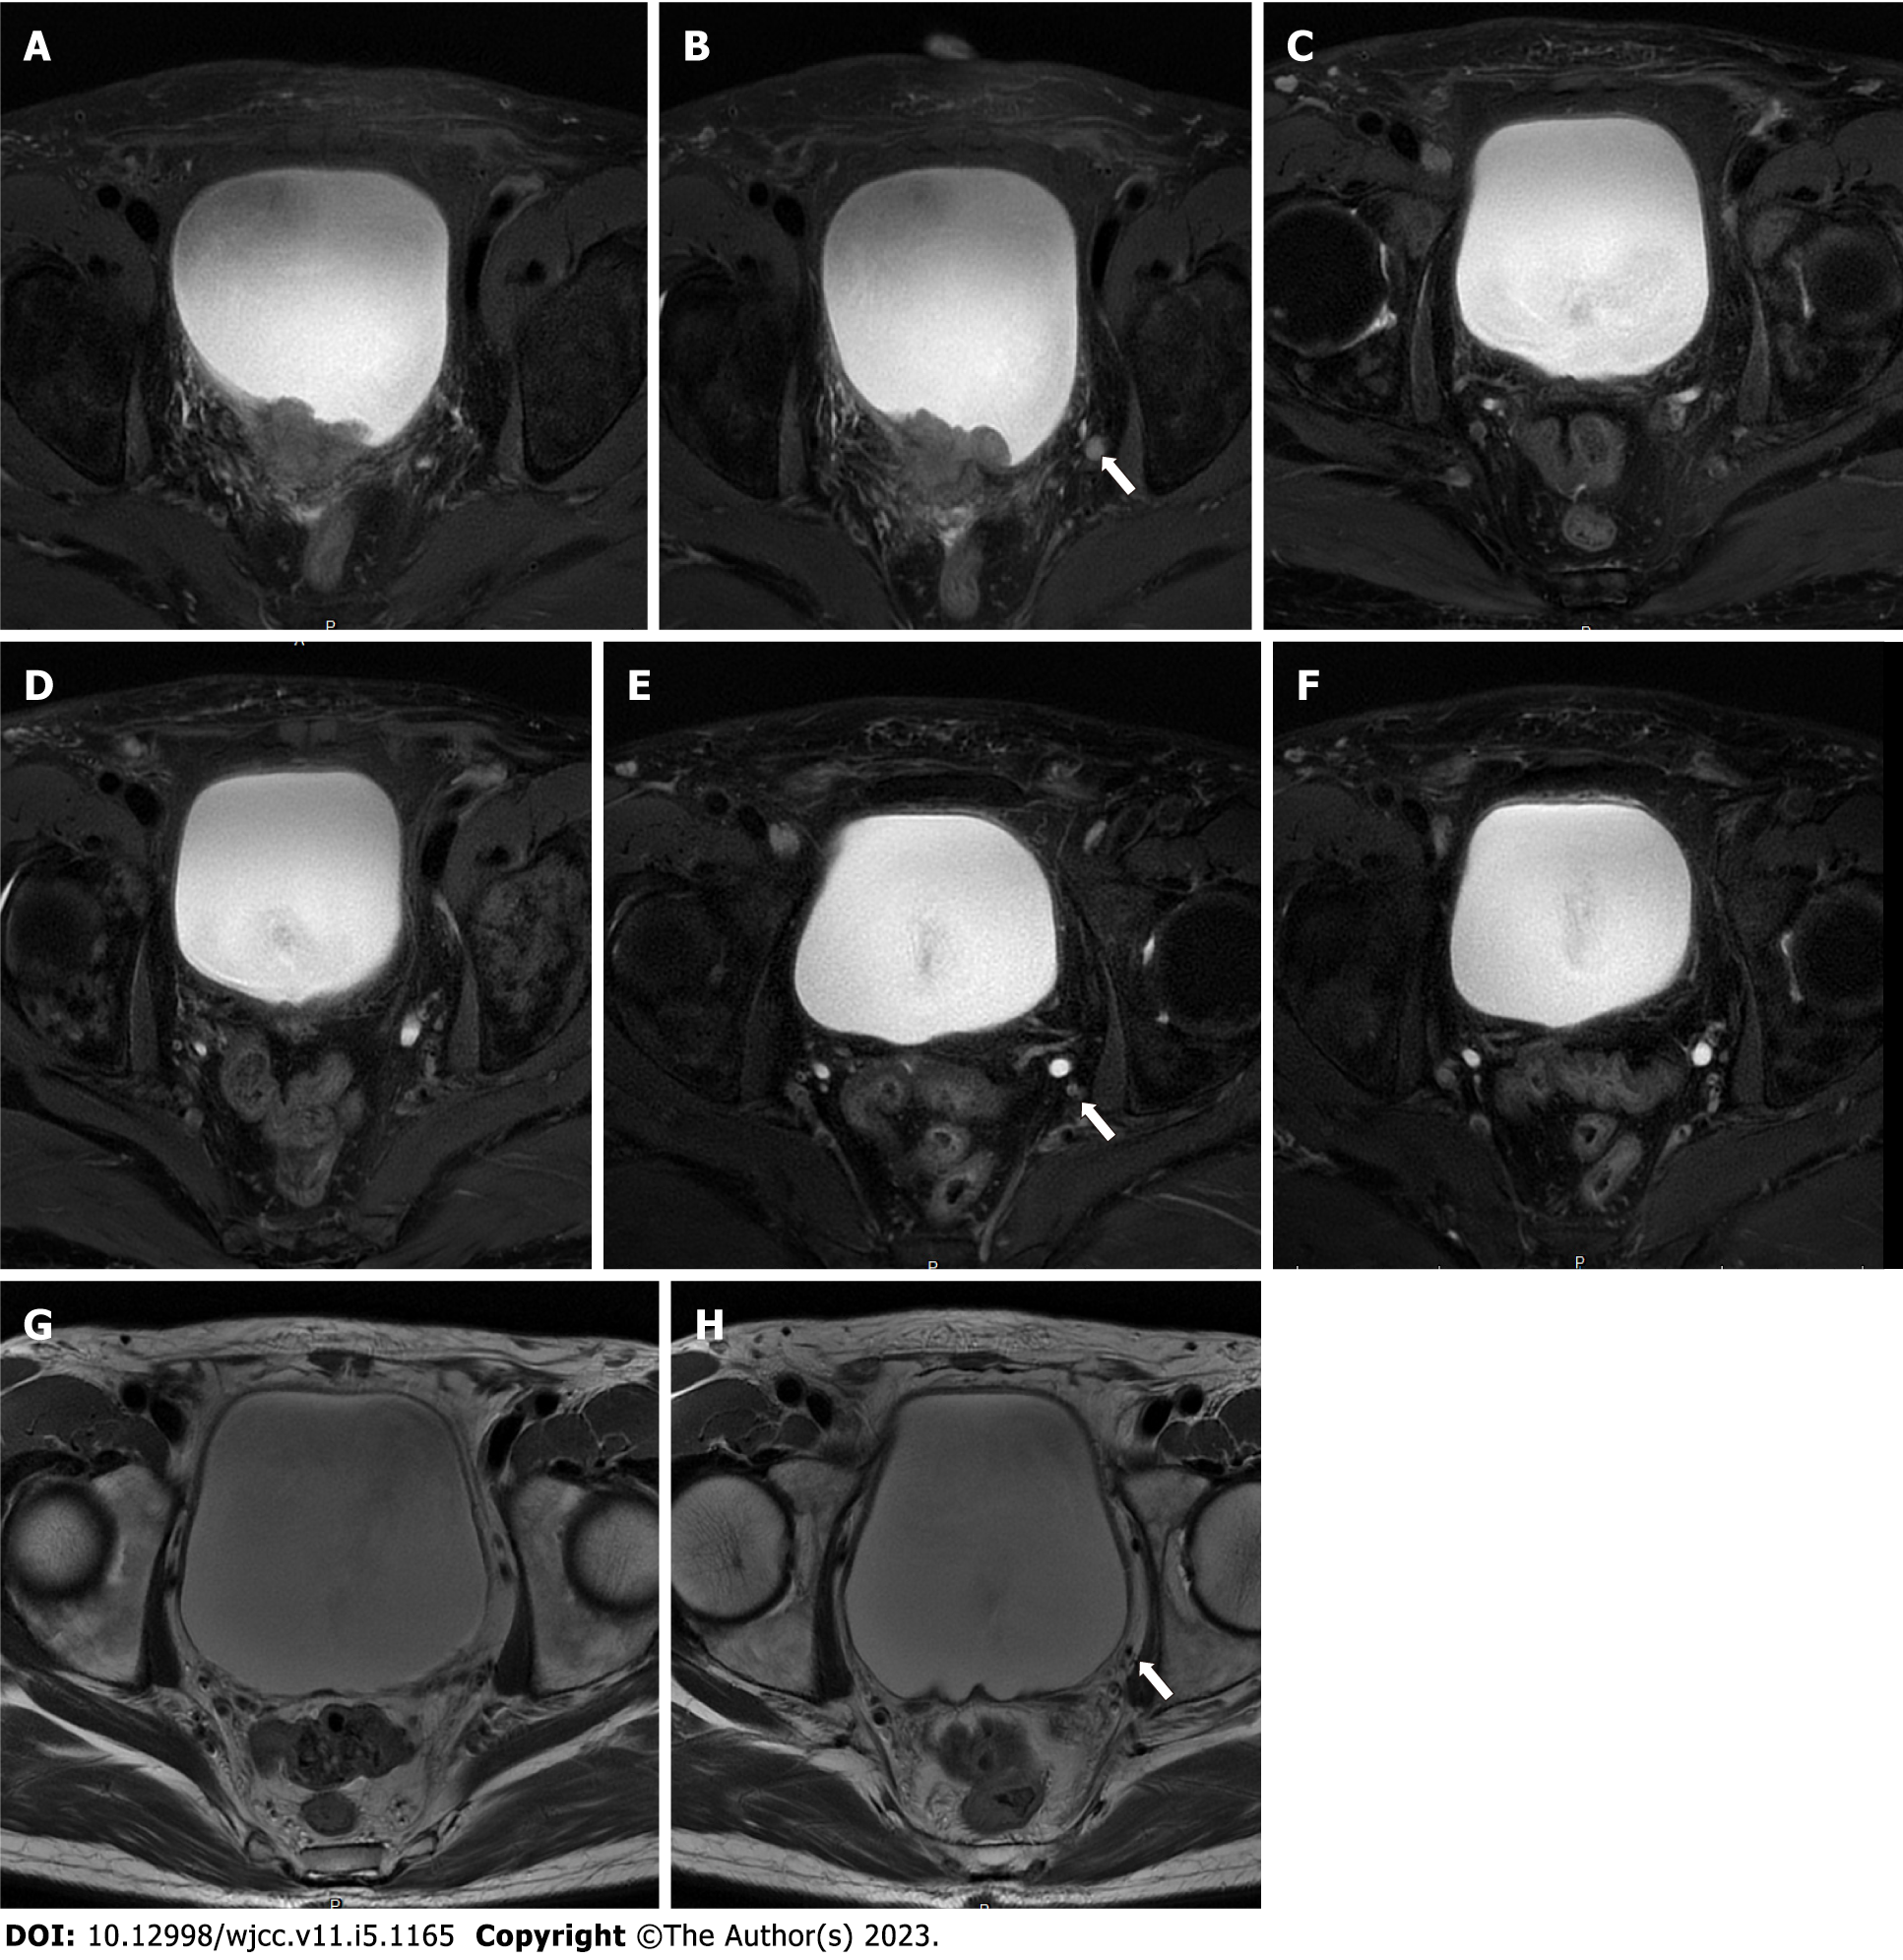
Figure 1 Pelvic magnetic resonance imaging during different treatment stages.
A: Tumor site before treatment; B: Lymph node before treatment; C: Tumor site after 2 cycles of treatment; D: Lymph node after 2 cycles of treatment; E: Tumor site after 4 cycles of treatment; F: lymph node after 4 cycles of treatment; G: Tumor site after 2 yr of treatment; H: Lymph node after 2 yr of treatment.
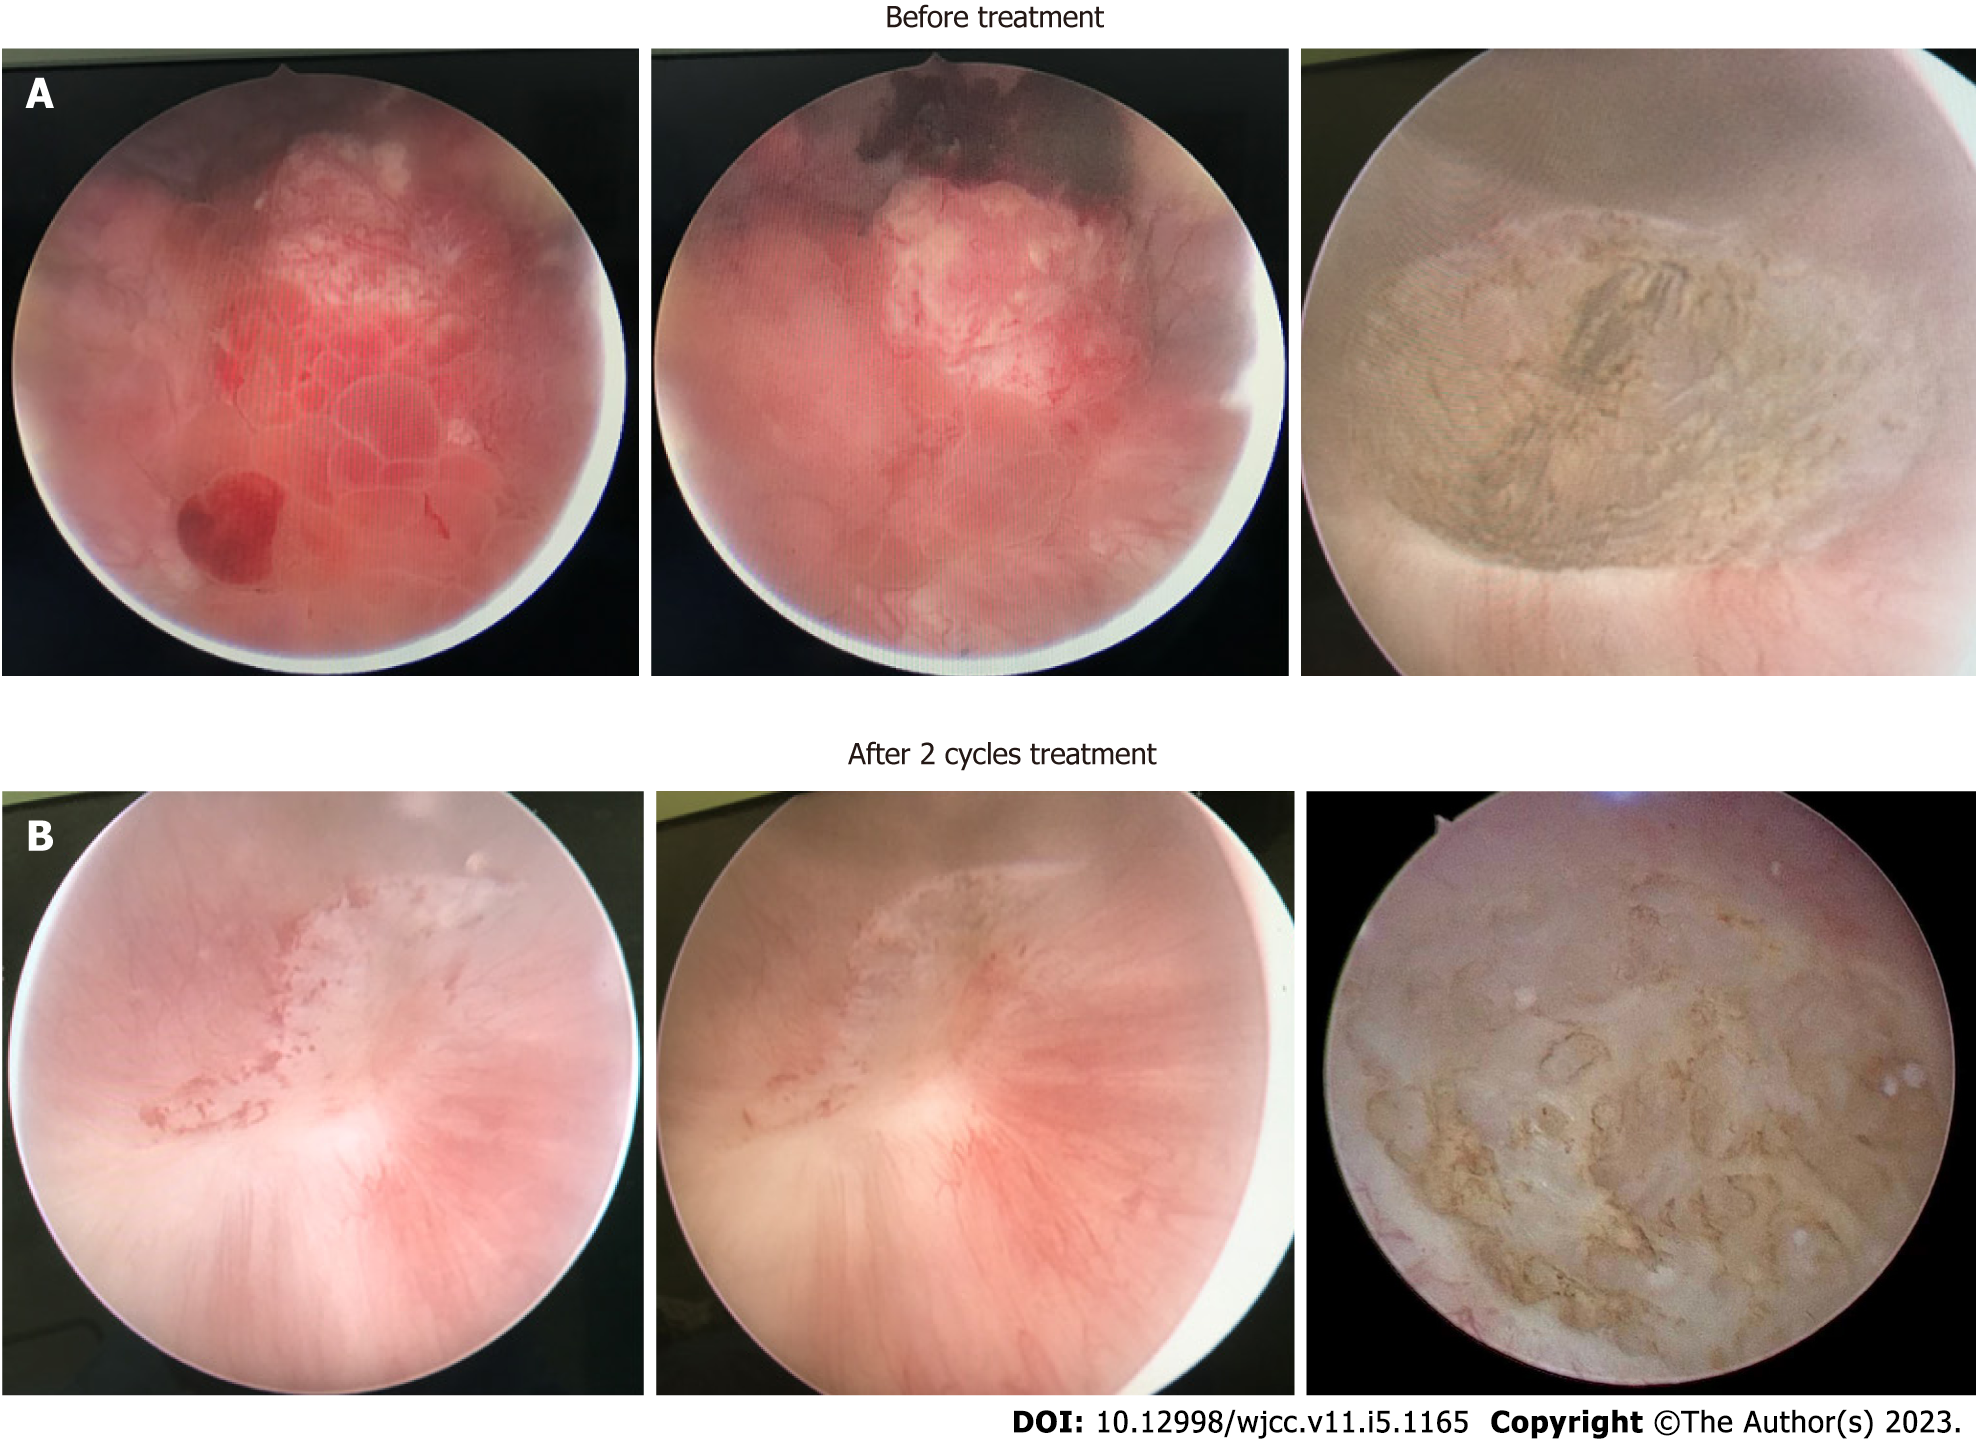
Figure 2 Cystoscopy.
A: Cystoscopy before treatment; B: Cystoscopy after 2 cycles of treatment.
Figure 3 Histology of the tumor tissue before treatment.
A and B: Representative images show mixed histology of (A) adenocarcinoma and (B) glandular variants by H&E staining (6 × magnification); C: Immunohistochemistry for programmed cell death-ligand 1 expression in bladder cancer tissues (200 × magnification).
Figure 4 Tumor mutational burden in the patient.
TMB: Tumor mutational burden.
Figure 5 Timeline of patient treatment.
TURBt: Transurethral resection of the bladder tumor; IHC: Immunohistochemical; MRI: Pelvic magnetic resonance imaging.
- Citation: Yang R, Chen JX, Luo SH, Chen TT, Chen LW, Huang B. Bladder preservation in complicated invasive urothelial carcinoma following treatment with cisplatin/gemcitabine plus tislelizumab: A case report. World J Clin Cases 2023; 11(5): 1165-1174
- URL: https://www.wjgnet.com/2307-8960/full/v11/i5/1165.htm
- DOI: https://dx.doi.org/10.12998/wjcc.v11.i5.1165


