Copyright
©The Author(s) 2023.
World J Clin Cases. Feb 16, 2023; 11(5): 1077-1085
Published online Feb 16, 2023. doi: 10.12998/wjcc.v11.i5.1077
Published online Feb 16, 2023. doi: 10.12998/wjcc.v11.i5.1077
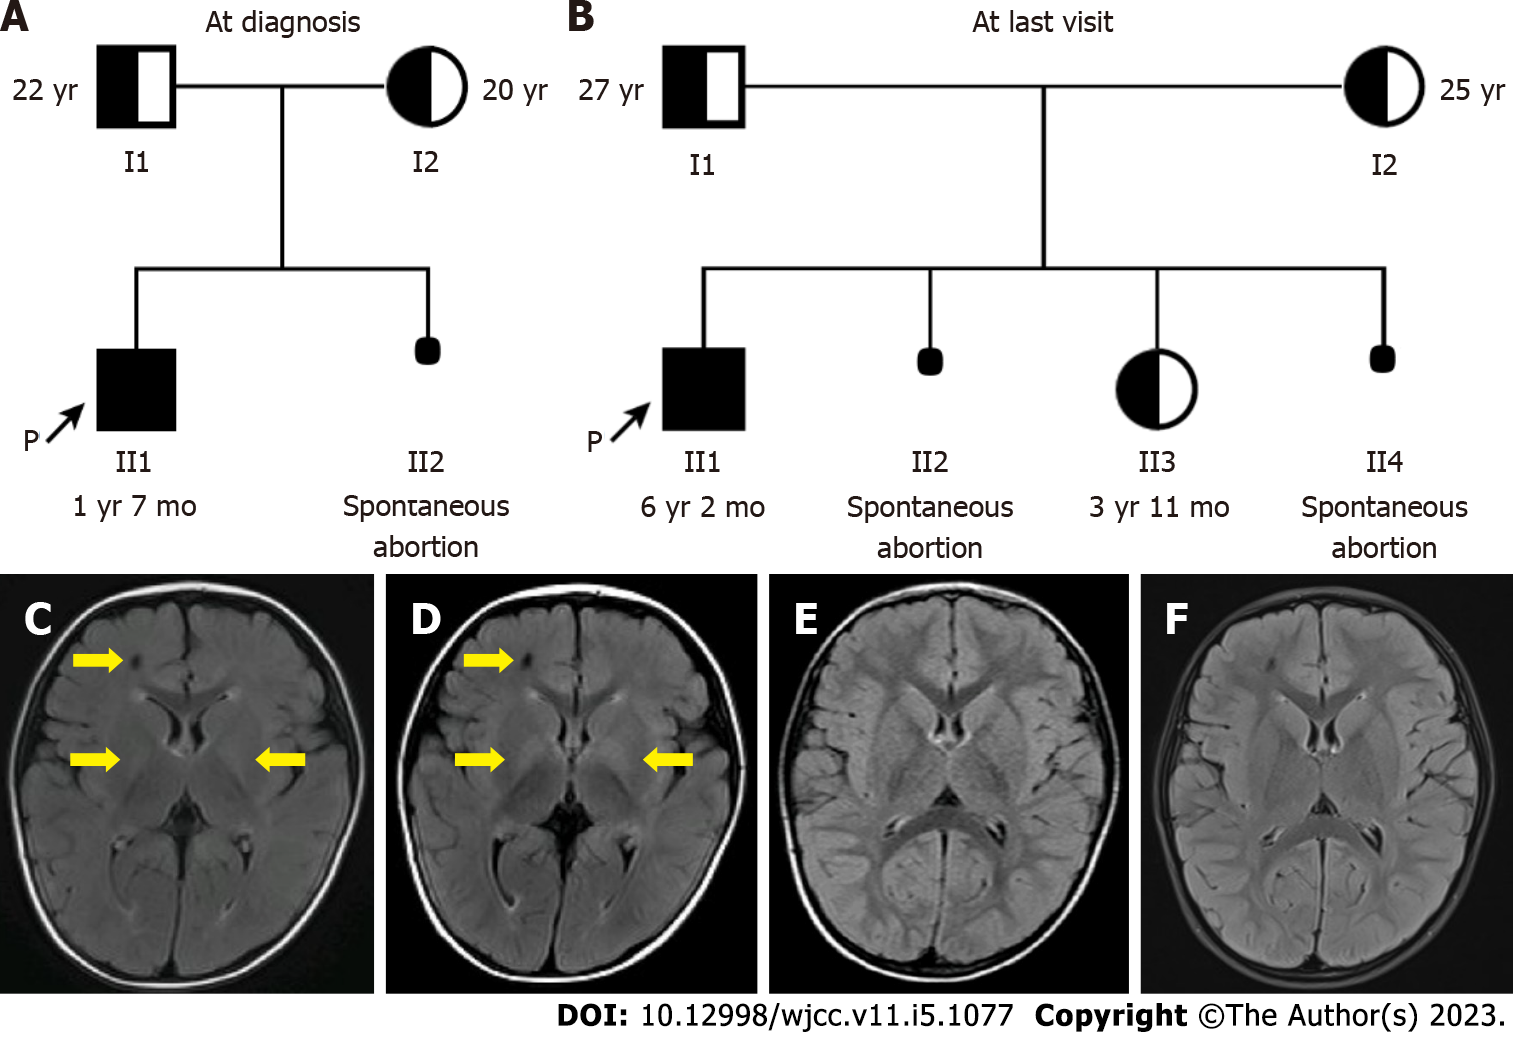
Figure 1 The pedigree and brain magnetic resonance imaging of the proband.
A: The pedigree at diagnosis; B: The pedigree at last visit. The arrow indicates the proband. Filled symbol represents the patient, while half-filled symbol represents carrier; C-F: Brain magnetic resonance imaging (T2-weighted-FLAIR). Abnormal signal in the right frontal lobe, and increased symmetrical signals in the basal ganglia are present at 1 year and 3 mo of age (C) and 1 year and 7 mo of age (D), but not seen at 3 years and 5 mo of age (E) and 5 years of age (F). The yellow arrows indicate brain lesions.
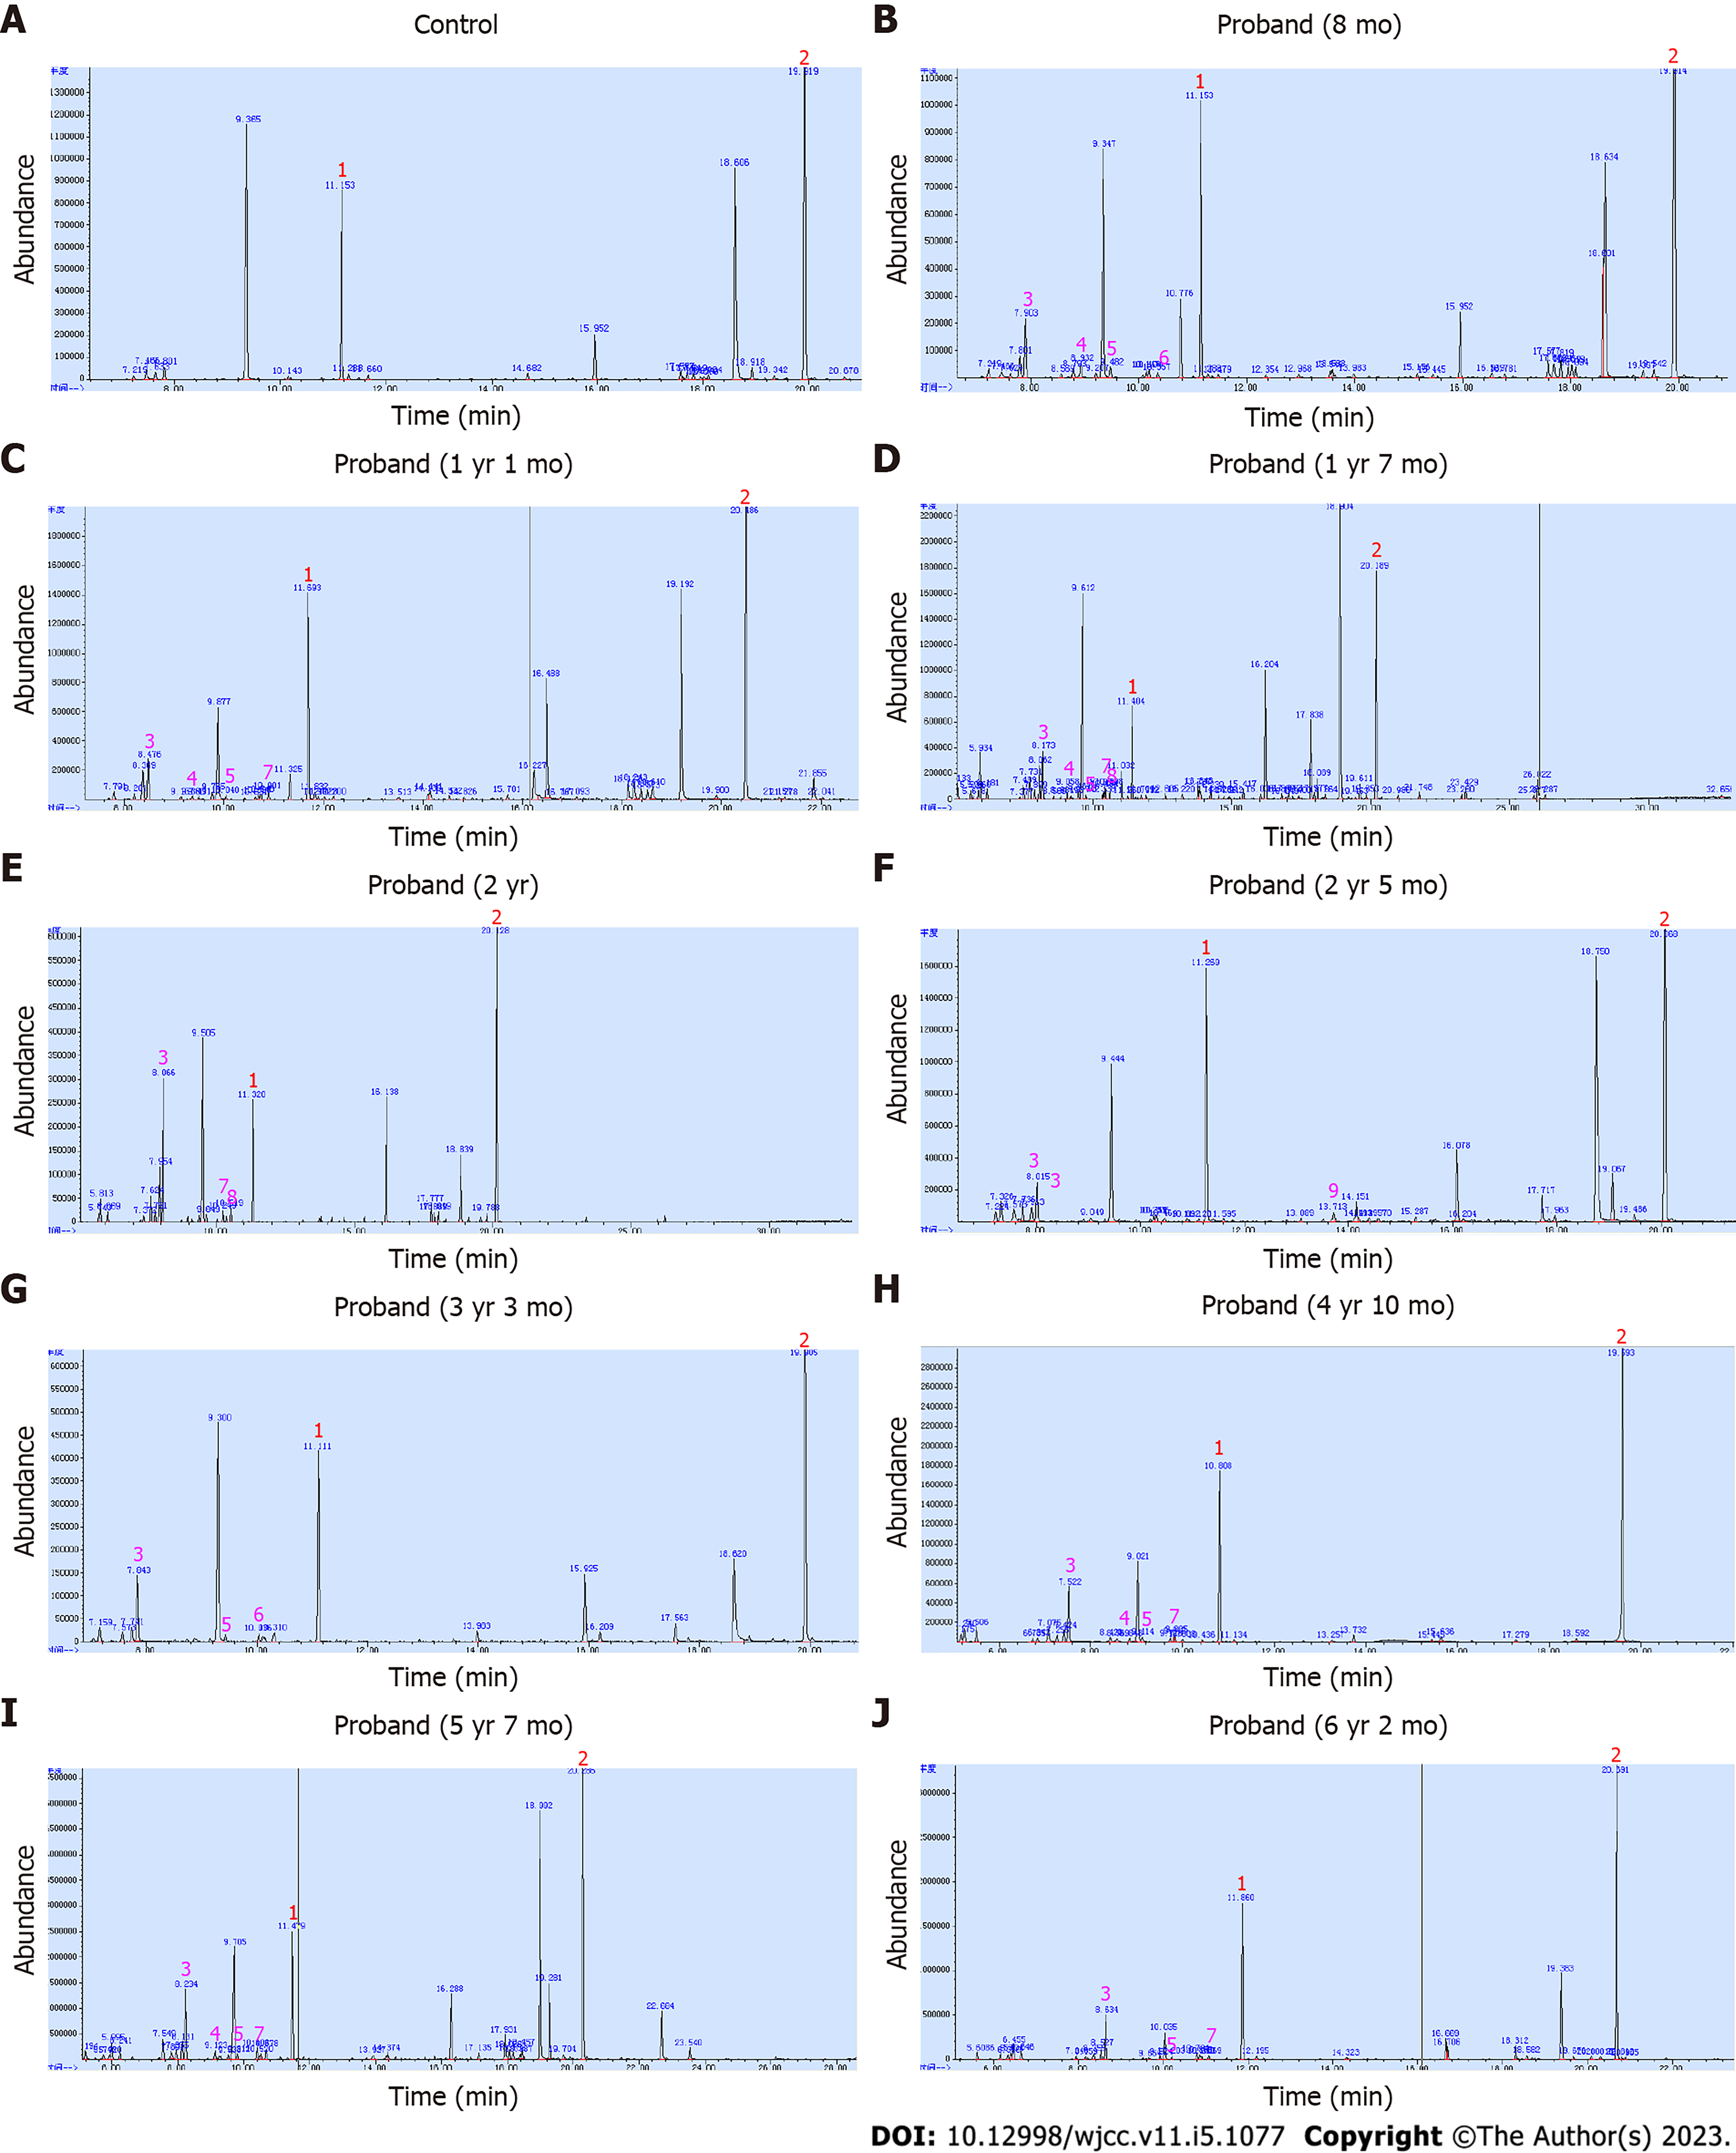
Figure 2 The urinary organic acid chromatograms of the proband.
A: The urinary organic acid chromatogram of a normal control; B-J: The urinary organic acid chromatograms of the proband at 8 mo, 1 year and 1 mo, 1 year and 7 mo, 2 years, 2 years and 5 mo, 3 years and 3 mo, 4 years and 10 mo, 5 years and 7 mo, and 6 years and 2 mo of age, respectively. Peak 1, internal standard; Peak 2, external standard; Peak 3, 2-OH-isovaleric acid; Peak 4 and 9, 3-OH-isovaleric acid; Peak 5, 2-OH-isocaproic acid; Peak 6, 2-keto-isocaproic acid; Peak 7 and 8, 2-keto-3-methylvaleric acid.
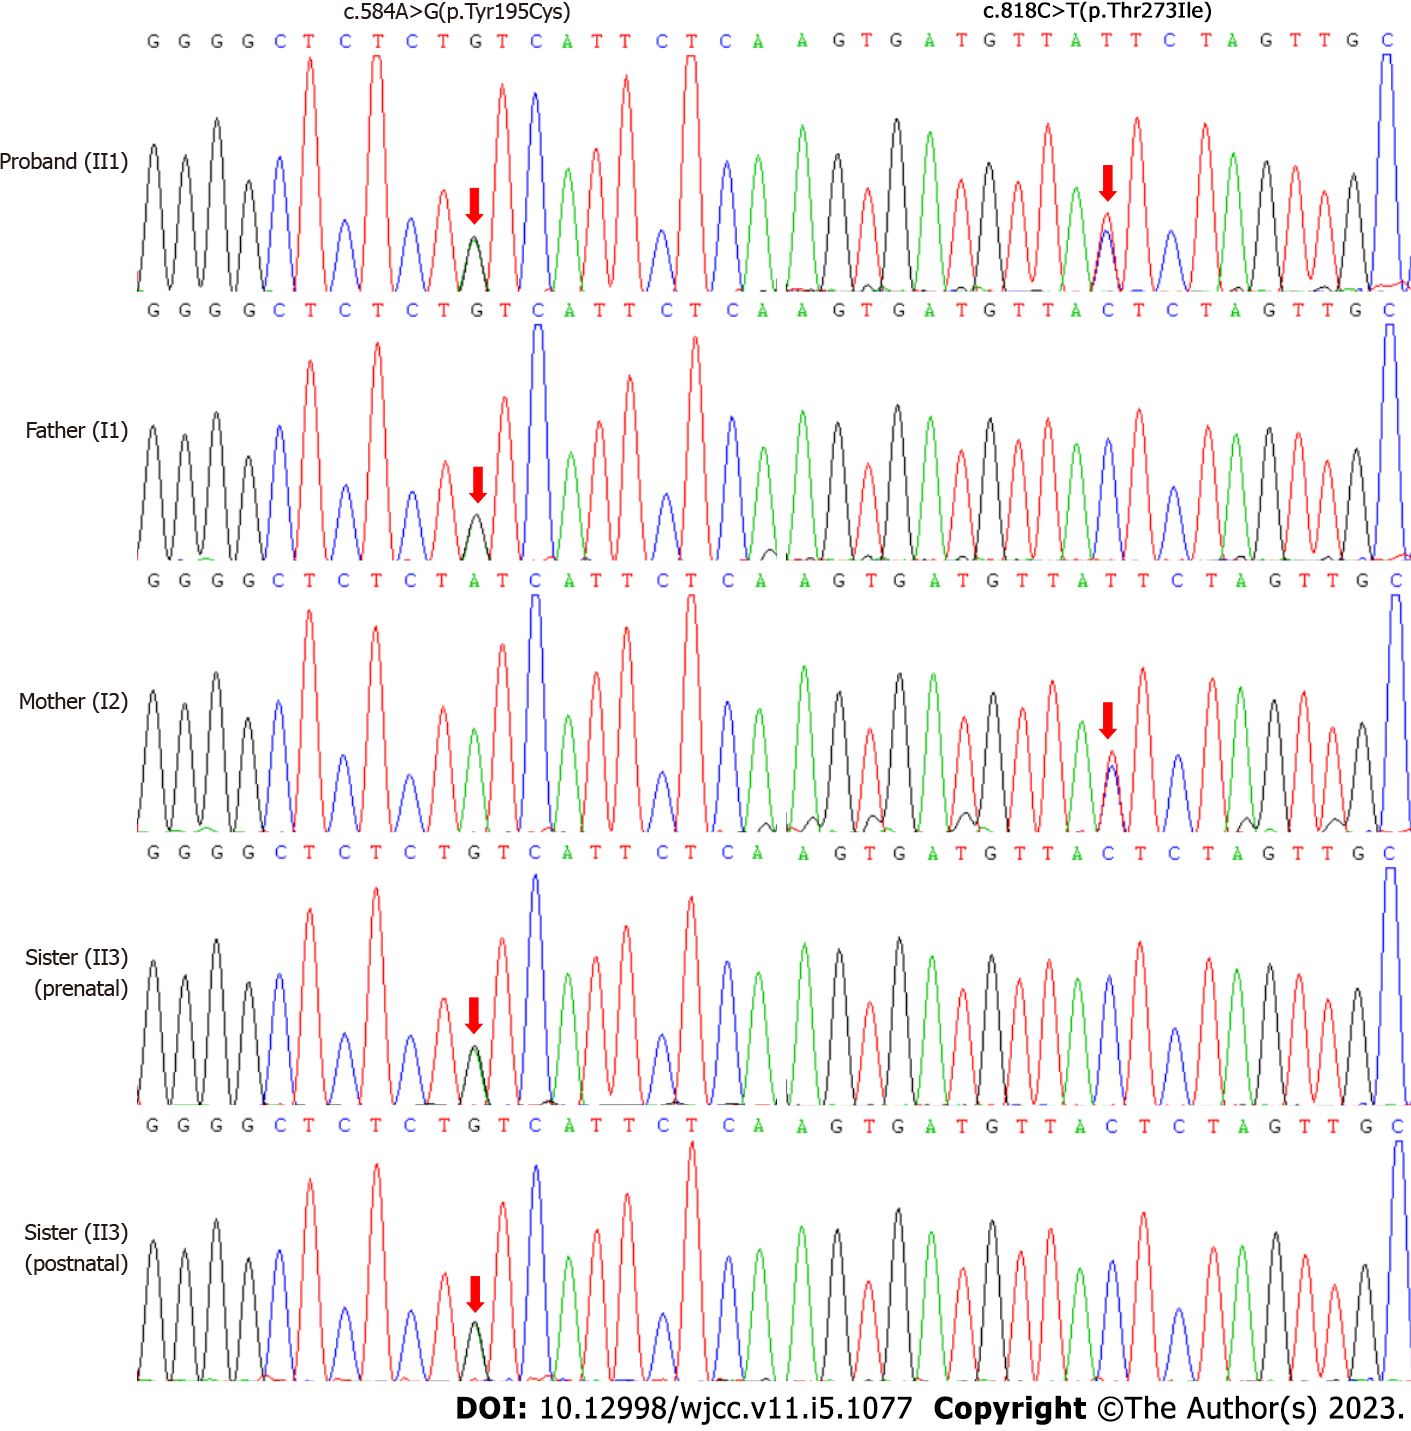
Figure 3 The sequencing diagrams of the enrolled family.
The red arrow indicates the variant site.
- Citation: Lin YT, Cai YN, Ting TH, Liu L, Zeng CH, Su L, Peng MZ, Li XZ. Diagnosis of an intermediate case of maple syrup urine disease: A case report. World J Clin Cases 2023; 11(5): 1077-1085
- URL: https://www.wjgnet.com/2307-8960/full/v11/i5/1077.htm
- DOI: https://dx.doi.org/10.12998/wjcc.v11.i5.1077


