Copyright
©The Author(s) 2023.
World J Clin Cases. Feb 16, 2023; 11(5): 1040-1048
Published online Feb 16, 2023. doi: 10.12998/wjcc.v11.i5.1040
Published online Feb 16, 2023. doi: 10.12998/wjcc.v11.i5.1040
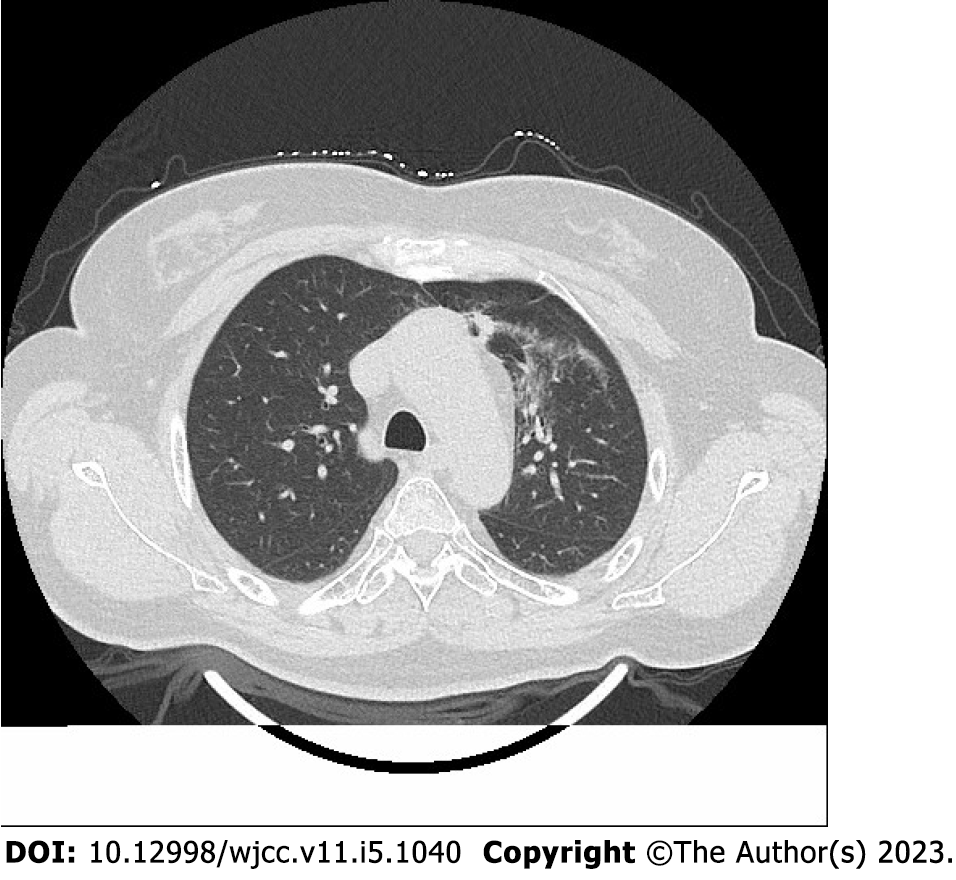
Figure 1 Radiation pneumonitis.
Chest computed tomography image of a patient treated with radiation is shown.
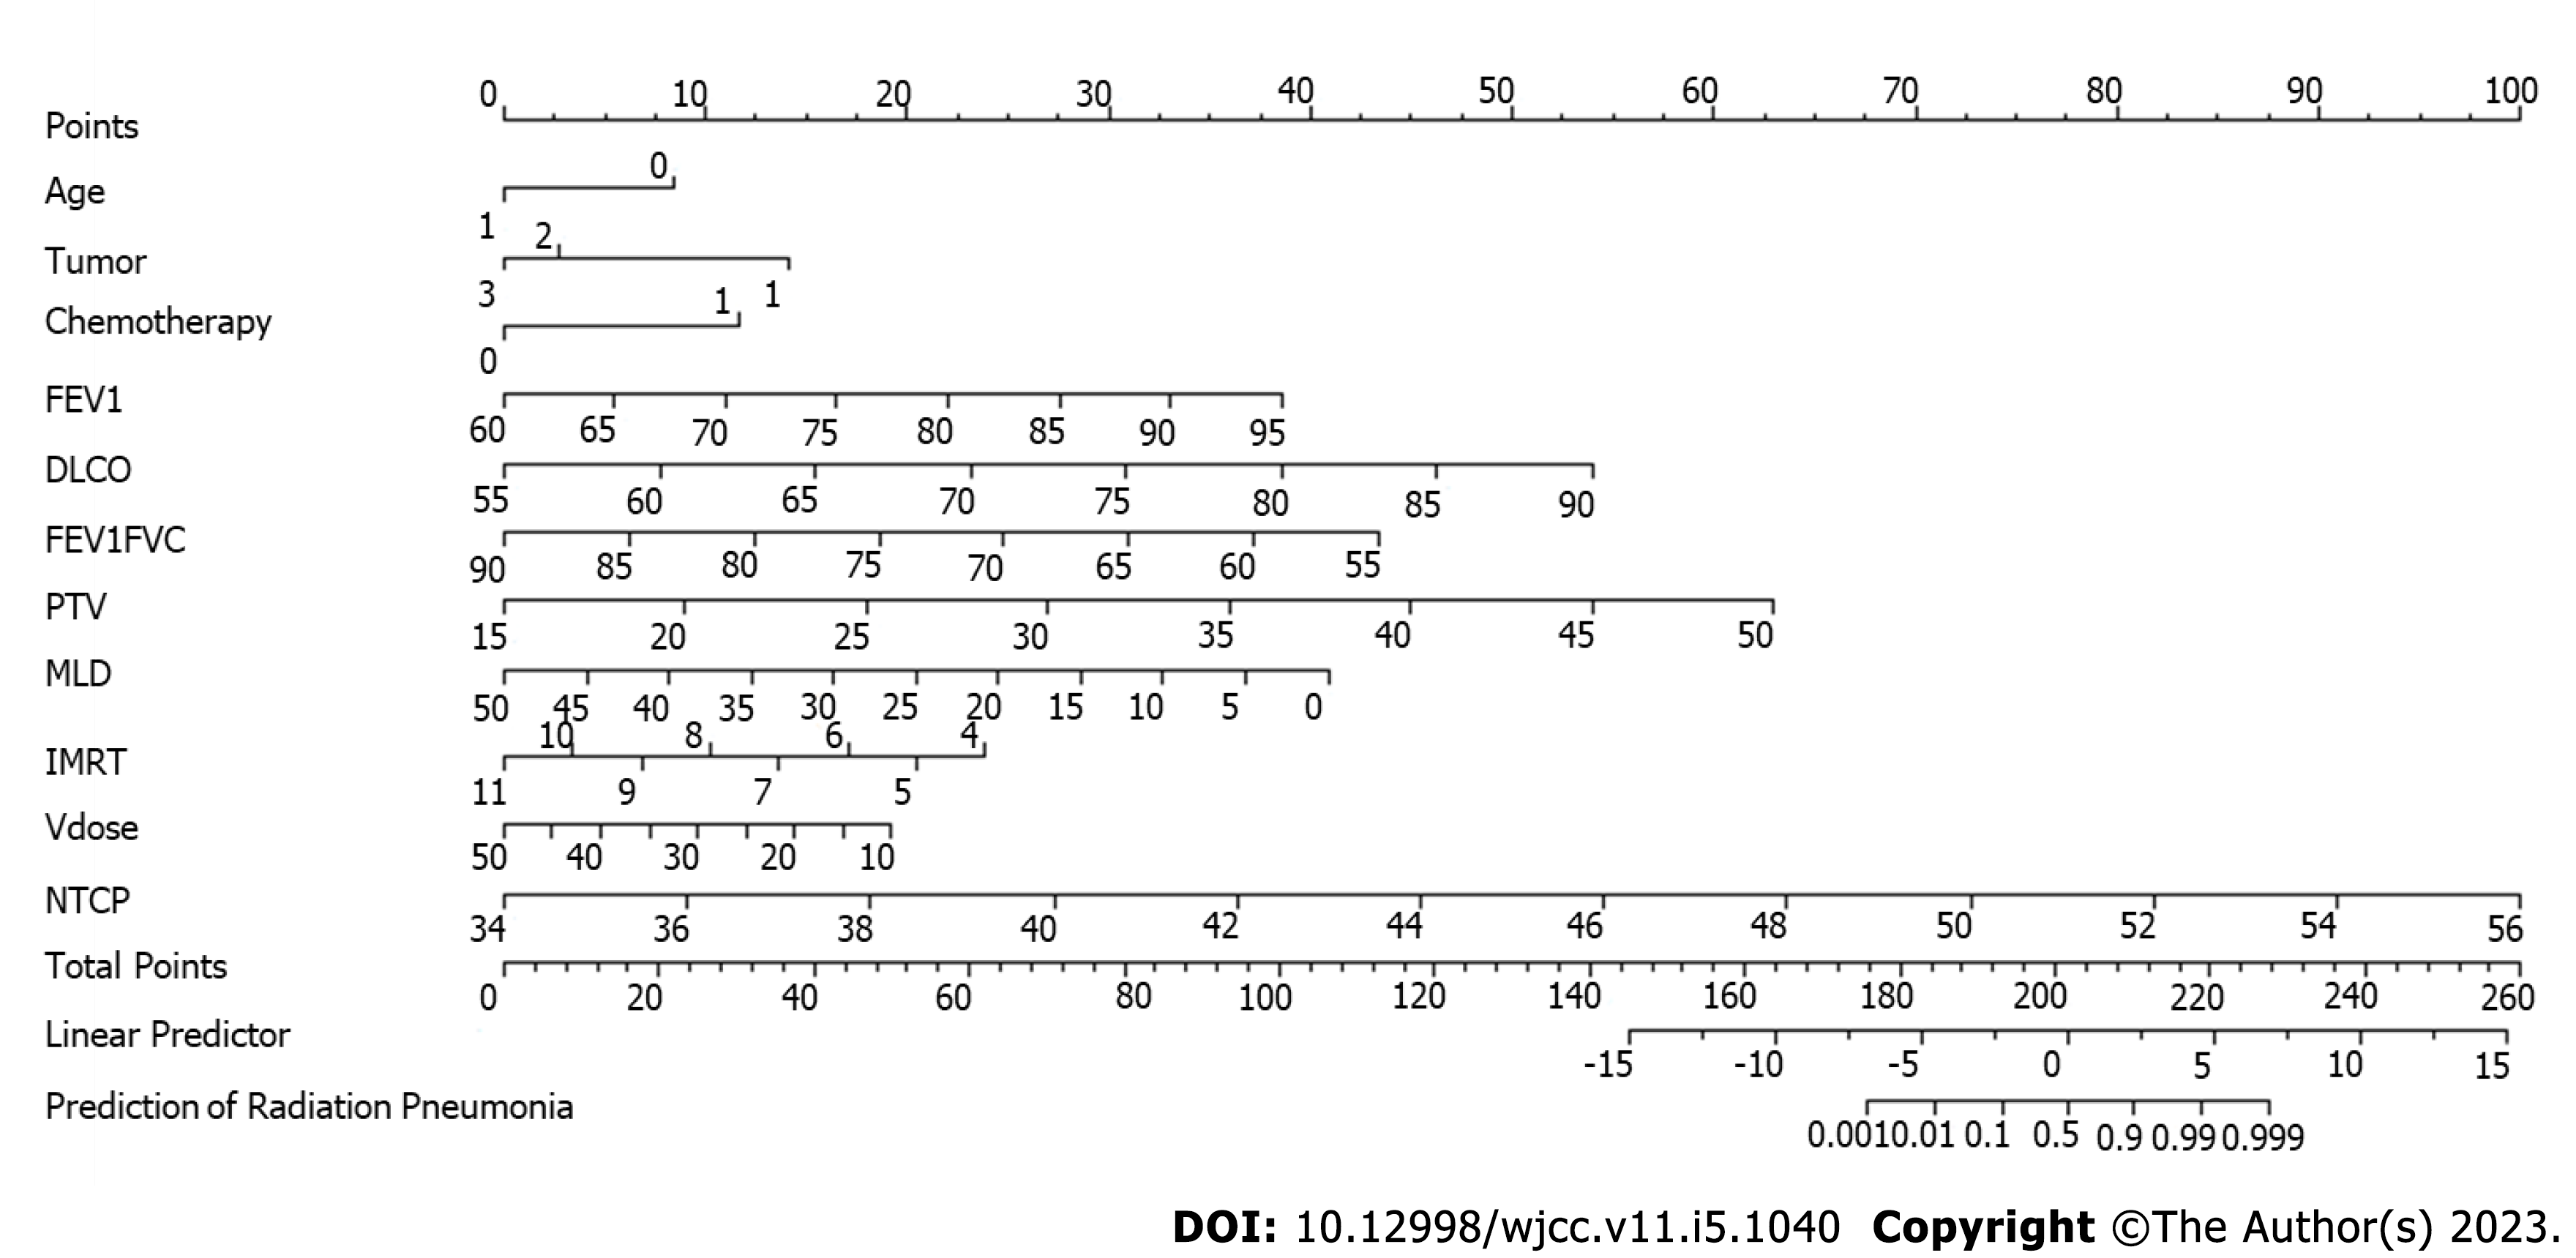
Figure 2 Nomogram of logistic regression model predicting radiation pneumonitis.
Position on the Total Points scale indicates probability of radiation pneumonitis on the prediction scale. FEV1: Forced expiratory volume in the first second; DLCO: Carbon monoxide diffusion volume; PTV: Planned target area; MLD: Mean lung dose; IMRT: Intensity-modulated radiation therapy; vdose: Percentage of lung tissue in total lung volume; NTCP: Normal tissue complications.
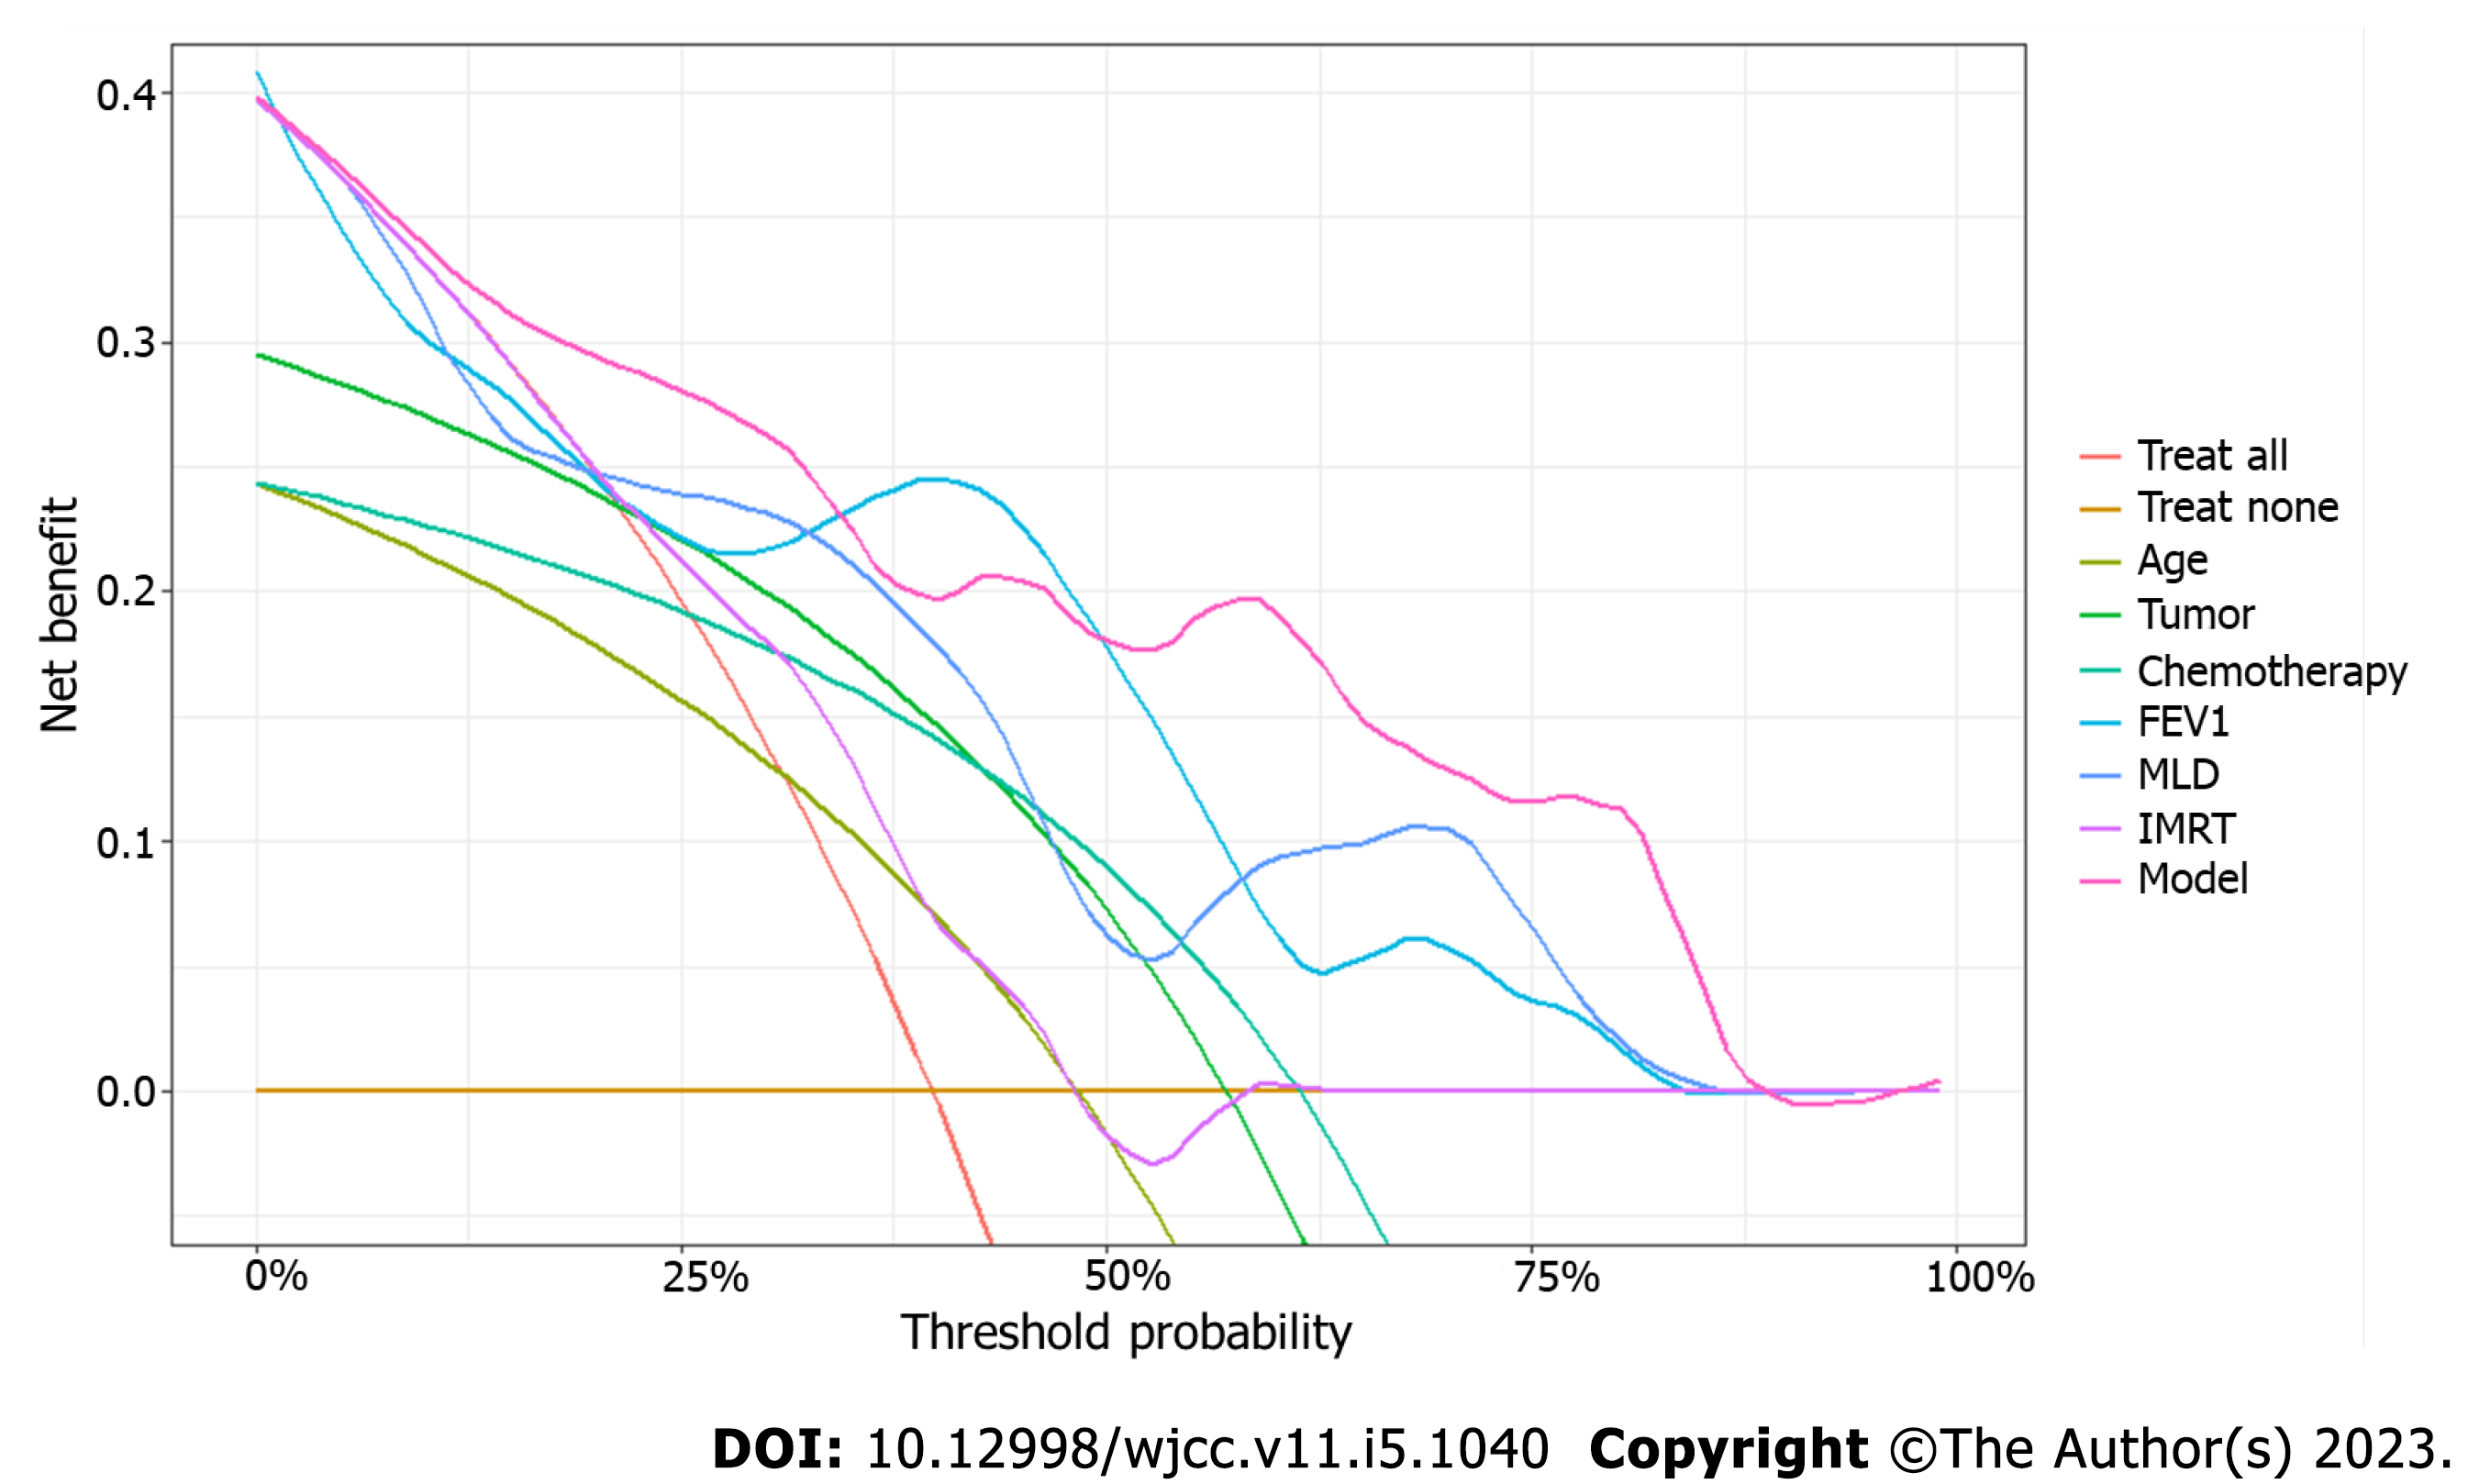
Figure 3 Decision curve analysis for the logistic regression model predicting radiation pneumonitis.
Prediction by all independent variables in the model is also plotted separately, with continuous variables transformed based on probability. “Treat all” plot represents assumption that all patients will develop radiation pneumonitis and “Treat none” plot represents assumption that none will develop radiation pneumonitis.
- Citation: Shi LL, Yang JH, Yao HF. Multiple regression analysis of risk factors related to radiation pneumonitis. World J Clin Cases 2023; 11(5): 1040-1048
- URL: https://www.wjgnet.com/2307-8960/full/v11/i5/1040.htm
- DOI: https://dx.doi.org/10.12998/wjcc.v11.i5.1040


