Copyright
©The Author(s) 2023.
World J Clin Cases. Nov 16, 2023; 11(32): 7833-7851
Published online Nov 16, 2023. doi: 10.12998/wjcc.v11.i32.7833
Published online Nov 16, 2023. doi: 10.12998/wjcc.v11.i32.7833
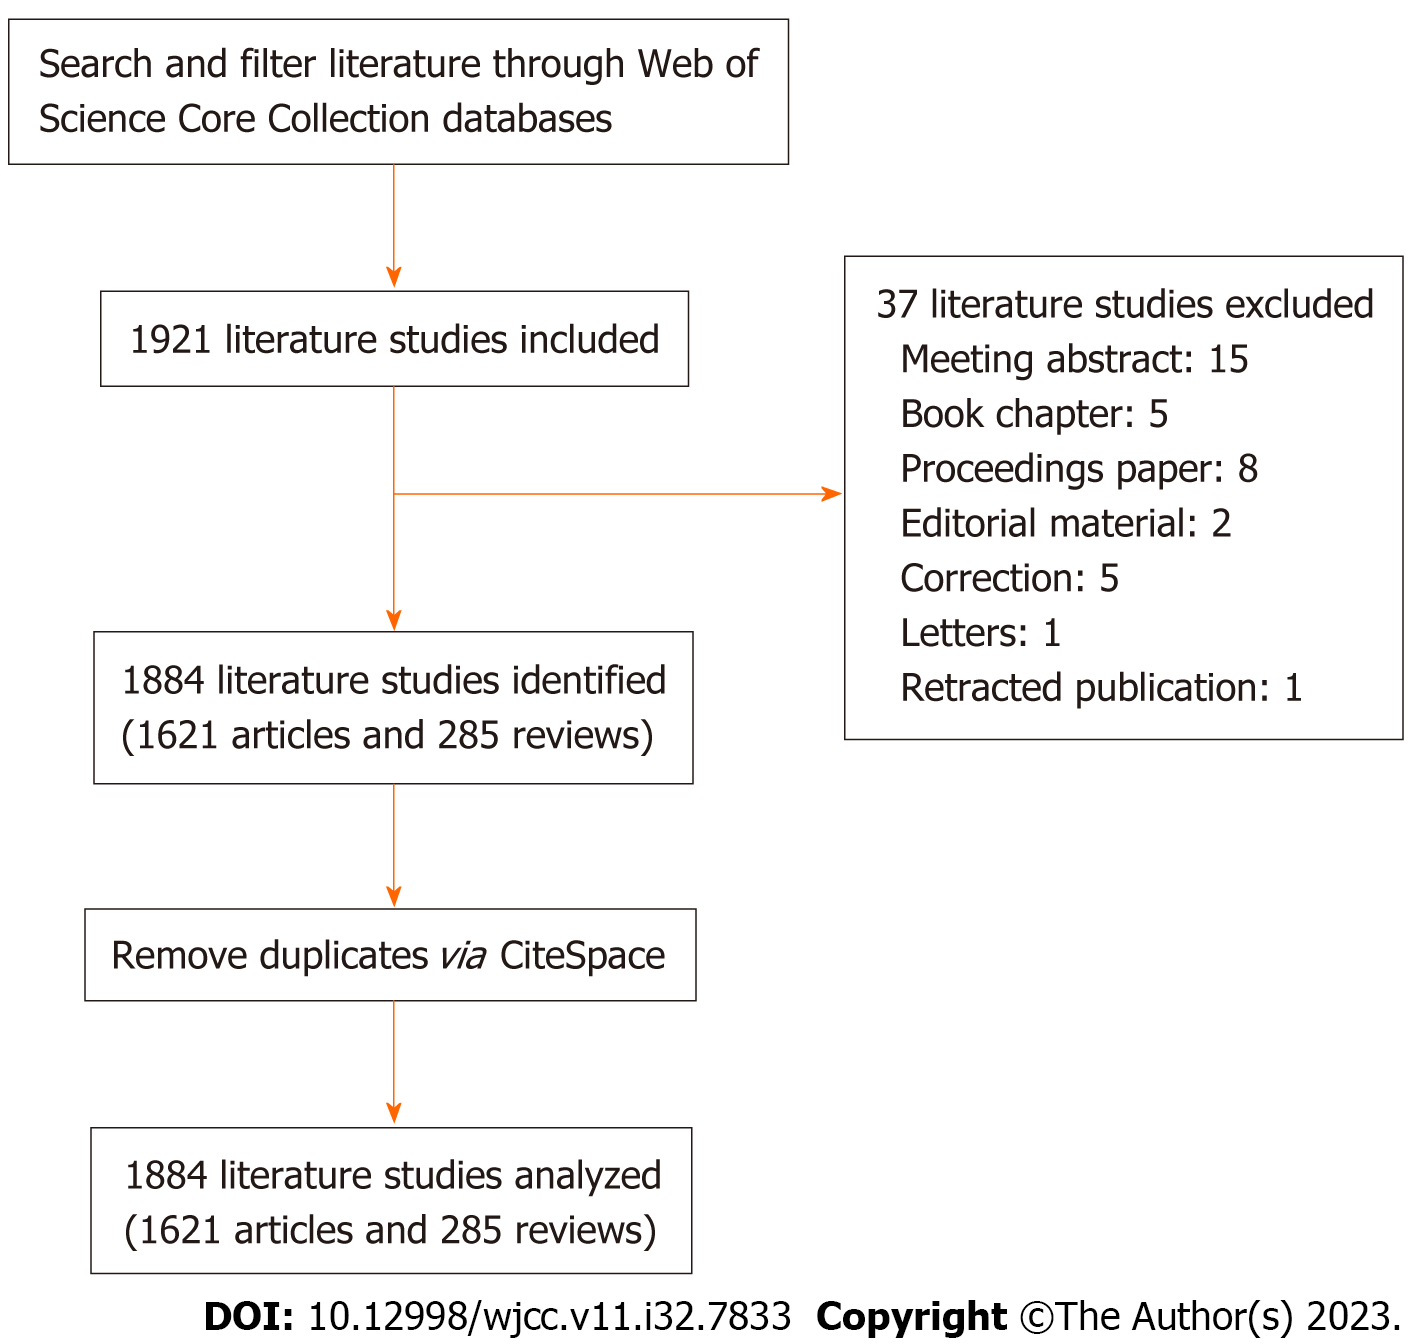
Figure 1 Schematic for reviewing literature.
One day was dedicated to data collection. (04 October 2022). The Web of Science Core Collection database yielded 1921 entries in total. 37 articles were then removed, including conference abstracts, book chapters, proceedings papers, edited materials, revised publications, and publications that had retracted earlier versions. 1884 statistics were ultimately collected. For further research, data were imported into Cite-Space software (version 6.1. R6).
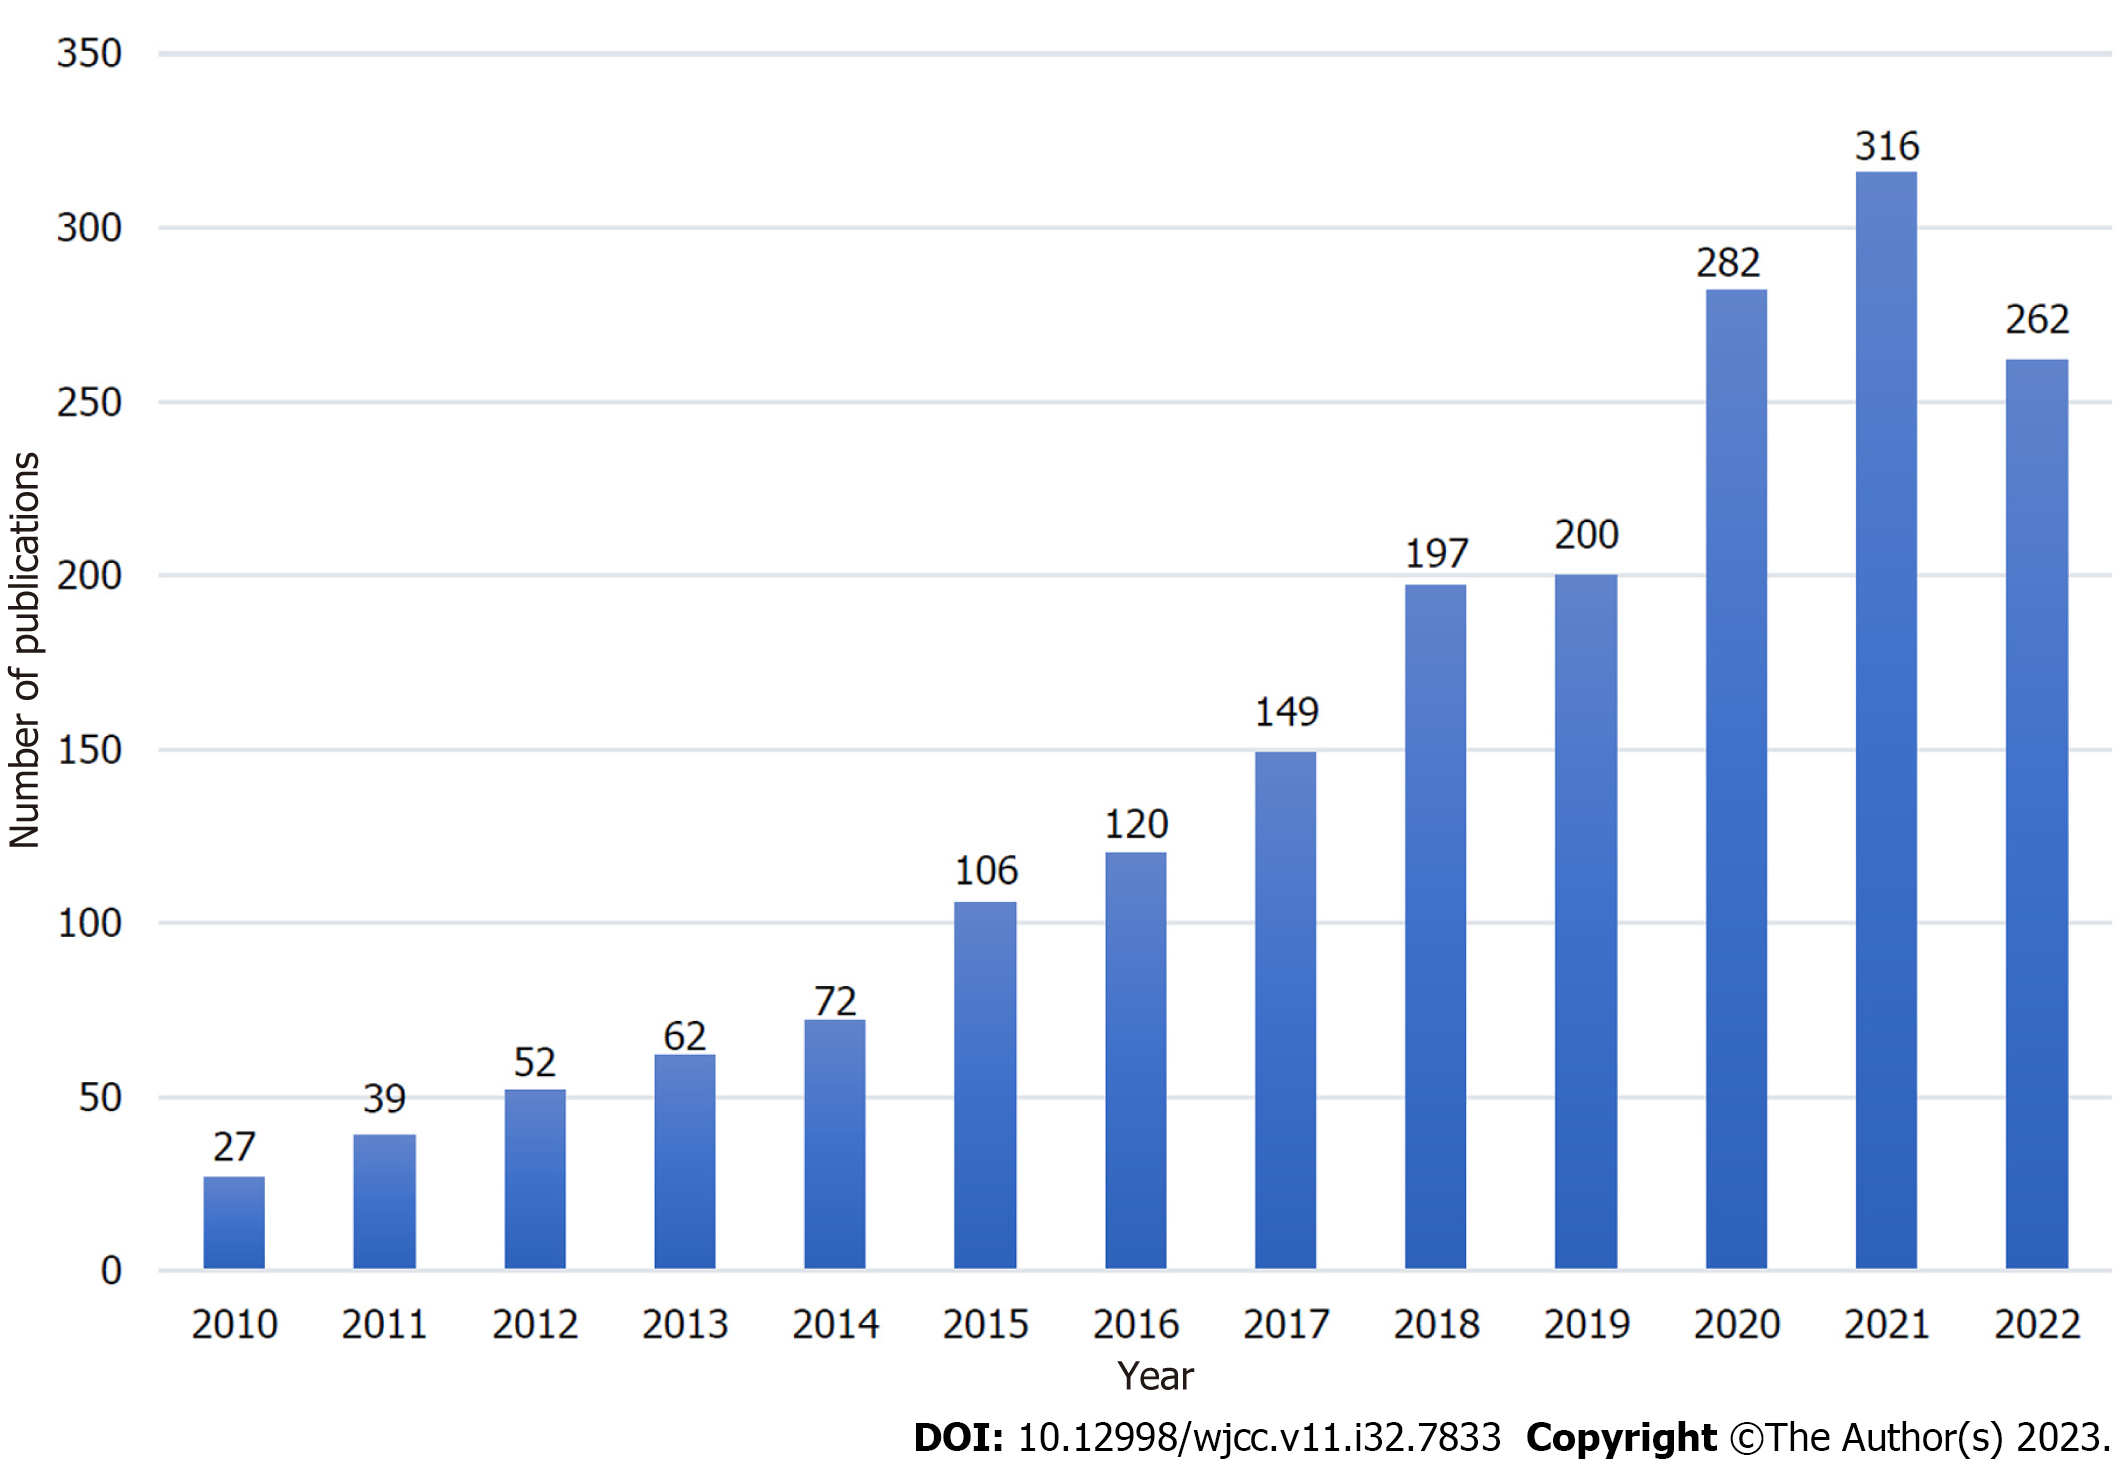
Figure 2 Publications by year (2010-2022).
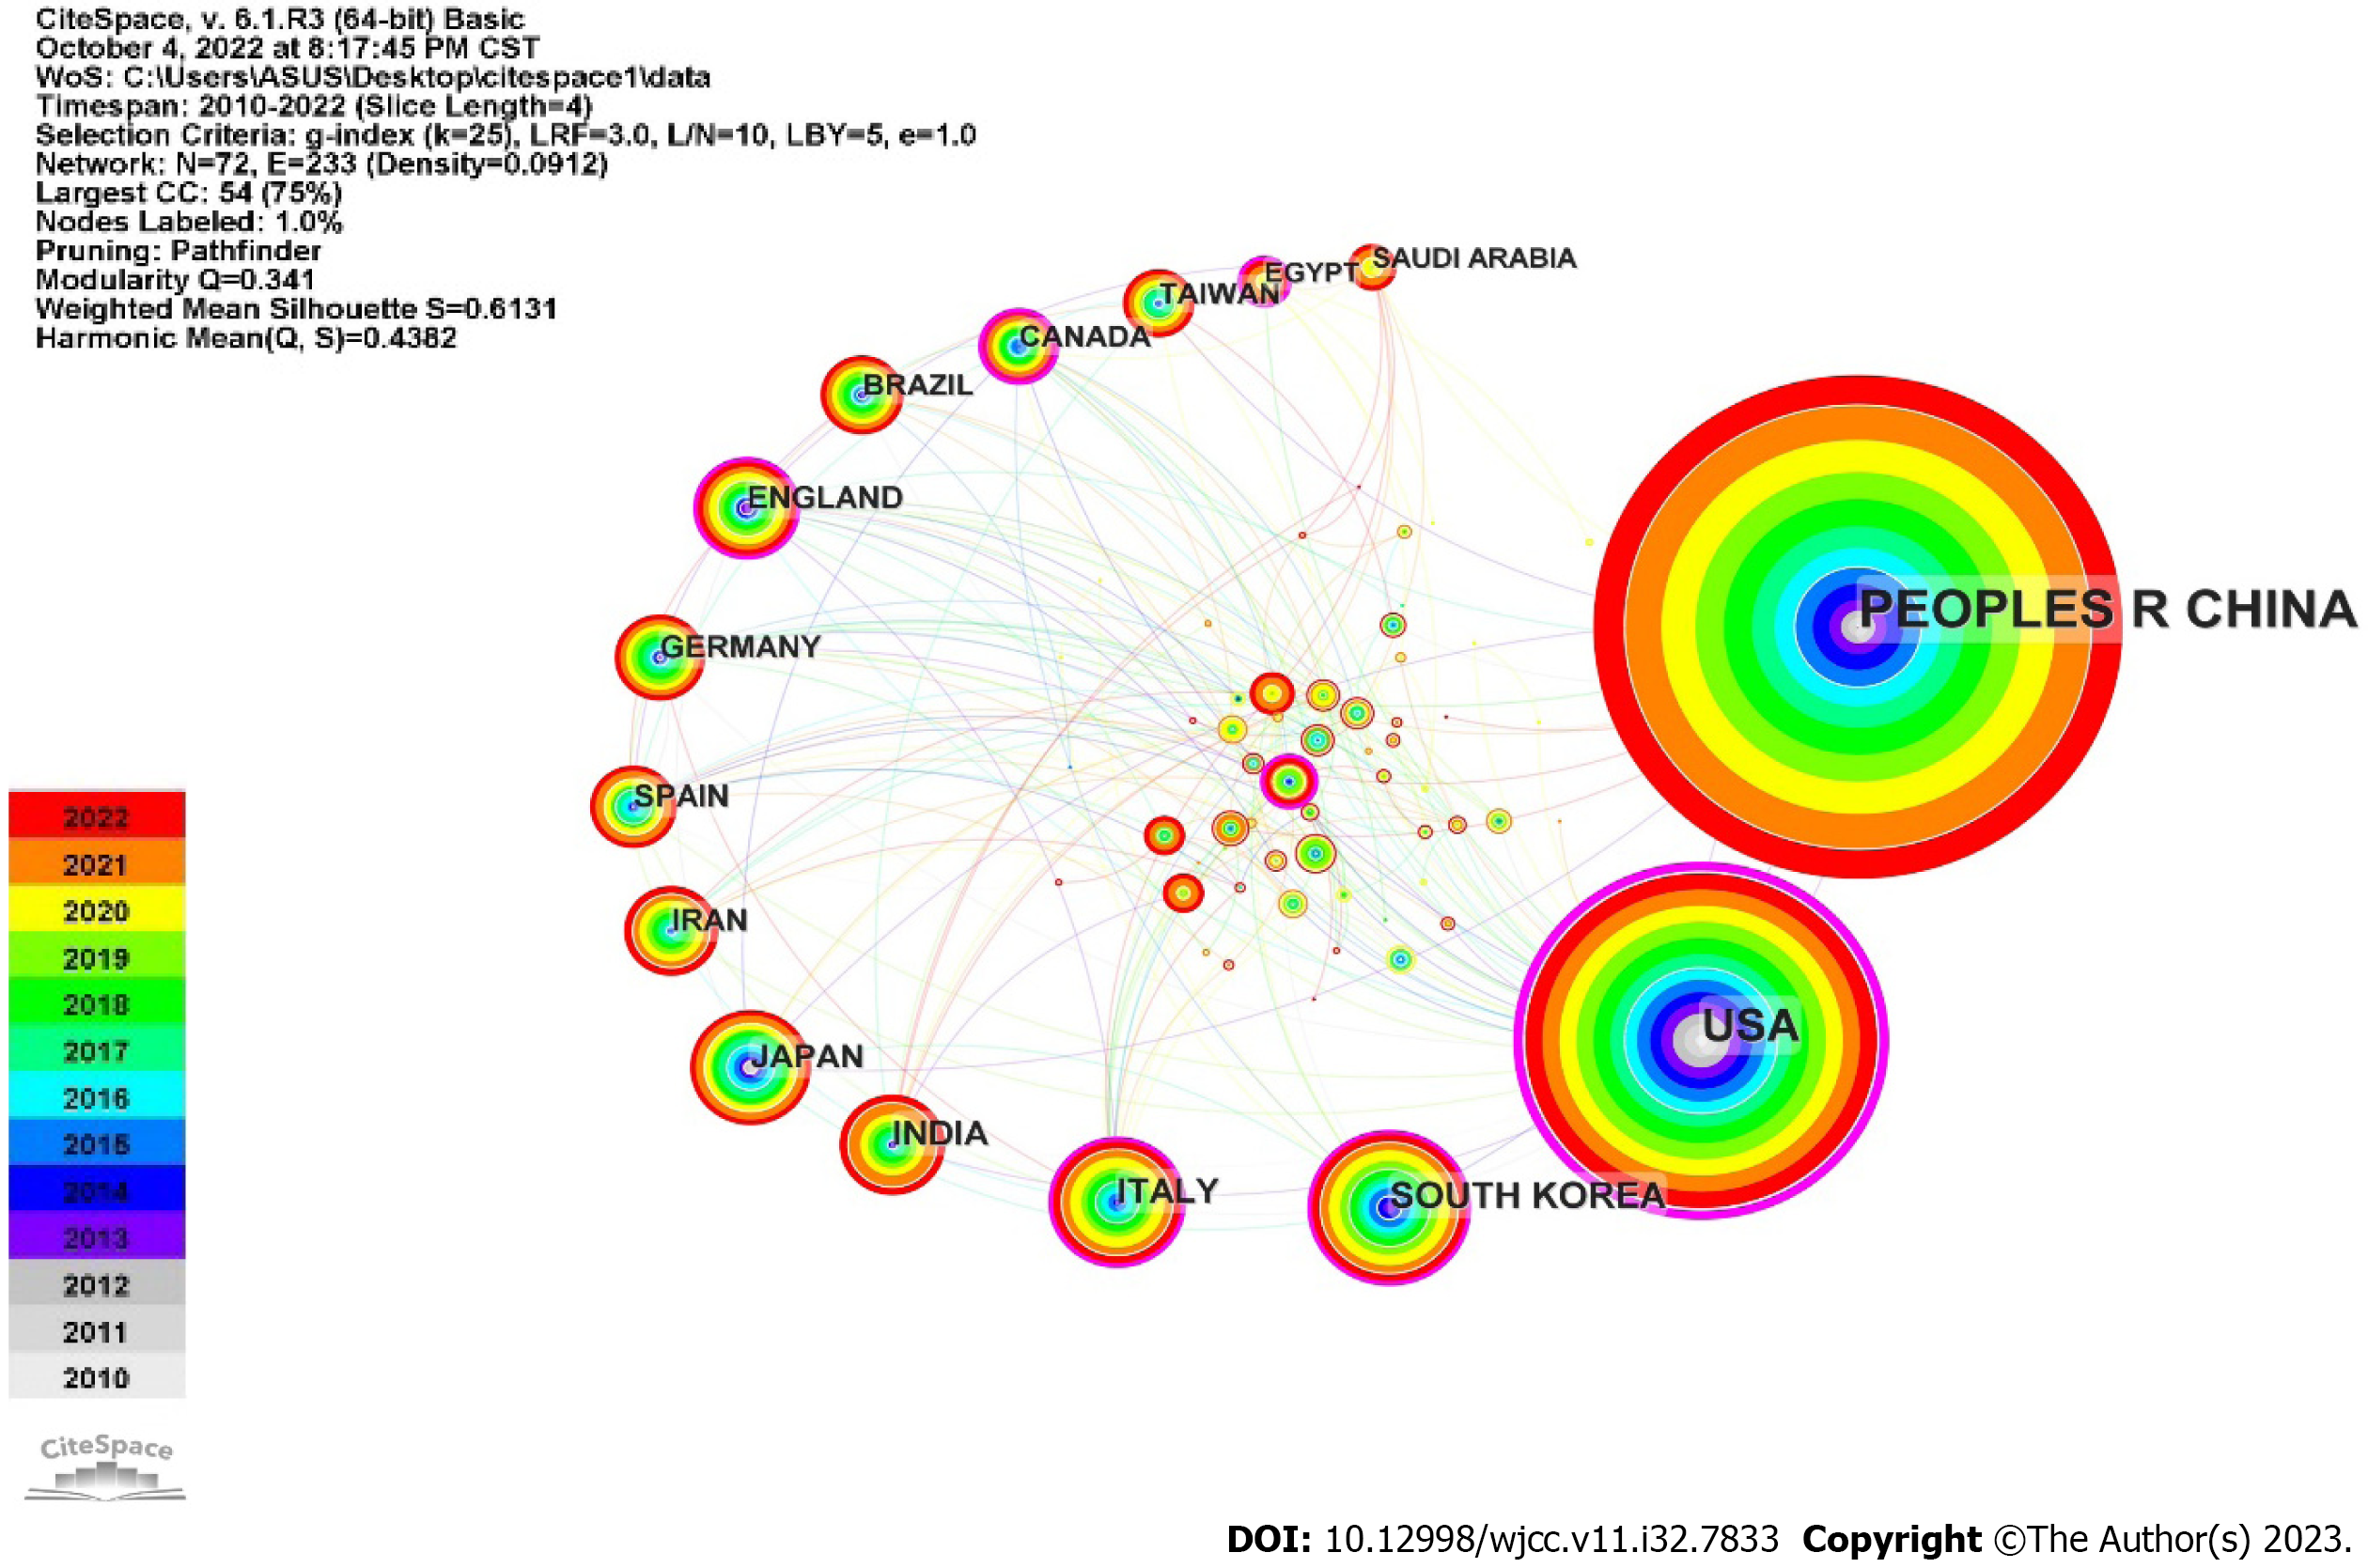
Figure 3 Publications by country.
The quantity of articles is indicated by the node size. The quantity of articles published by a nation is shown by an increase in node size. The top 20 publishing-producing nations are depicted in the graph. China tops the chart, followed by the United States, South Korea, Italy, Japan, India, Ireland, Spain, Germany, and the United Kingdom in clockwise order. The collaboration between various nations is represented by lines between nodes.
Figure 4 The number of publications by each of the five nations each year.
China, the United States, South Korea, Italy, and India were the five countries with the most articles released. Estimation of the annual quantity of publications in each of these five nations. Different hue lines denote various countries.
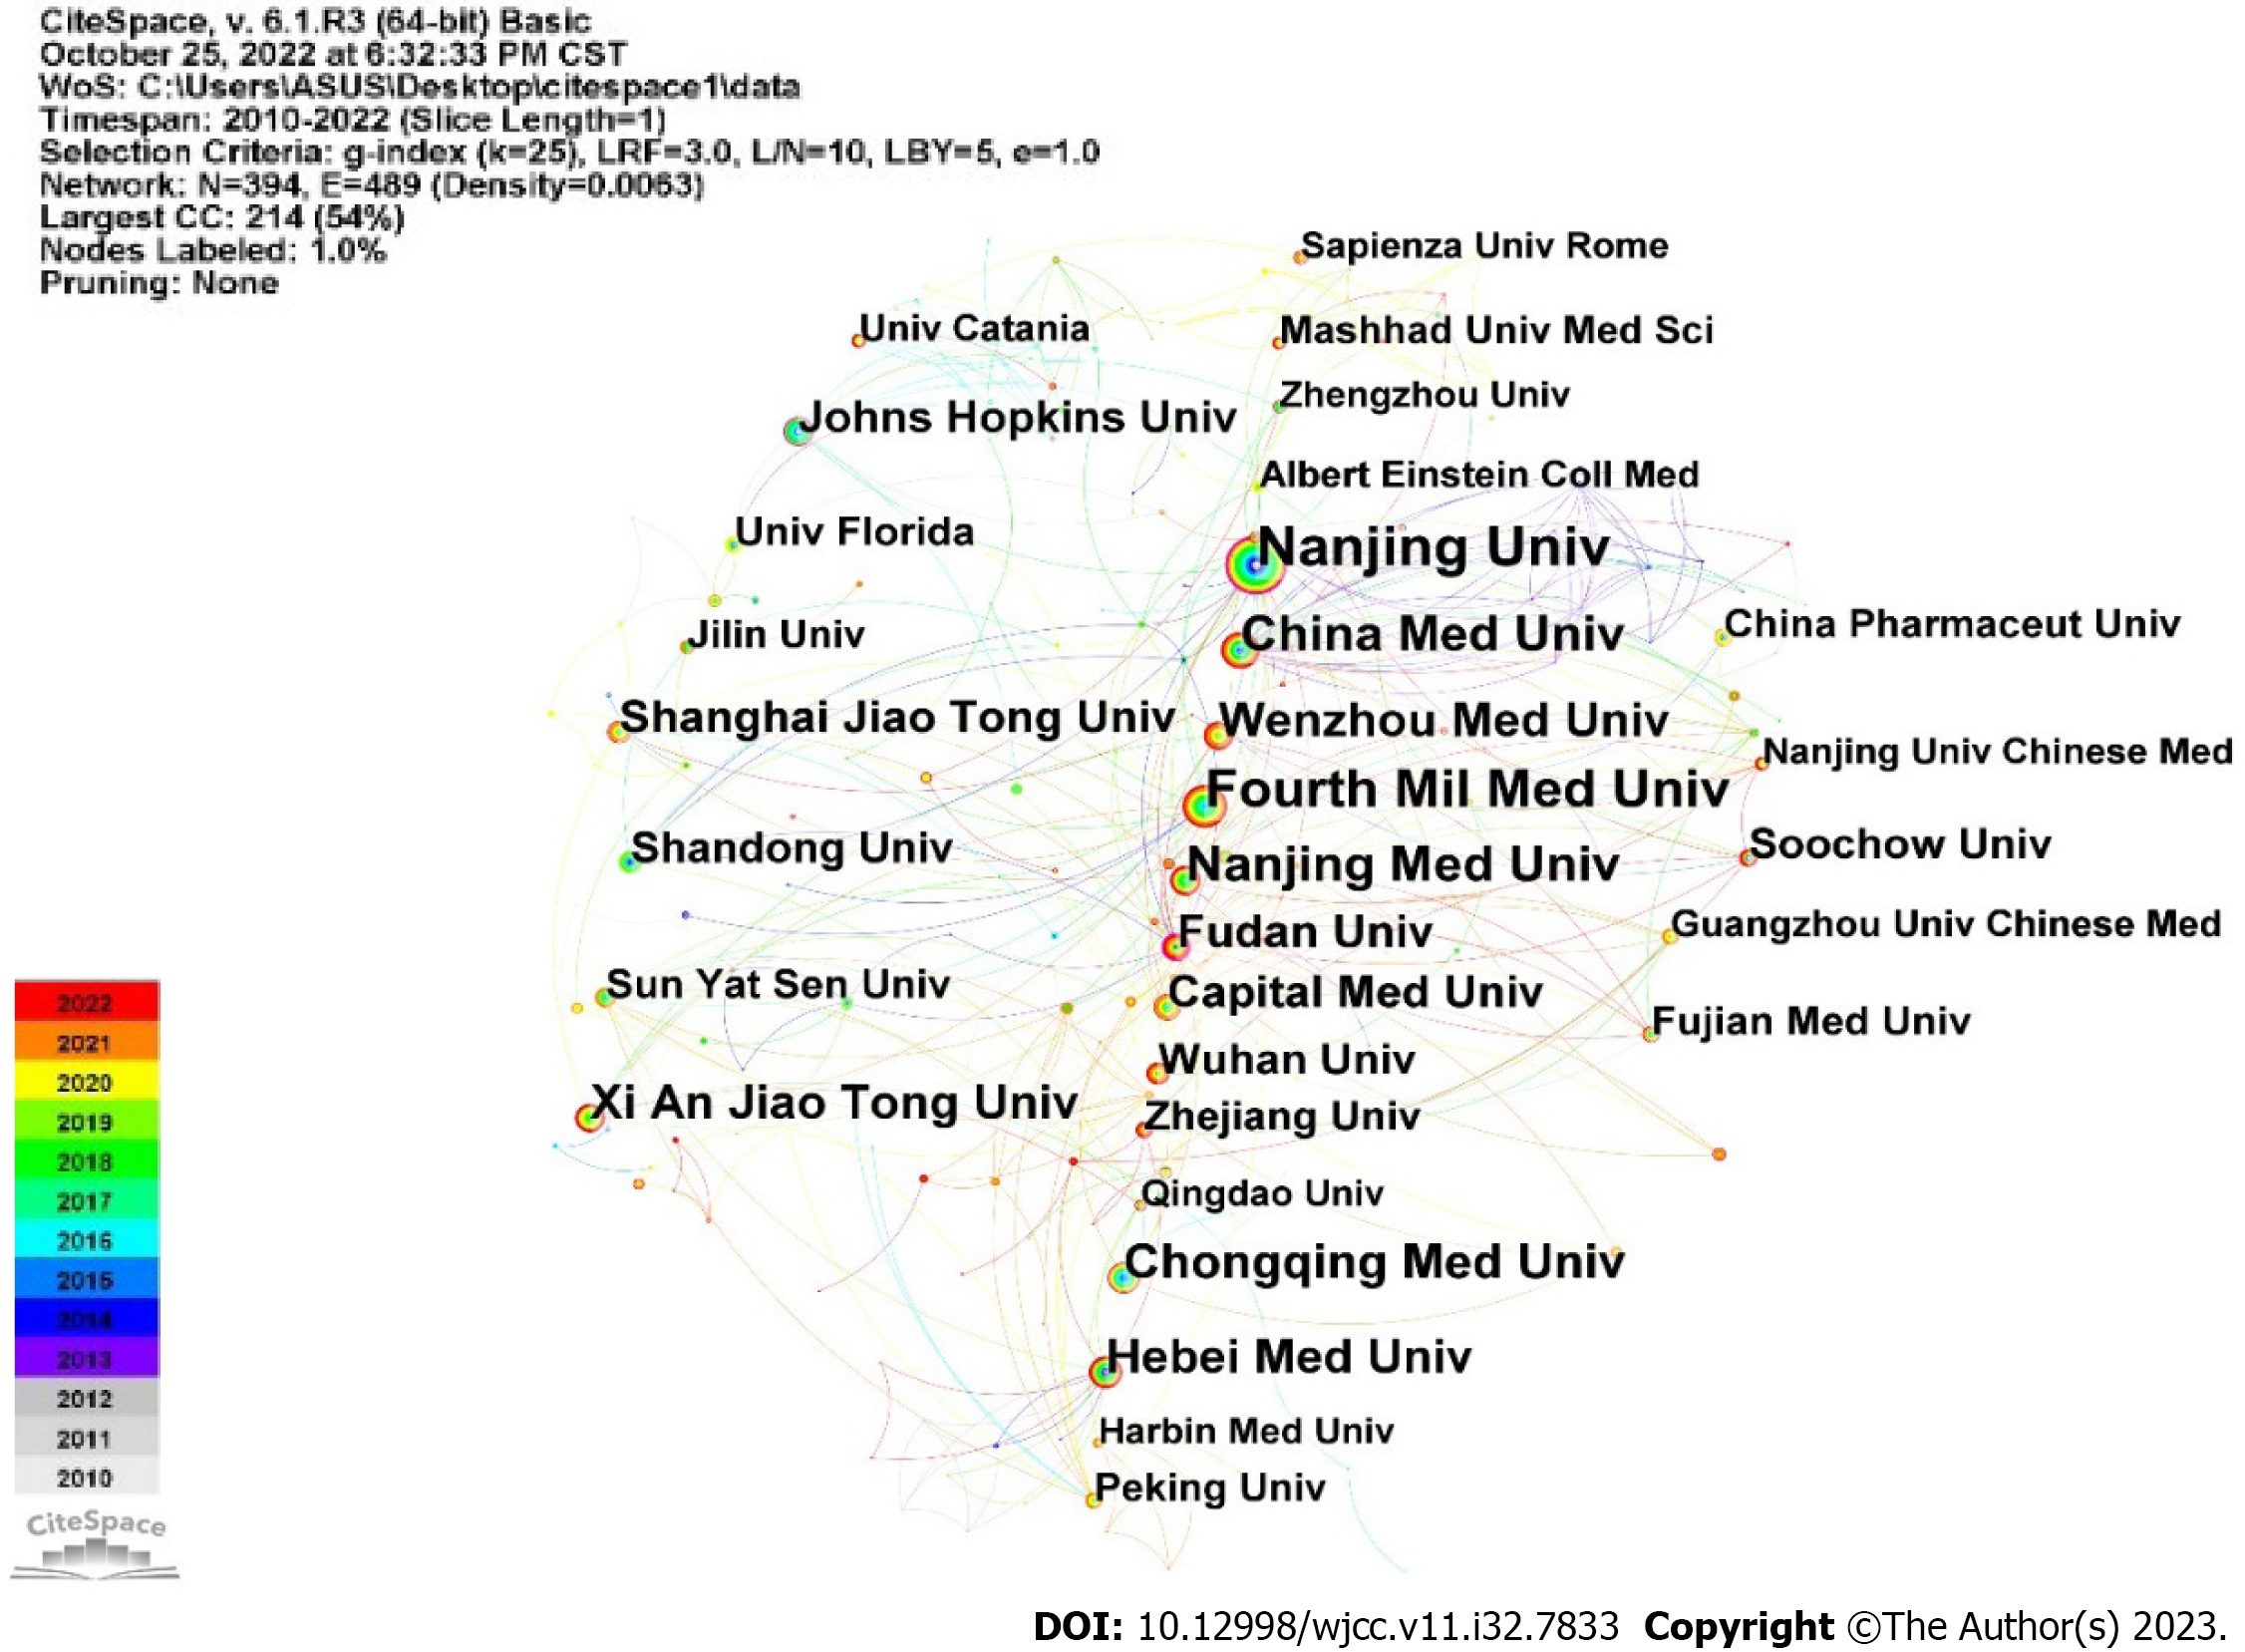
Figure 5 Institutional publications.
The quantity of articles is indicated by the node size. The quantity of articles increases with node size. Nanjing University produced most papers, followed by Fourth Military Medical University, Nanjing Medical University, China Medical University, and Chongqing Medical University. Additional nations are displayed in a counterclockwise sequence. The cooperation between various institutions is represented by lines between the nodes.
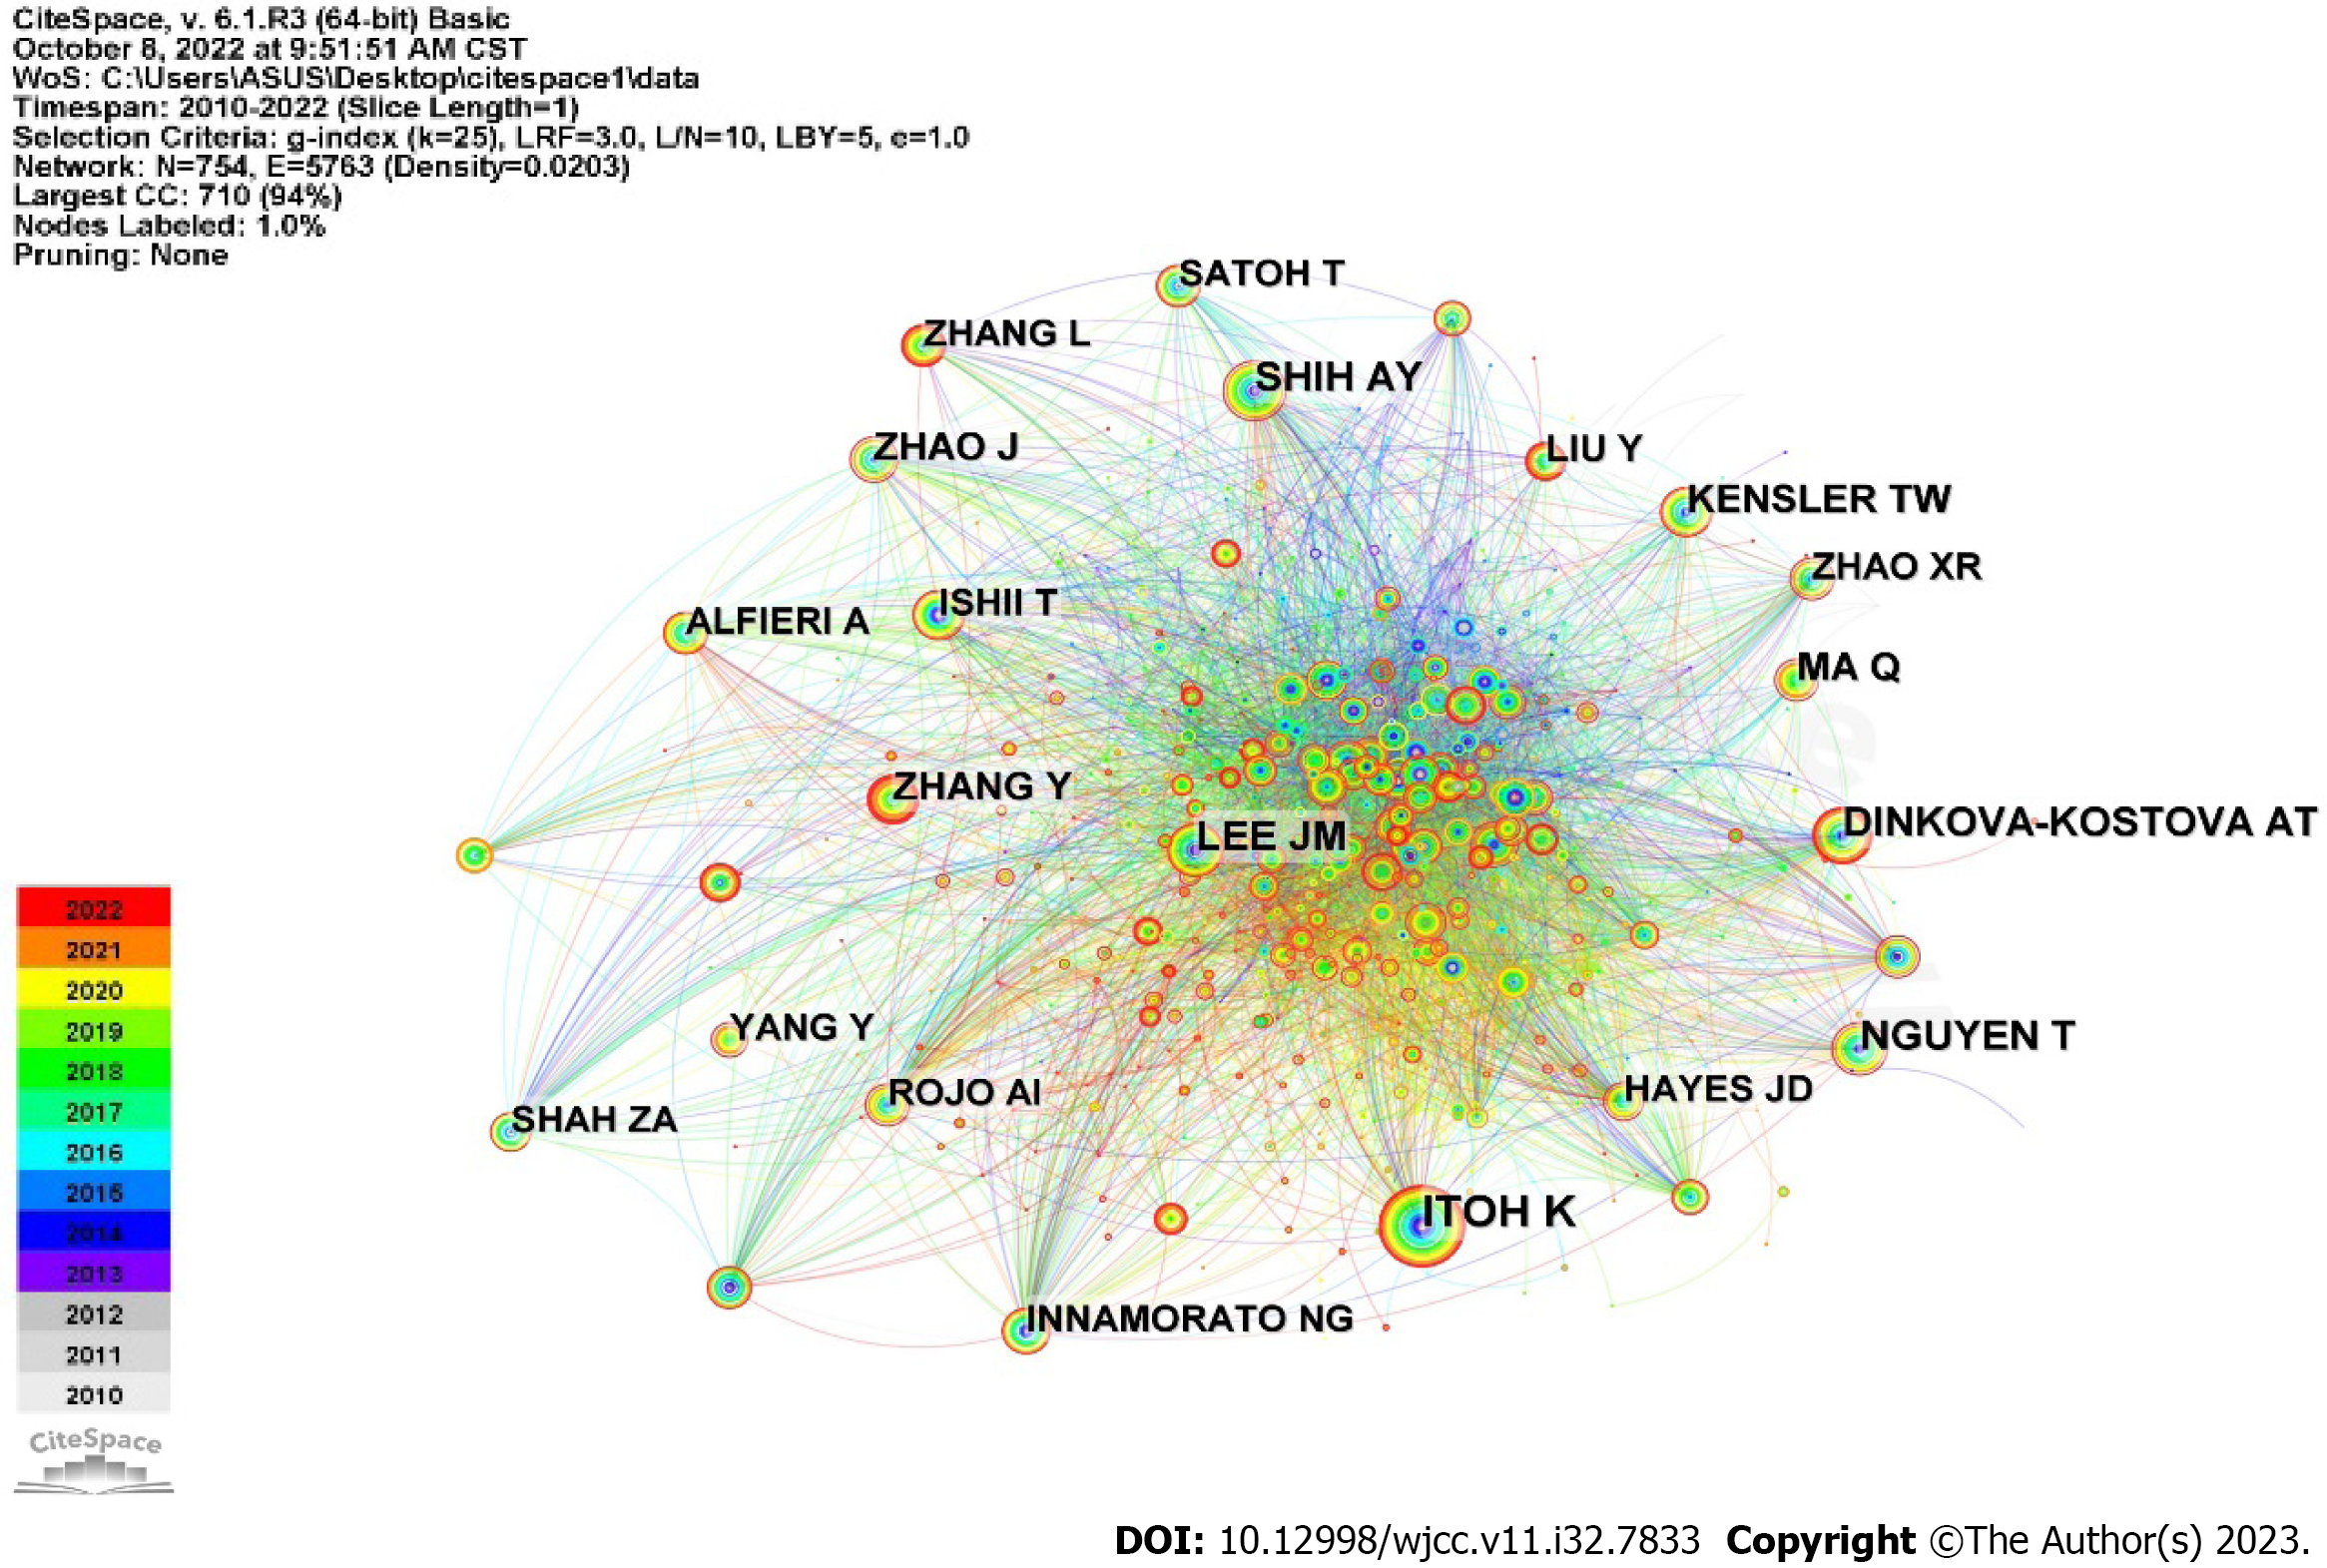
Figure 6 Network of co-cited authors.
Co-cited authors are represented by nodes. The number of citations is indicated by the size of the node. Collaboration between authors is represented by lines connecting nodes.
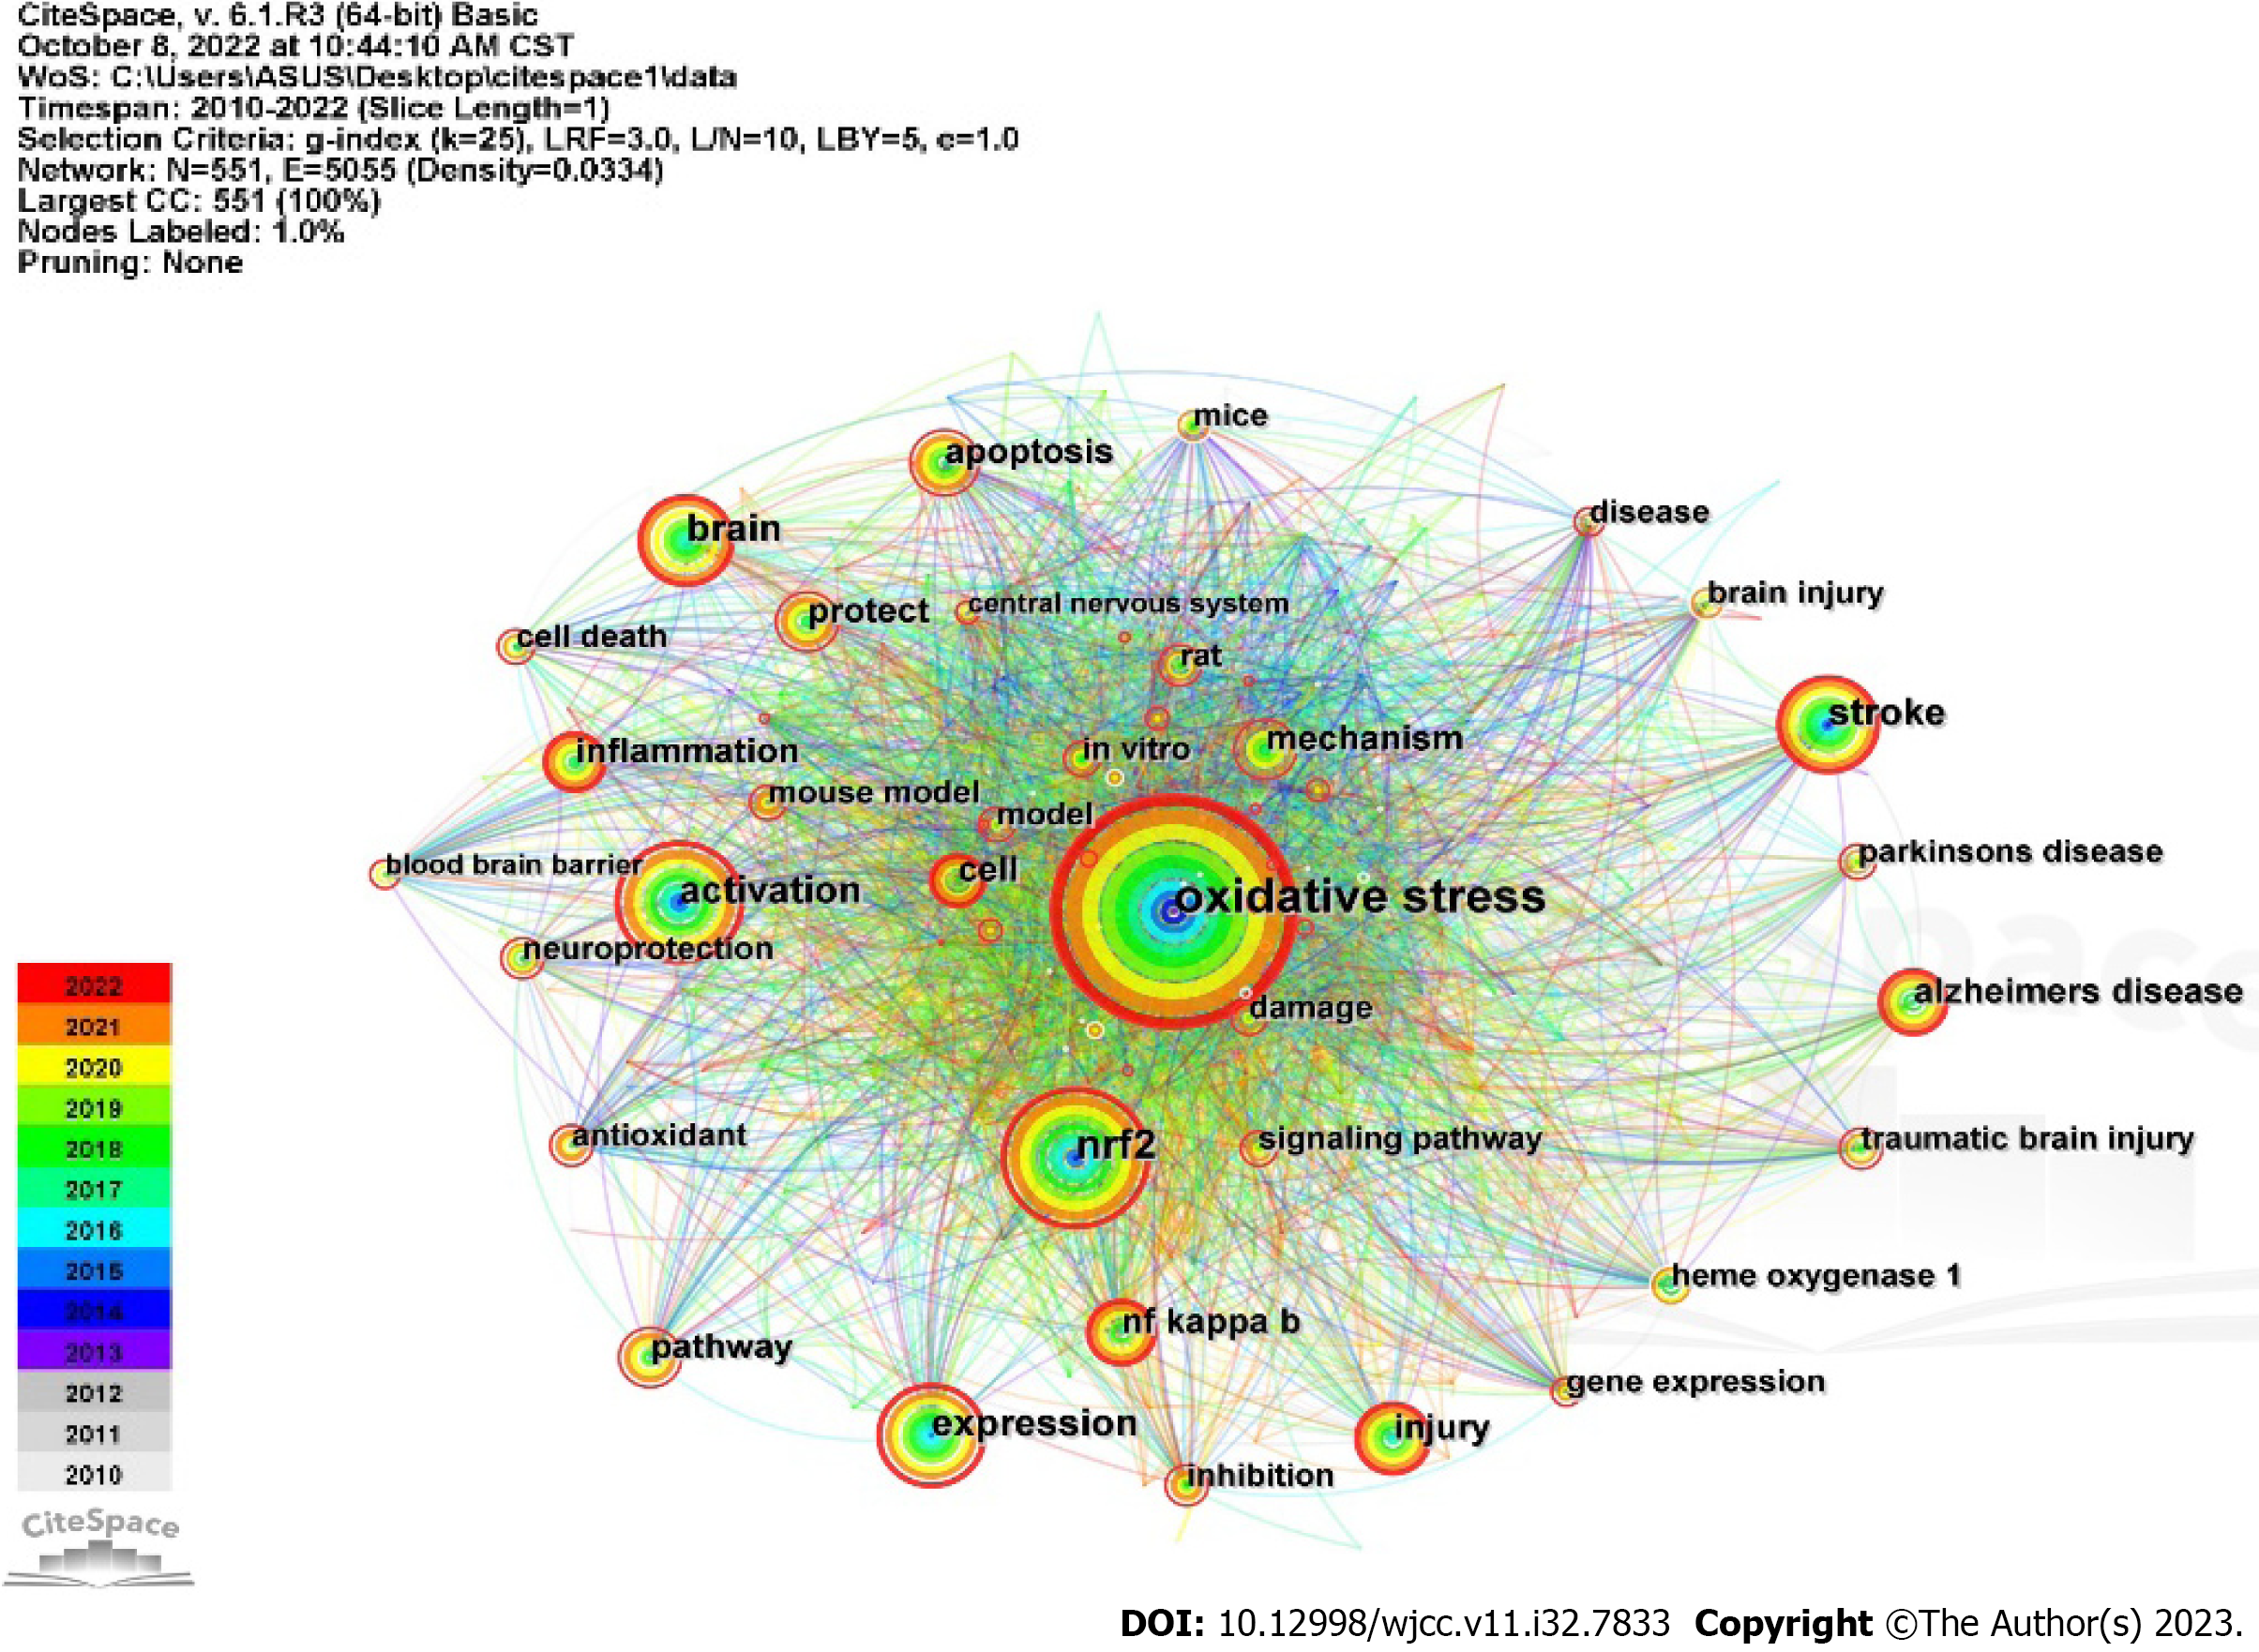
Figure 7 Co-occurrence network of keywords.
The number of keywords is indicated by the node size. Multiple sclerosis, Alzheimer's disease, Parkinson's disease, stroke, and traumatic brain injury are the top 8 comorbid keywords. The primary disorders linked to nuclear factor erythroid 2-related factor 2 (NRF2) are depicted in the right side of the diagram, including "Alzheimer's disease," "stroke," "traumatic brain injury," and "Parkinson's disease." Apoptosis, neuroprotection, and inflammation are some of the key terms associated with the mechanism of NRF2 activation that are depicted on the left side of the figure.
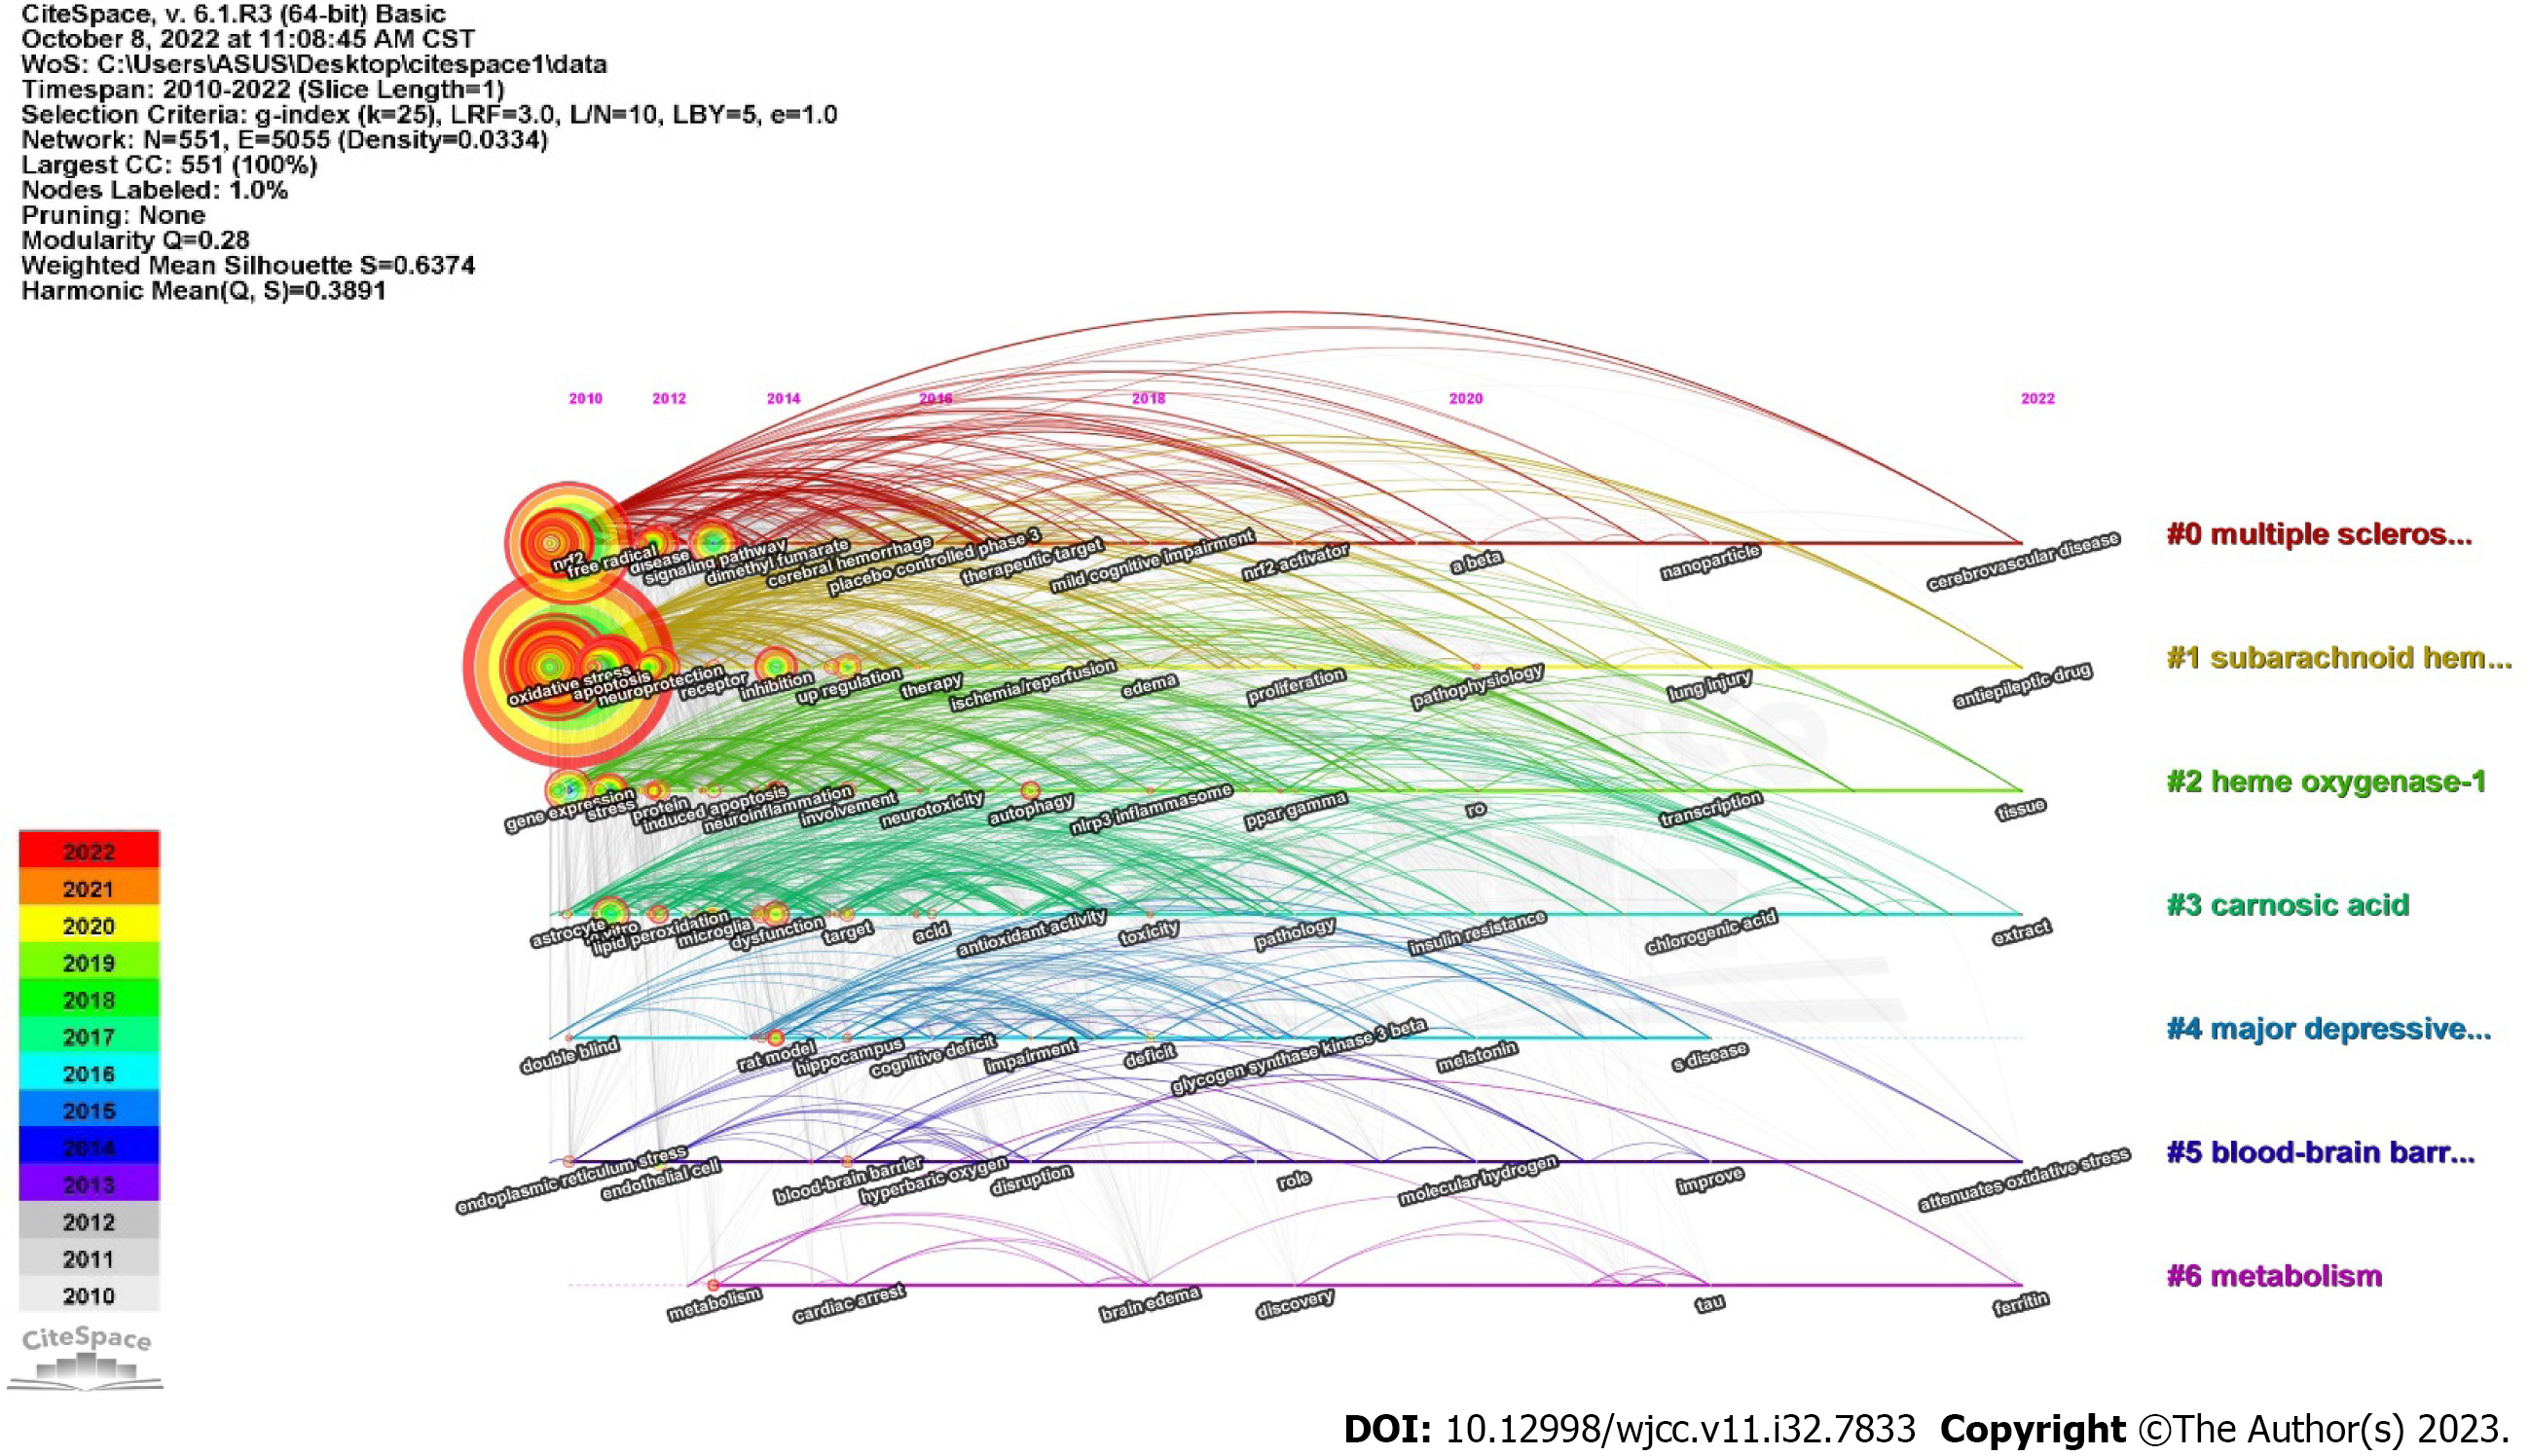
Figure 8 Timeline analysis with keyword clustering (2010-2022).
Eight clusters altogether, each identified by a unique color. The biggest cluster is cluster 0, then cluster 1, and so on. The keywords contained in the cluster are spread out by this timeline map as it forms. The label color of the cluster to which a keyword belongs is the same as that of the cluster.
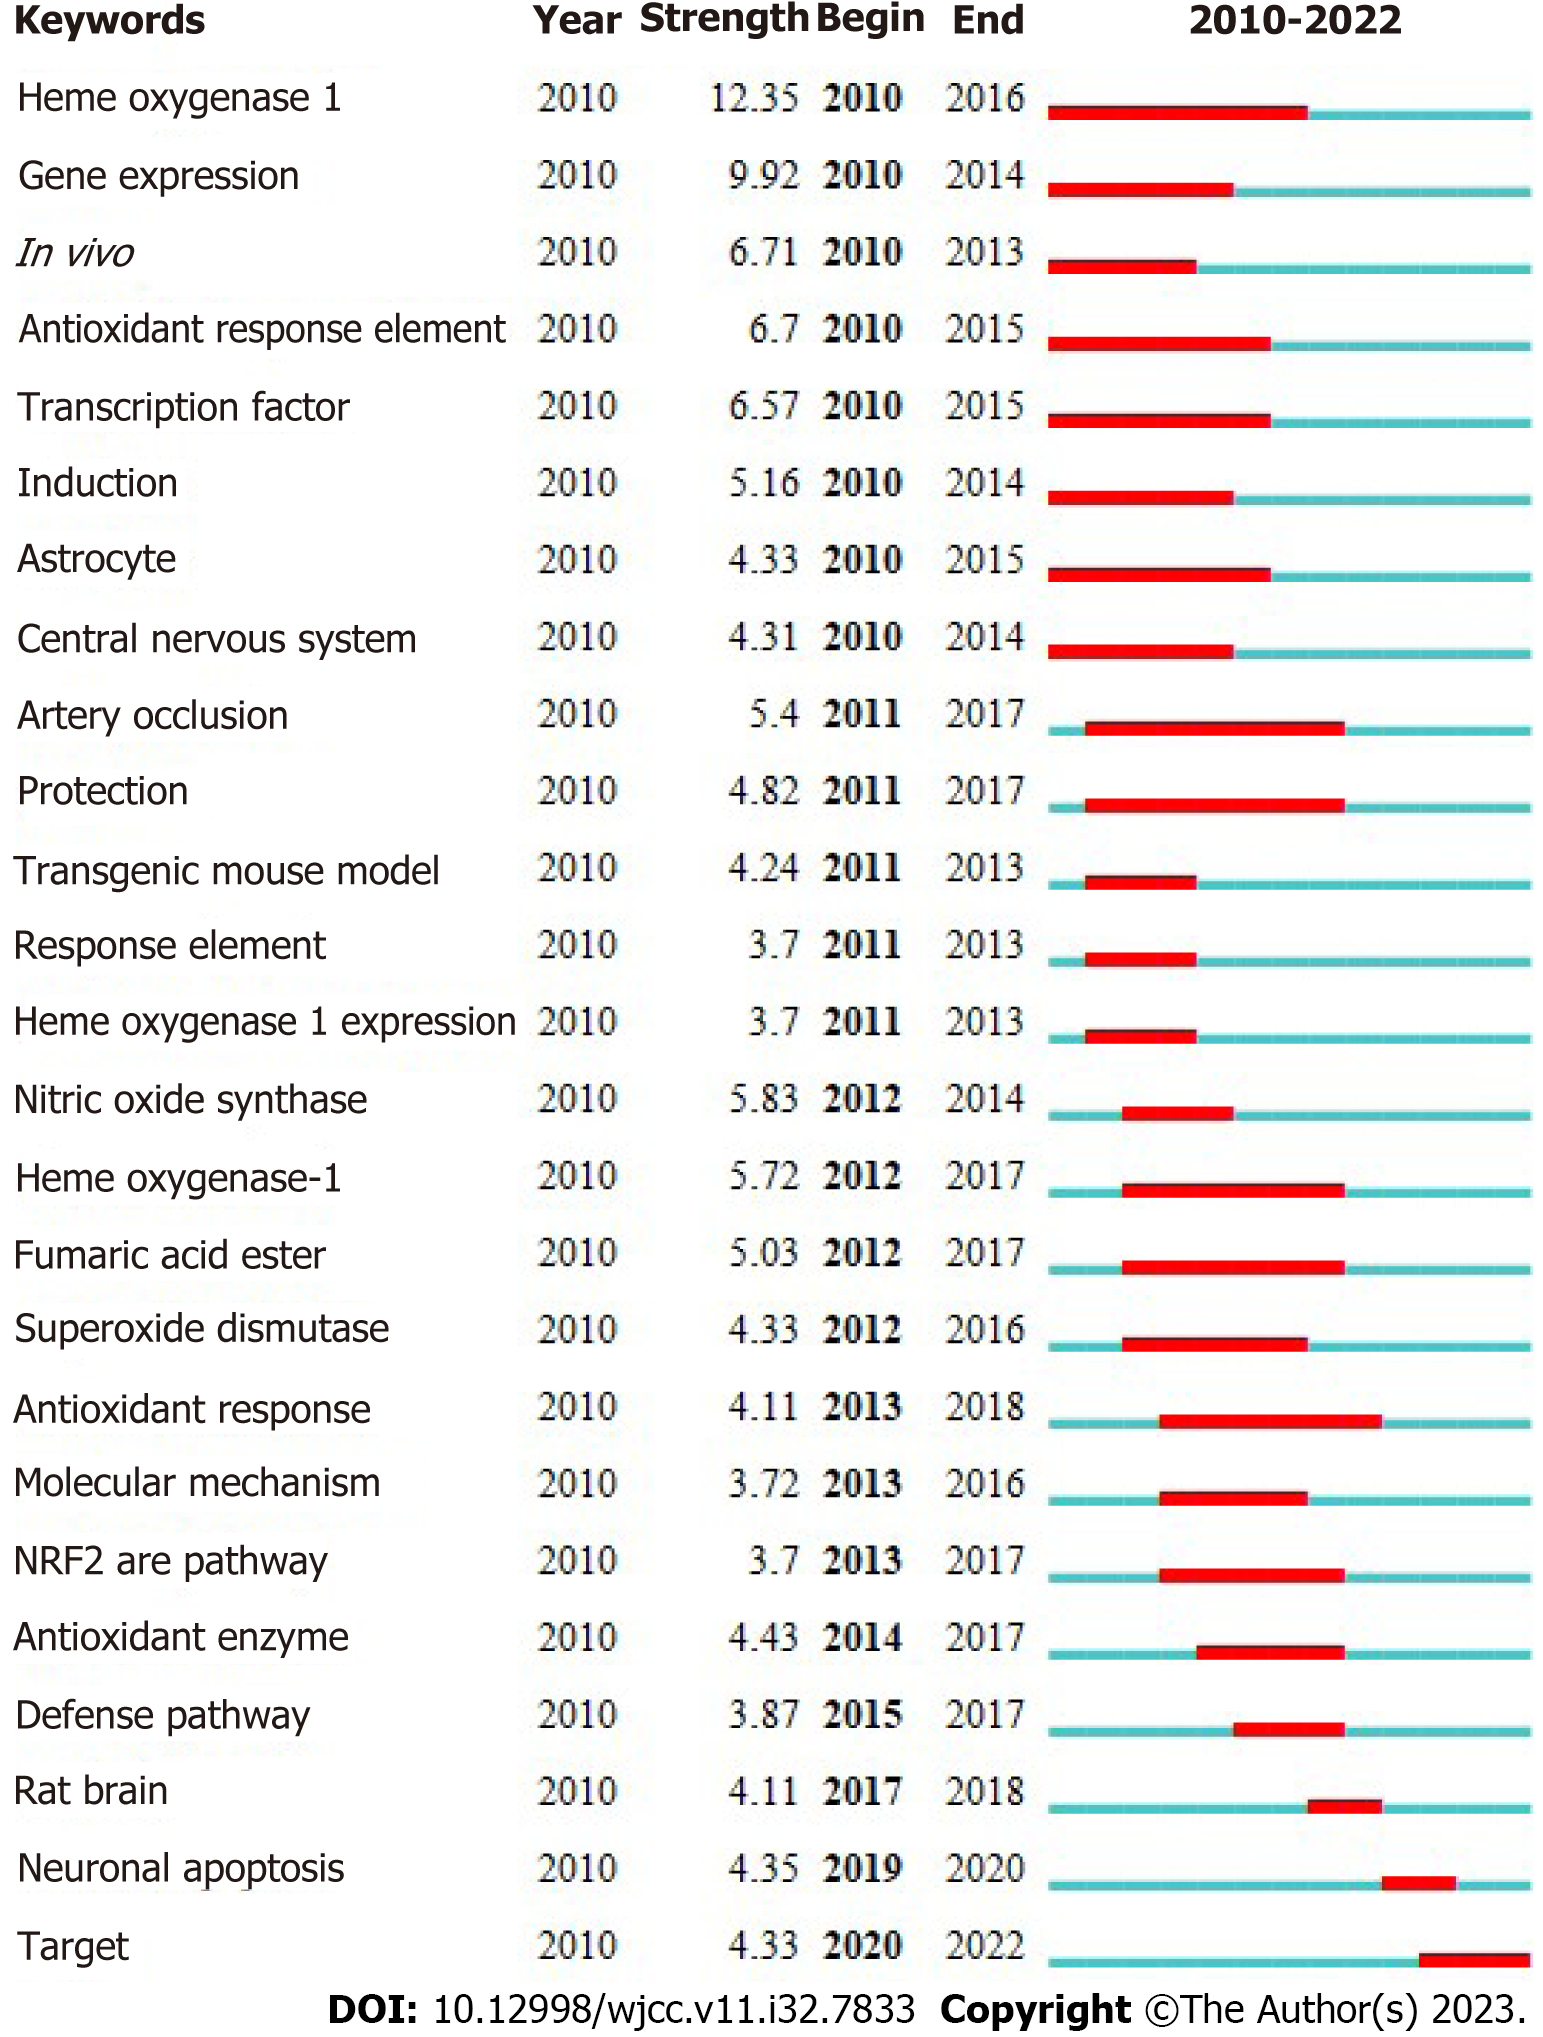
Figure 9 Top 25 terms with the most citations.
Burst data indicate an increase in citations for particular keywords over time. In other words, research in this area has received a lot of attention. This is a sign of the state of the scientific frontier at any given time. Blue lines indicate cycles and red lines indicate the duration of citation bursts. Numbers in parentheses represent higher burst strength values.
- Citation: Chang XQ, Xu L, Zuo YX, Liu YG, Li J, Chi HT. Emerging trends and hotspots of Nuclear factor erythroid 2-related factor 2 in nervous system diseases. World J Clin Cases 2023; 11(32): 7833-7851
- URL: https://www.wjgnet.com/2307-8960/full/v11/i32/7833.htm
- DOI: https://dx.doi.org/10.12998/wjcc.v11.i32.7833


