Copyright
©The Author(s) 2023.
World J Clin Cases. Oct 16, 2023; 11(29): 7004-7016
Published online Oct 16, 2023. doi: 10.12998/wjcc.v11.i29.7004
Published online Oct 16, 2023. doi: 10.12998/wjcc.v11.i29.7004
Figure 1 Flowchart of sample selection from the MJ chronic kidney disease study cohort.
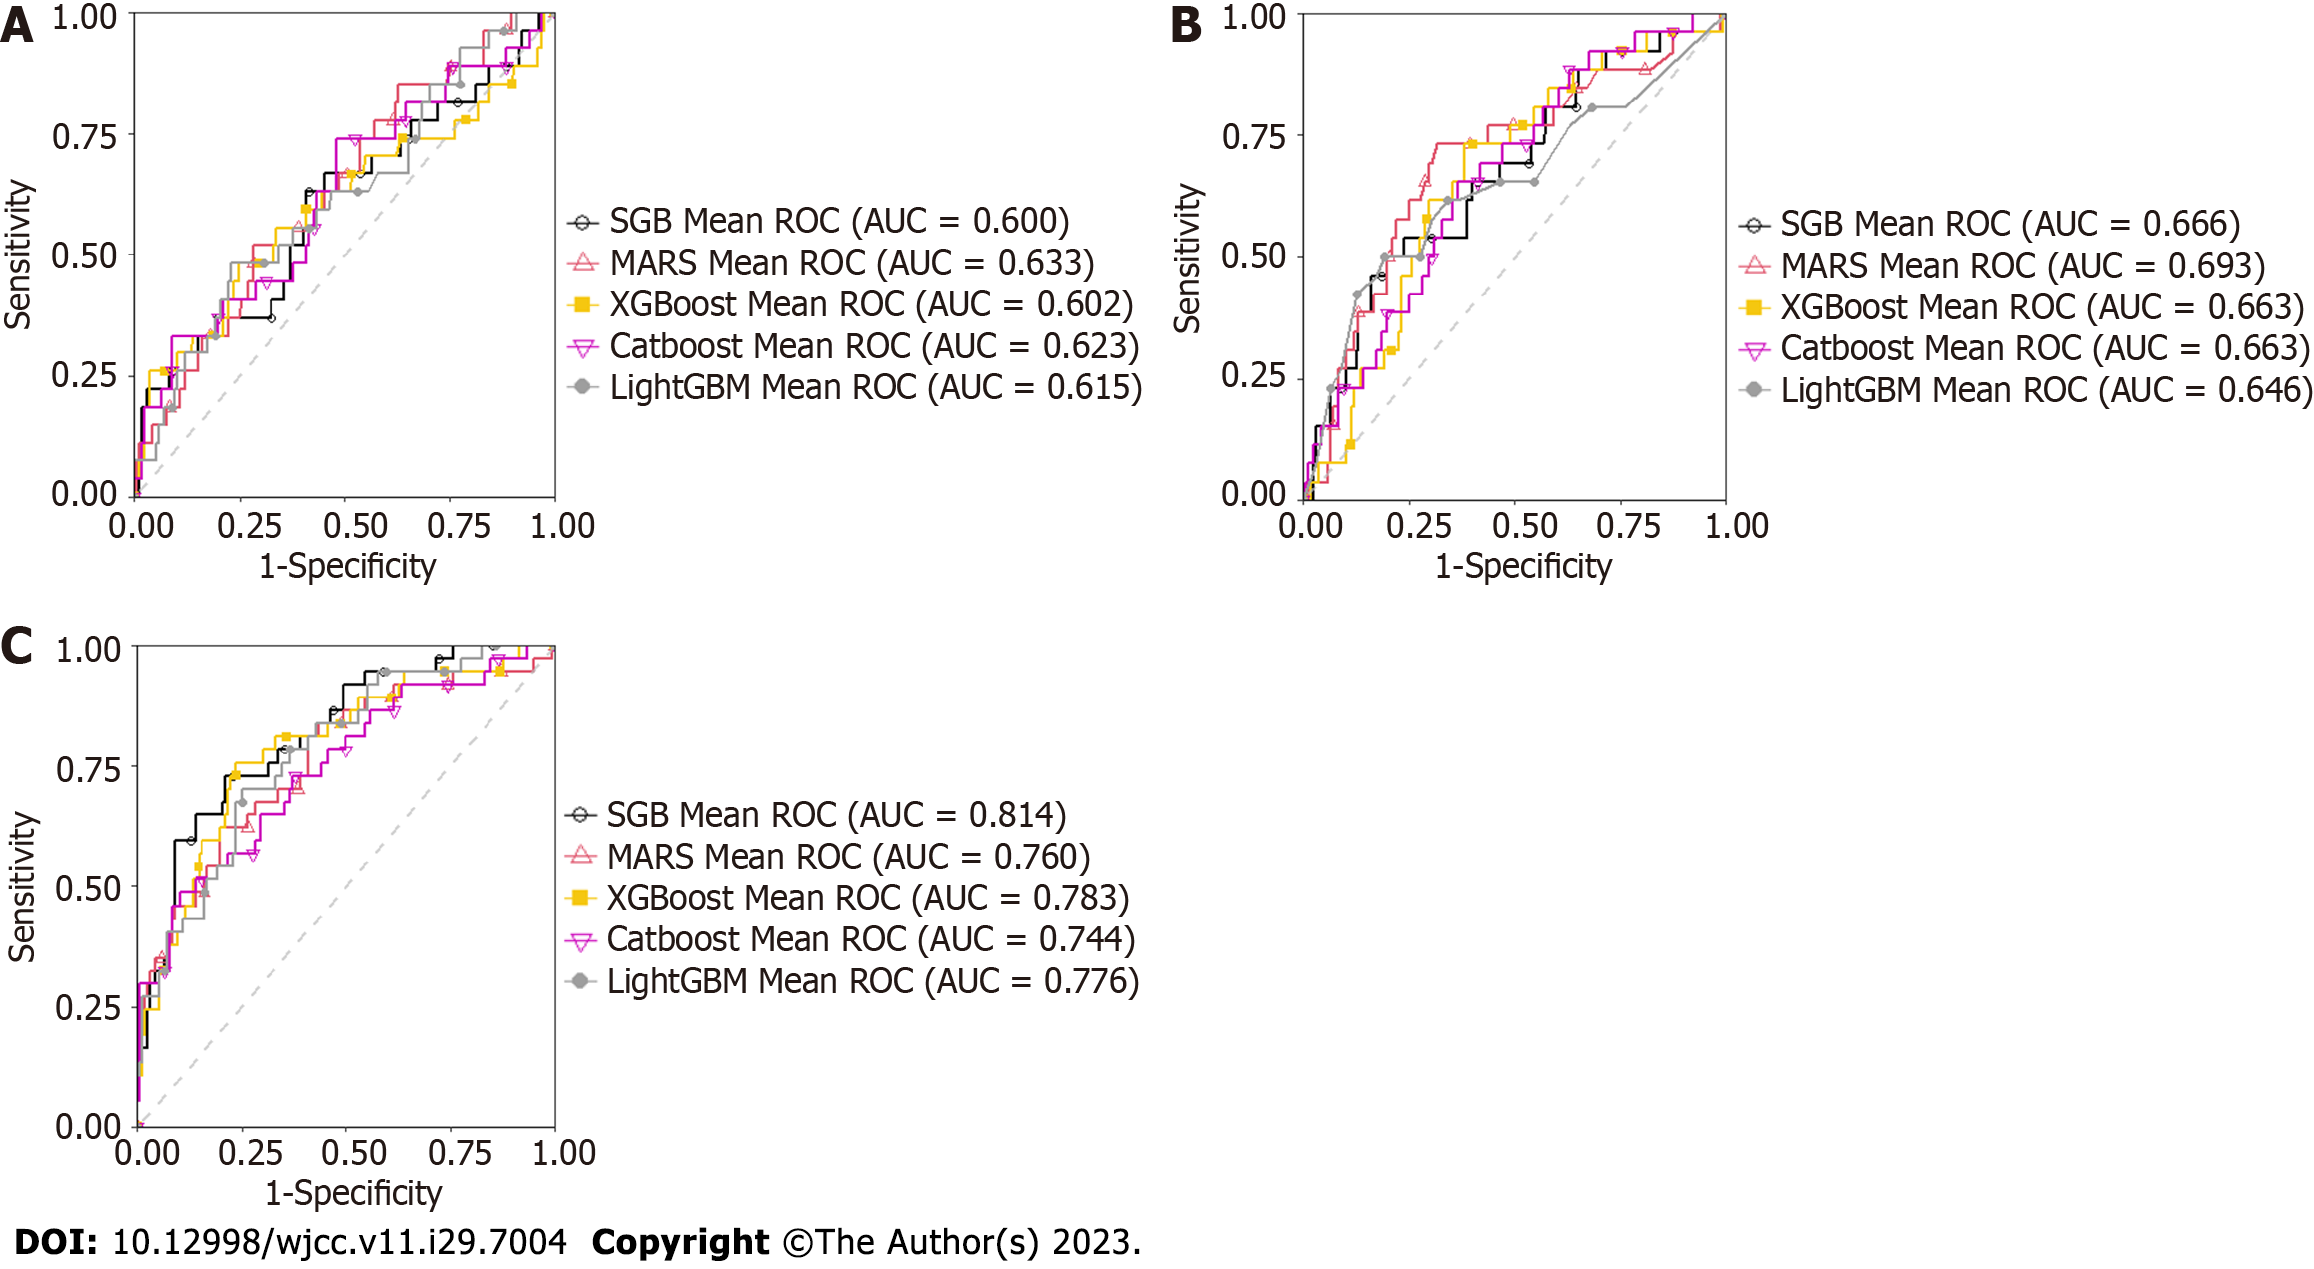
Figure 2 Area under receiver operating characteristic curve derived from five different machine learning methods in different models.
A: Model 1; B: Model 2; C: Model 3. MARS: Multivariate adaptive regression splines; XGBoost: eXtreme Gradient Boosting; SGB: Stochastic gradient boosting; LightGBM: Light Gradient Boosting Machine; CATboost: Categorical Features + Gradient Boosting. Model 1: Demographic and biochemistry data; Model 2: Model 1 + lifestyle factors; Model 3: Model 2 + inflammation factors.
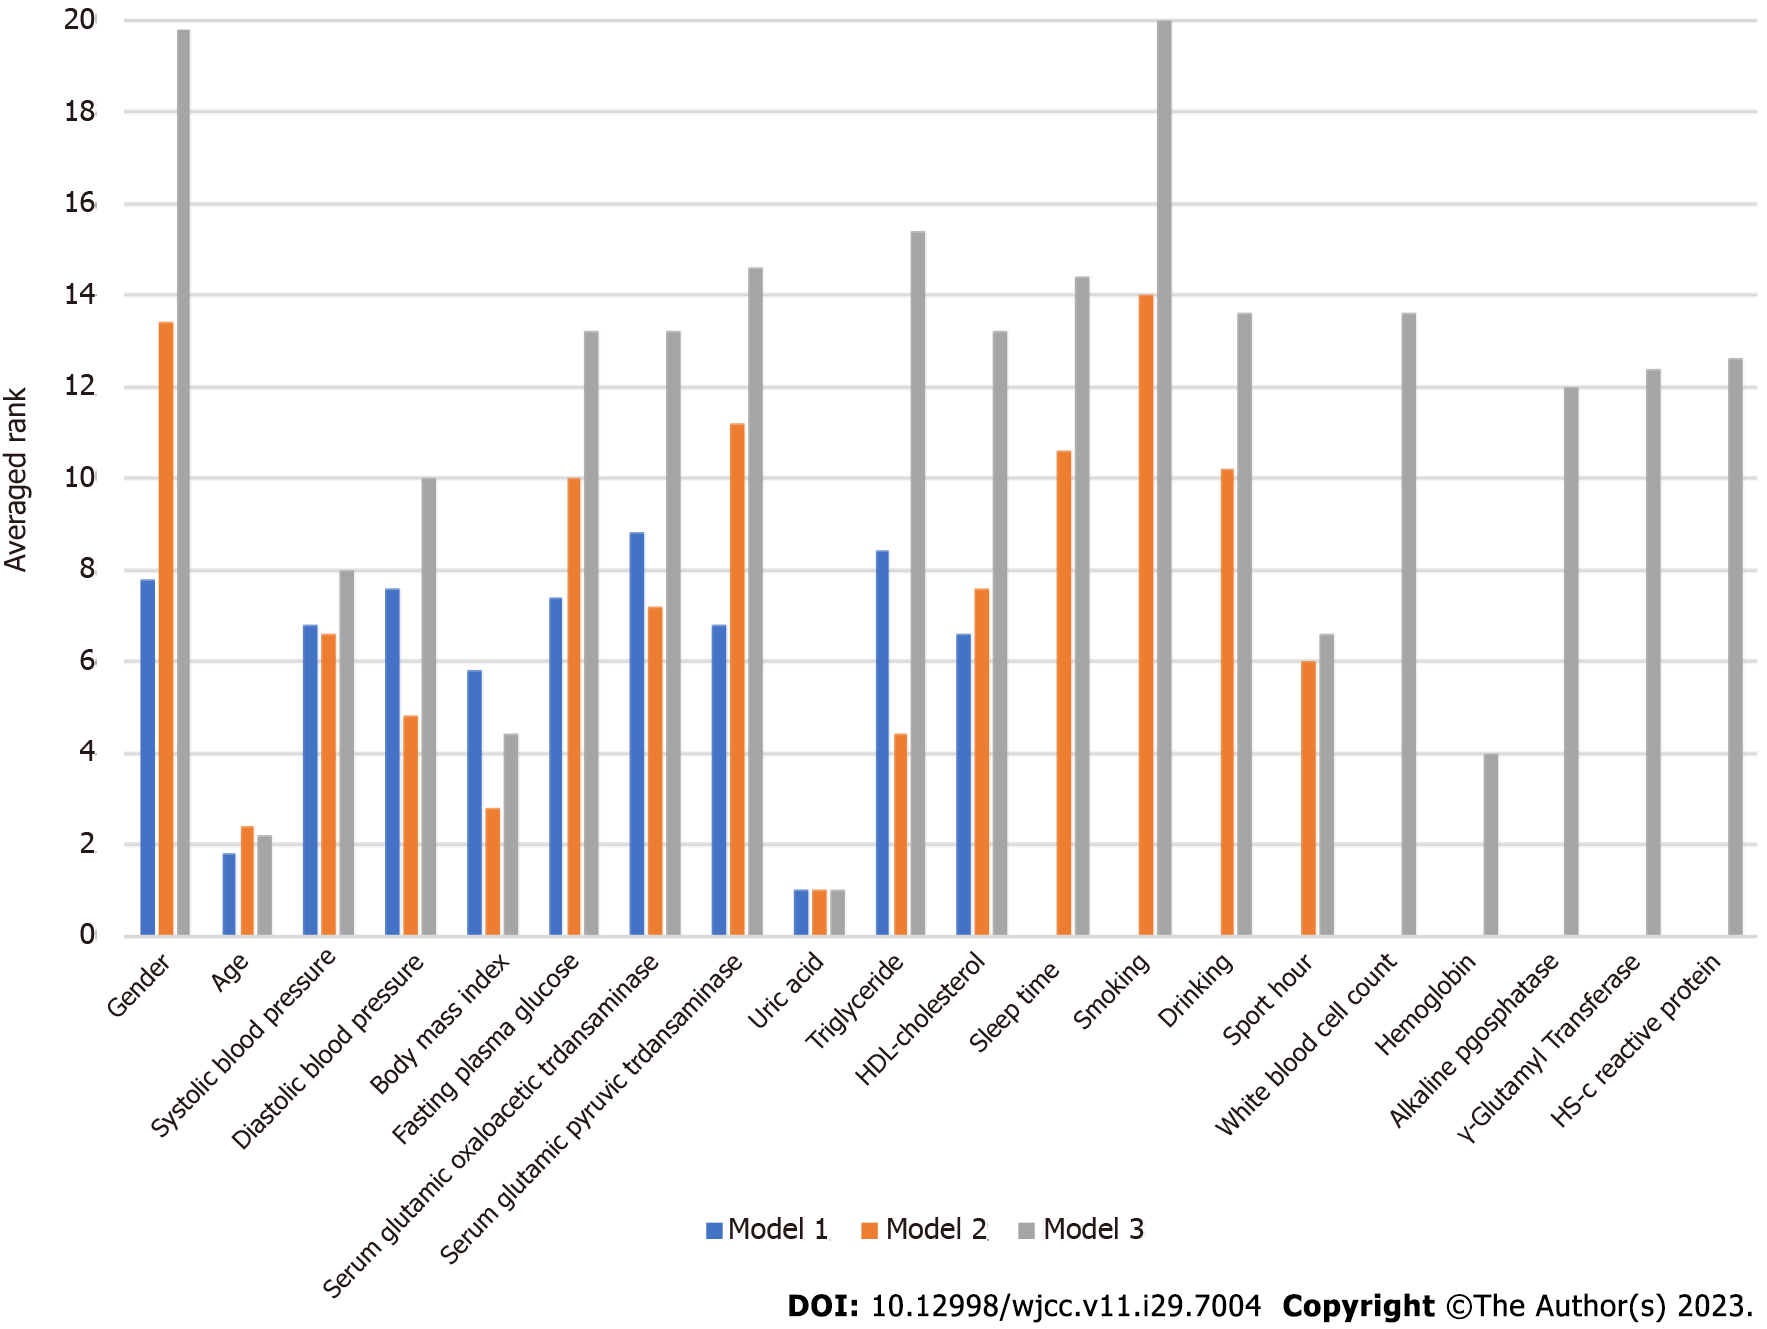
Figure 3 Averaged ranks of importance for each risk factor in three different models.
Model 1: Demographic and biochemistry data; Model 2: Model 1 + lifestyle factors; Model 3: Model 2 + inflammation factors.
- Citation: Chen CH, Wang CK, Wang CY, Chang CF, Chu TW. Roles of biochemistry data, lifestyle, and inflammation in identifying abnormal renal function in old Chinese. World J Clin Cases 2023; 11(29): 7004-7016
- URL: https://www.wjgnet.com/2307-8960/full/v11/i29/7004.htm
- DOI: https://dx.doi.org/10.12998/wjcc.v11.i29.7004


