Copyright
©The Author(s) 2023.
World J Clin Cases. Sep 26, 2023; 11(27): 6344-6362
Published online Sep 26, 2023. doi: 10.12998/wjcc.v11.i27.6344
Published online Sep 26, 2023. doi: 10.12998/wjcc.v11.i27.6344
Figure 1 Flow chart of data collection and analysis.
KEGG: Kyoto Encyclopedia of Genes and Genomes; GO: Gene ontology; PPI: Protein–protein interaction.
Figure 2
The intersections of differentially expressed genes among the GSE36765, GSE20086, and GSE10810 gene sets.
Figure 3 Gene Ontology and Kyoto Encyclopedia of Genes and Genomes enrichment analysis of the overlapping differentially expressed genes.
Significantly enriched Gene Ontology (GO) terms of differentially expressed genes (DEGs), A: Biological process terms; B: Cell component terms; D: Molecular function terms. The x-axis represents the significantly enriched GO terms and the y-axis is the number of enriched DEGs; C: Kyoto Encyclopedia of Genes and Genomes (KEGG) pathway enrichment analysis of overlapping DEGs. The x-axis indicates the number of DEGs involved in the significant KEGG pathway; the larger the circle, the more that the DEGs are enriched. BP: Biological process; CC: Cell component; MF: Molecular function.
Figure 4 Screening of hub genes.
A: Protein–protein interaction (PPI) network of the dysregulated genes. Blue diamonds, downregulated genes; red ellipses, upregulated genes; yellow rectangles, down/upregulated genes; B: Hub genes were screened from the PPI network using the Closeness and Degree methods.
Figure 5 Calreticulin, chromodomain helicase DNA binding protein 4, eukayotic translation elongation factor 1 alpha 1, epidermal growth factor receptor, heat shock protein family B member 1, insulin-like growth Factor 1, interleukin-1 receptor 1, Krüppel-like factor 4, mesencephalic astrocyte-derivedneurotrophic factor, pyruvate kinase M1/2, protein tyrosine phosphatase receptor type C, signal peptidase complex subunit gene 11 homolog C, suppressor of cytokine signaling 3, posphoinositide-3-kinase regulatory subunit 1, and triosephosphate isomerase 1 expression in breast cancer matched The Cancer Genome Atlas normal and GTEx data based on the GEPIA database.
CALR: Calreticulin; CHD4: Chromodomain helicase DNA binding protein 4; EEF1A1: Eukayotic translation elongation factor 1 alpha 1; EGFR: Epidermal growth factor receptor; HSPB1: Heat shock protein family B member 1; IGF1: Insulin-like growth Factor 1; IL1R1: Interleukin-1 receptor 1; KLF4: Krüppel-like factor 4; MANF: Mesencephalic astrocyte-derivedneurotrophic factor; PKM: Pyruvate kinase M1/2; PTPRC: Protein tyrosine phosphatase receptor type C; SEC11C: Signal peptidase complex subunit gene 11 homolog C; SOCS3: Suppressor of cytokine signaling 3; PIK3R1: Posphoinositide-3-kinase regulatory subunit 1; TPI1: Triosephosphate isomerase 1.
Figure 6 Calreticulin, heat shock protein family B member 1, insulin-like growth Factor 1, interleukin-1 receptor 1, Krüppel-like factor 4, suppressor of cytokine signaling 3, and triosephosphate isomerase 1 expression in patients at different T-stages.
CALR: Calreticulin; HSPB1: Heat shock protein family B member 1; IGF1: Insulin-like growth Factor 1; IL1R1: Interleukin-1 receptor 1; KLF4: Krüppel-like factor 4; SOCS3: Suppressor of cytokine signaling 3; TPI1: Triosephosphate isomerase 1.
Figure 7 Top 20 Gene Ontology terms (Biological process) of the differential genes using DAVID analysis.
A: Blue/red circles, the genes involved in the Gene Ontology (GO) terms; B: Chord plot depicting the relationship between genes and GO terms of biological process.
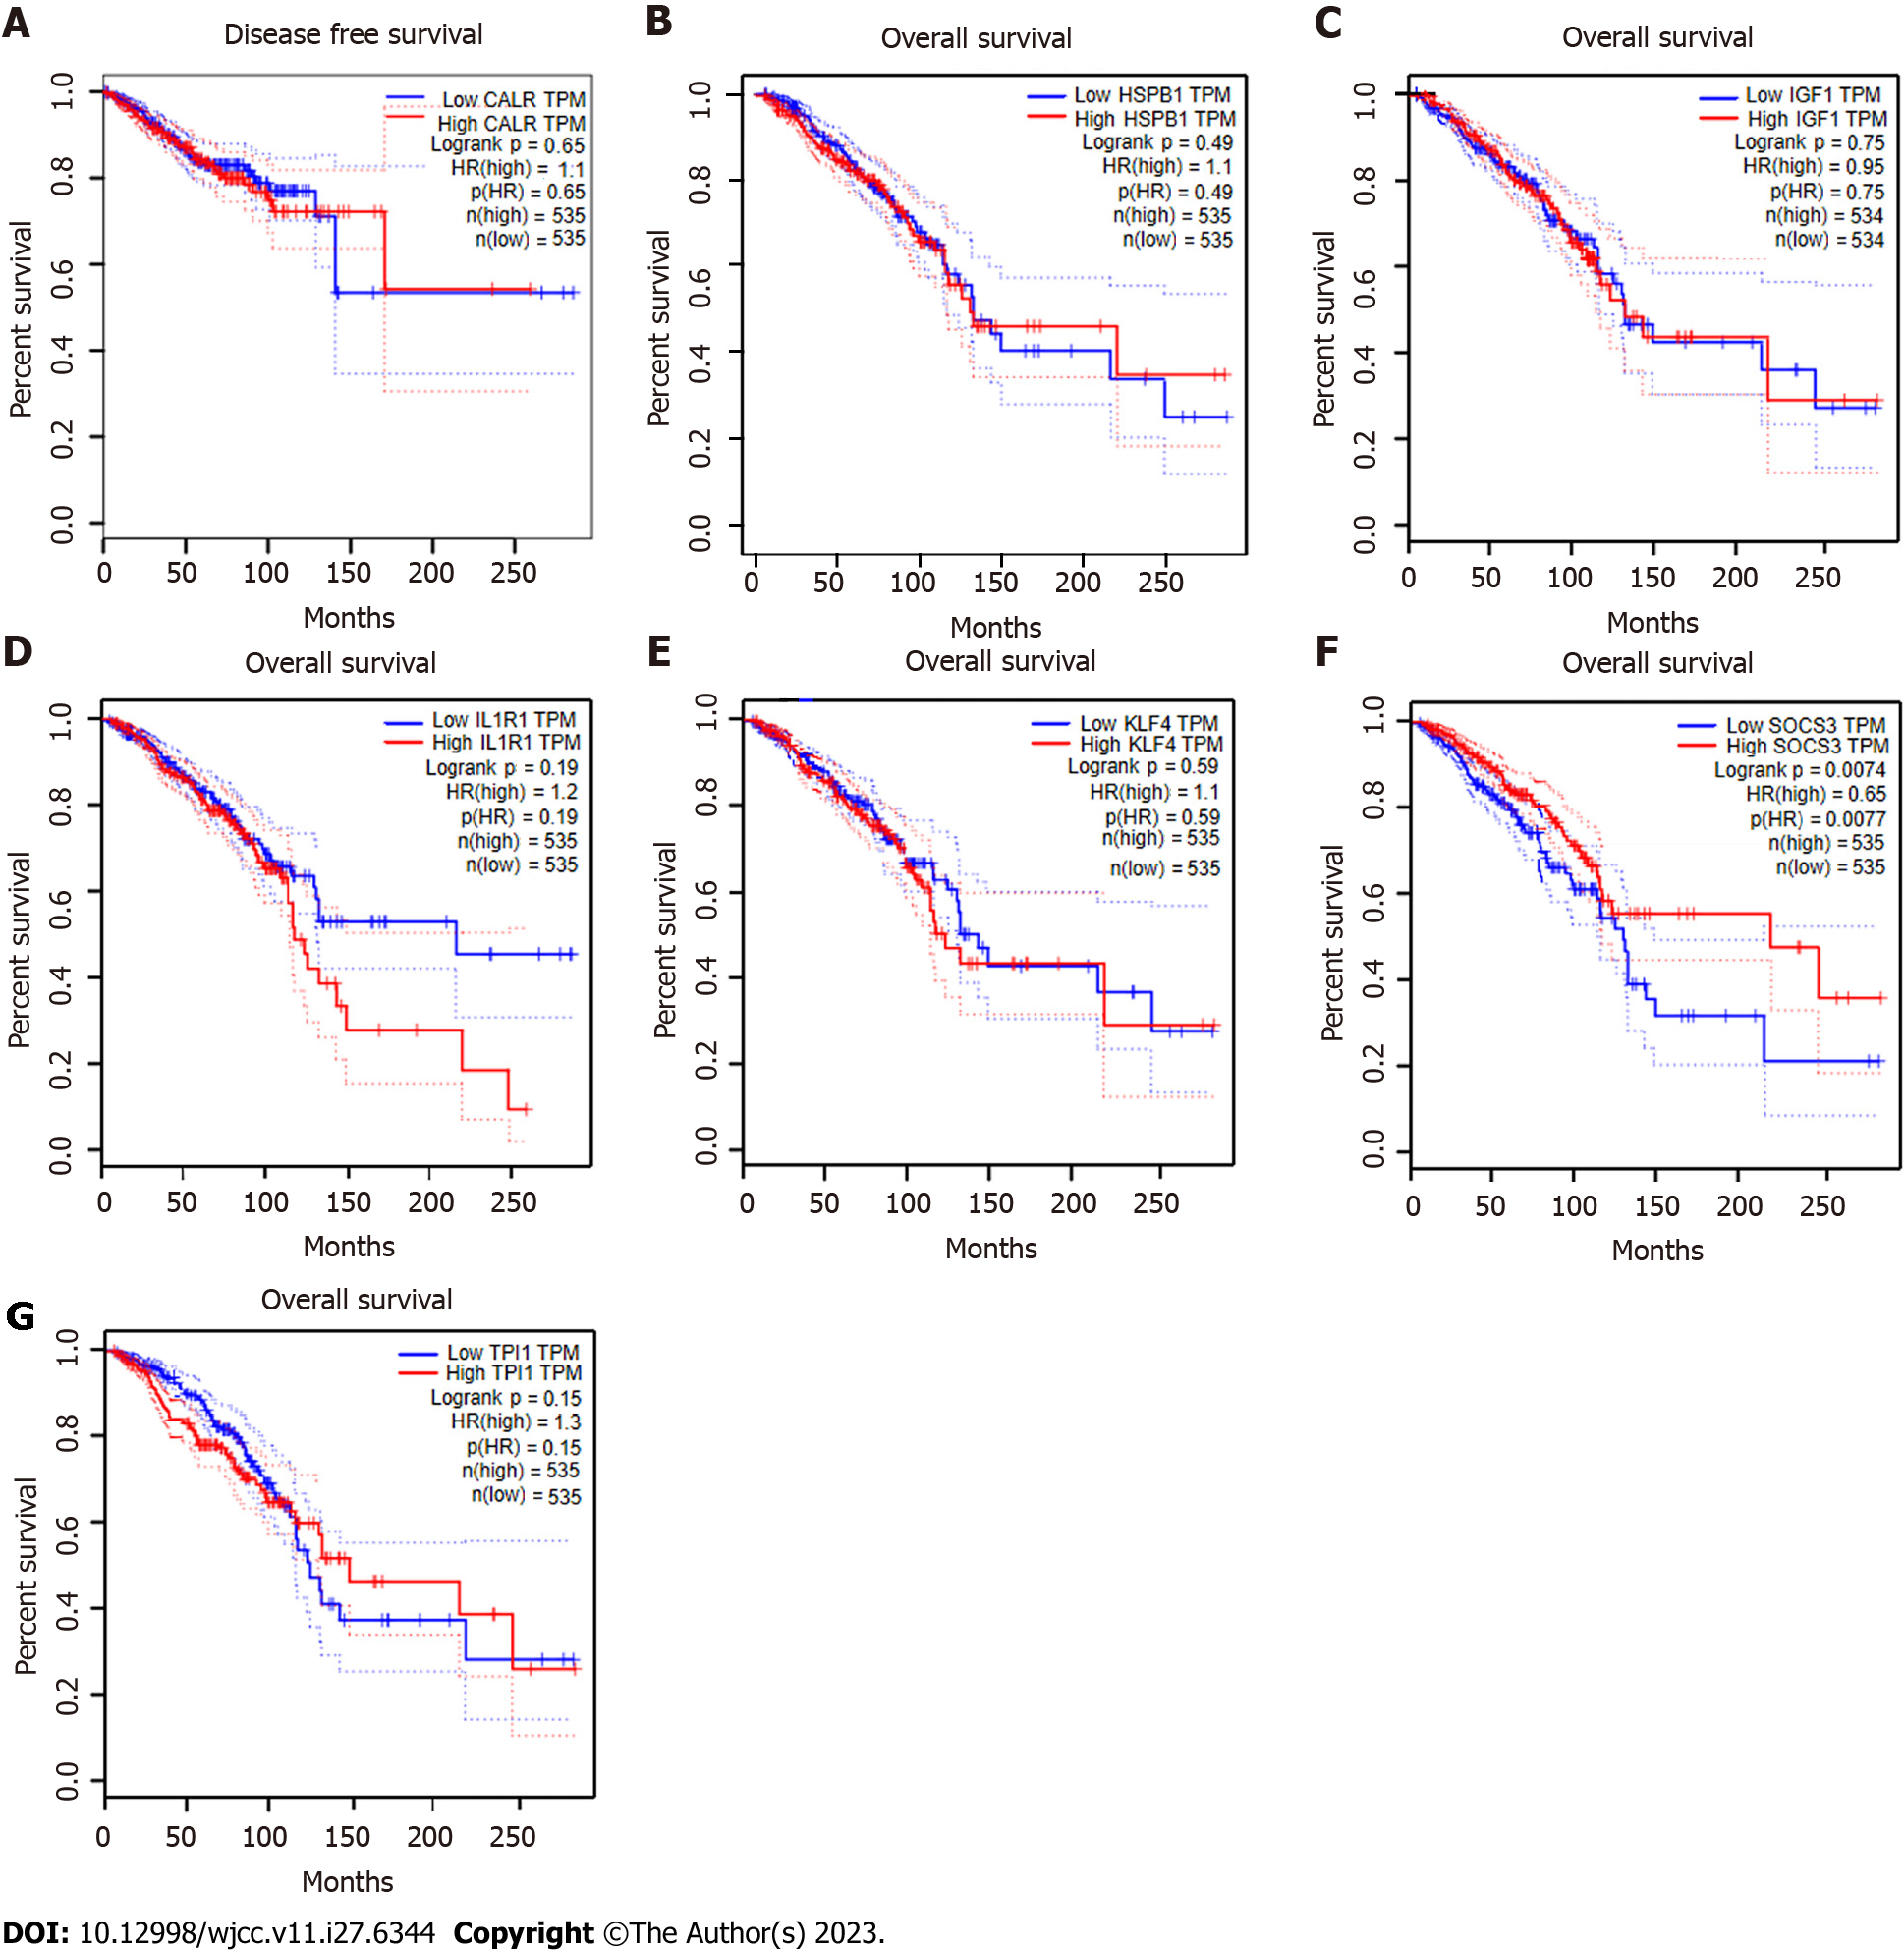
Figure 8 Overall survival analysis of seven central genes (calreticulin, heat shock protein family B member 1, insulin-like growth Factor 1, interleukin-1 receptor 1, Krüppel-like factor 4, suppressor of cytokine signaling 3, and triosephosphate isomerase 1) based on GEPIA.
A: Calreticulin; B: Heat shock protein family B member 1; C: Insulin-like growth Factor 1; D: Interleukin-1 receptor 1; E: Krüppel-like factor 4; F: Suppressor of cytokine signaling 3; G: Triosephosphate isomerase 1. CALR: Calreticulin; HSPB1: Heat shock protein family B member 1; IGF1: Insulin-like growth Factor 1; IL1R1: Interleukin-1 receptor 1; KLF4: Krüppel-like factor 4; SOCS3: Suppressor of cytokine signaling 3; TPI1: Triosephosphate isomerase 1.
Figure 9 Correlation analysis of candidate genes.
A: Calreticulin with Triosephosphate isomerase 1; B: Insulin-like growth factor 1 with interleukin-1 receptor 1; C: Insulin-like growth factor 1 with Krüppel-like factor 4; D: Insulin-like growth factor 1 with suppressor of cytokine signaling 3; E: Krüppel-like factor 4 with suppressor of cytokine signaling 3. CALR: Calreticulin; TPI1: Triosephosphate isomerase 1; IGF1: Insulin-like growth Factor 1; IL1R1: Interleukin-1 receptor 1; KLF4: Krüppel-like factor 4; SOCS3: Suppressor of cytokine signaling 3.
Figure 10 Relative expression of the top seven hub genes in the primary tumors and normal tissue based on the UALCAN database (cP value < 0.
01). A: Calreticulin; B: Heat shock protein family B member 1; C: Insulin-like growth Factor 1; D: Interleukin-1 receptor 1; E: Krüppel-like factor 4; F: Suppressor of cytokine signaling 3; G: Triosephosphate isomerase 1. CALR: Calreticulin; HSPB1: Heat shock protein family B member 1; IGF1: Insulin-like growth Factor 1; IL1R1: Interleukin-1 receptor 1; KLF4: Krüppel-like factor 4; SOCS3: Suppressor of cytokine signaling 3; TPI1: Triosephosphate isomerase 1.
Figure 11 Analyses of gene expression of the top seven hub genes in breast cancer.
BRCA: Breast cancer; CALR: Calreticulin; HSPB1: Heat shock protein family B member 1; IGF1: Insulin-like growth Factor 1; IL1R1: Interleukin-1 receptor 1; KLF4: Krüppel-like factor 4; SOCS3: Suppressor of cytokine signaling 3; TPI1: Triosephosphate isomerase 1.
Figure 12 Principal component analysis of breast cancer based on the top seven hub genes.
BRCA: Breast cancer; PC: Component analysis.
- Citation: Zhang X, Mi ZH. Identification of potential diagnostic and prognostic biomarkers for breast cancer based on gene expression omnibus. World J Clin Cases 2023; 11(27): 6344-6362
- URL: https://www.wjgnet.com/2307-8960/full/v11/i27/6344.htm
- DOI: https://dx.doi.org/10.12998/wjcc.v11.i27.6344


