Copyright
©The Author(s) 2023.
World J Clin Cases. Aug 16, 2023; 11(23): 5504-5518
Published online Aug 16, 2023. doi: 10.12998/wjcc.v11.i23.5504
Published online Aug 16, 2023. doi: 10.12998/wjcc.v11.i23.5504
Figure 1 Volcano maps of differentially expressed genes in GSE116959 and GSE118370.
A: GSE116959; B: GSE118370.
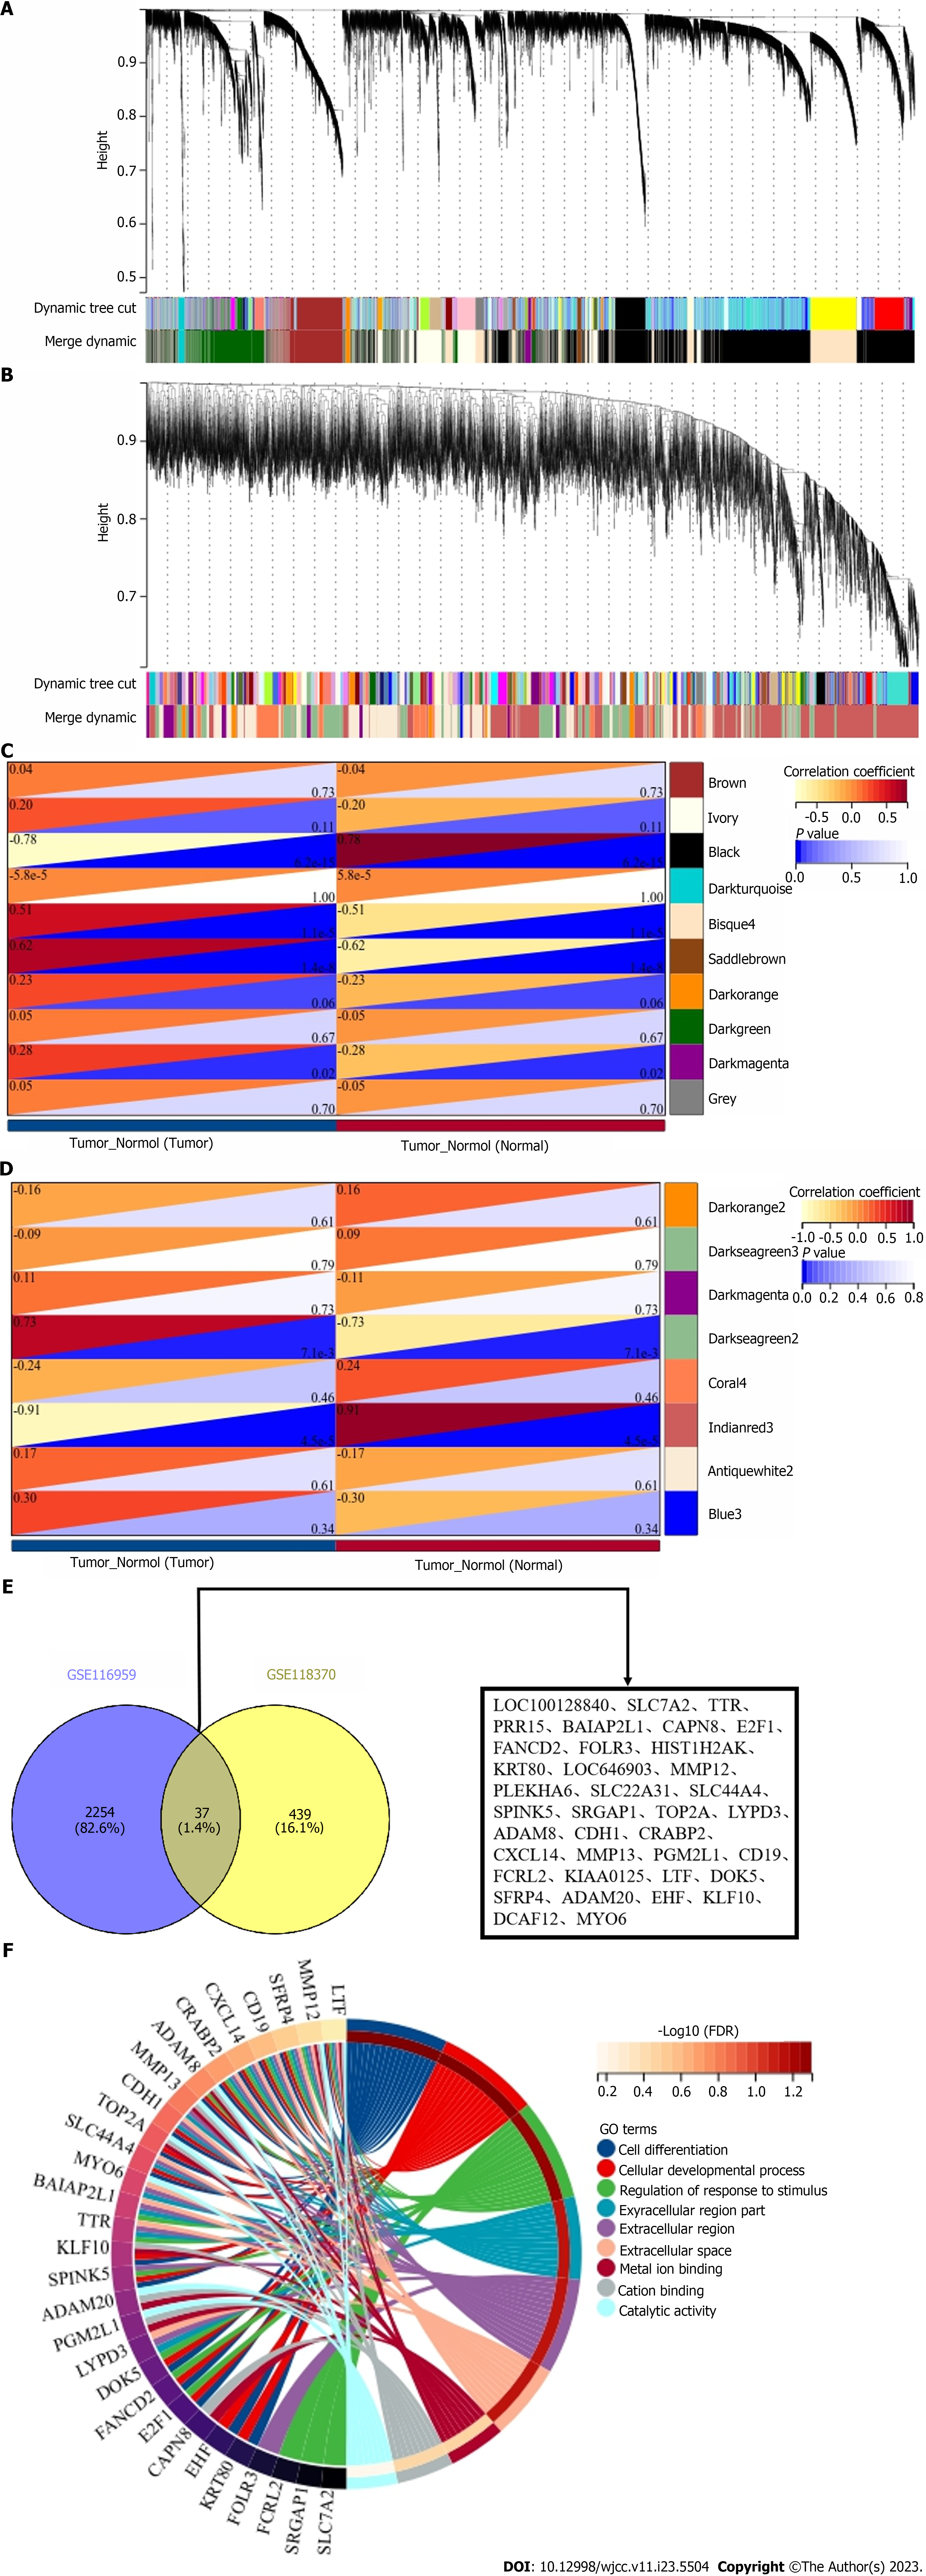
Figure 2 Weighted gene co-expression network analysis and gene ontology enrichment analysis of differentially expressed genes.
A: Cluster dendrogram of co-expression genes in GSE116959; B: Cluster dendrogram of co-expression genes in GSE118370; C: Module-trait relationships in GSE116959; D: Module-trait relationships in GSE118370; E: Shared differentially expressed genes (DEGs) between GSE116959 and GSE118370; F: Gene ontology enrichment analysis of the DEGs shared between the two datasets.
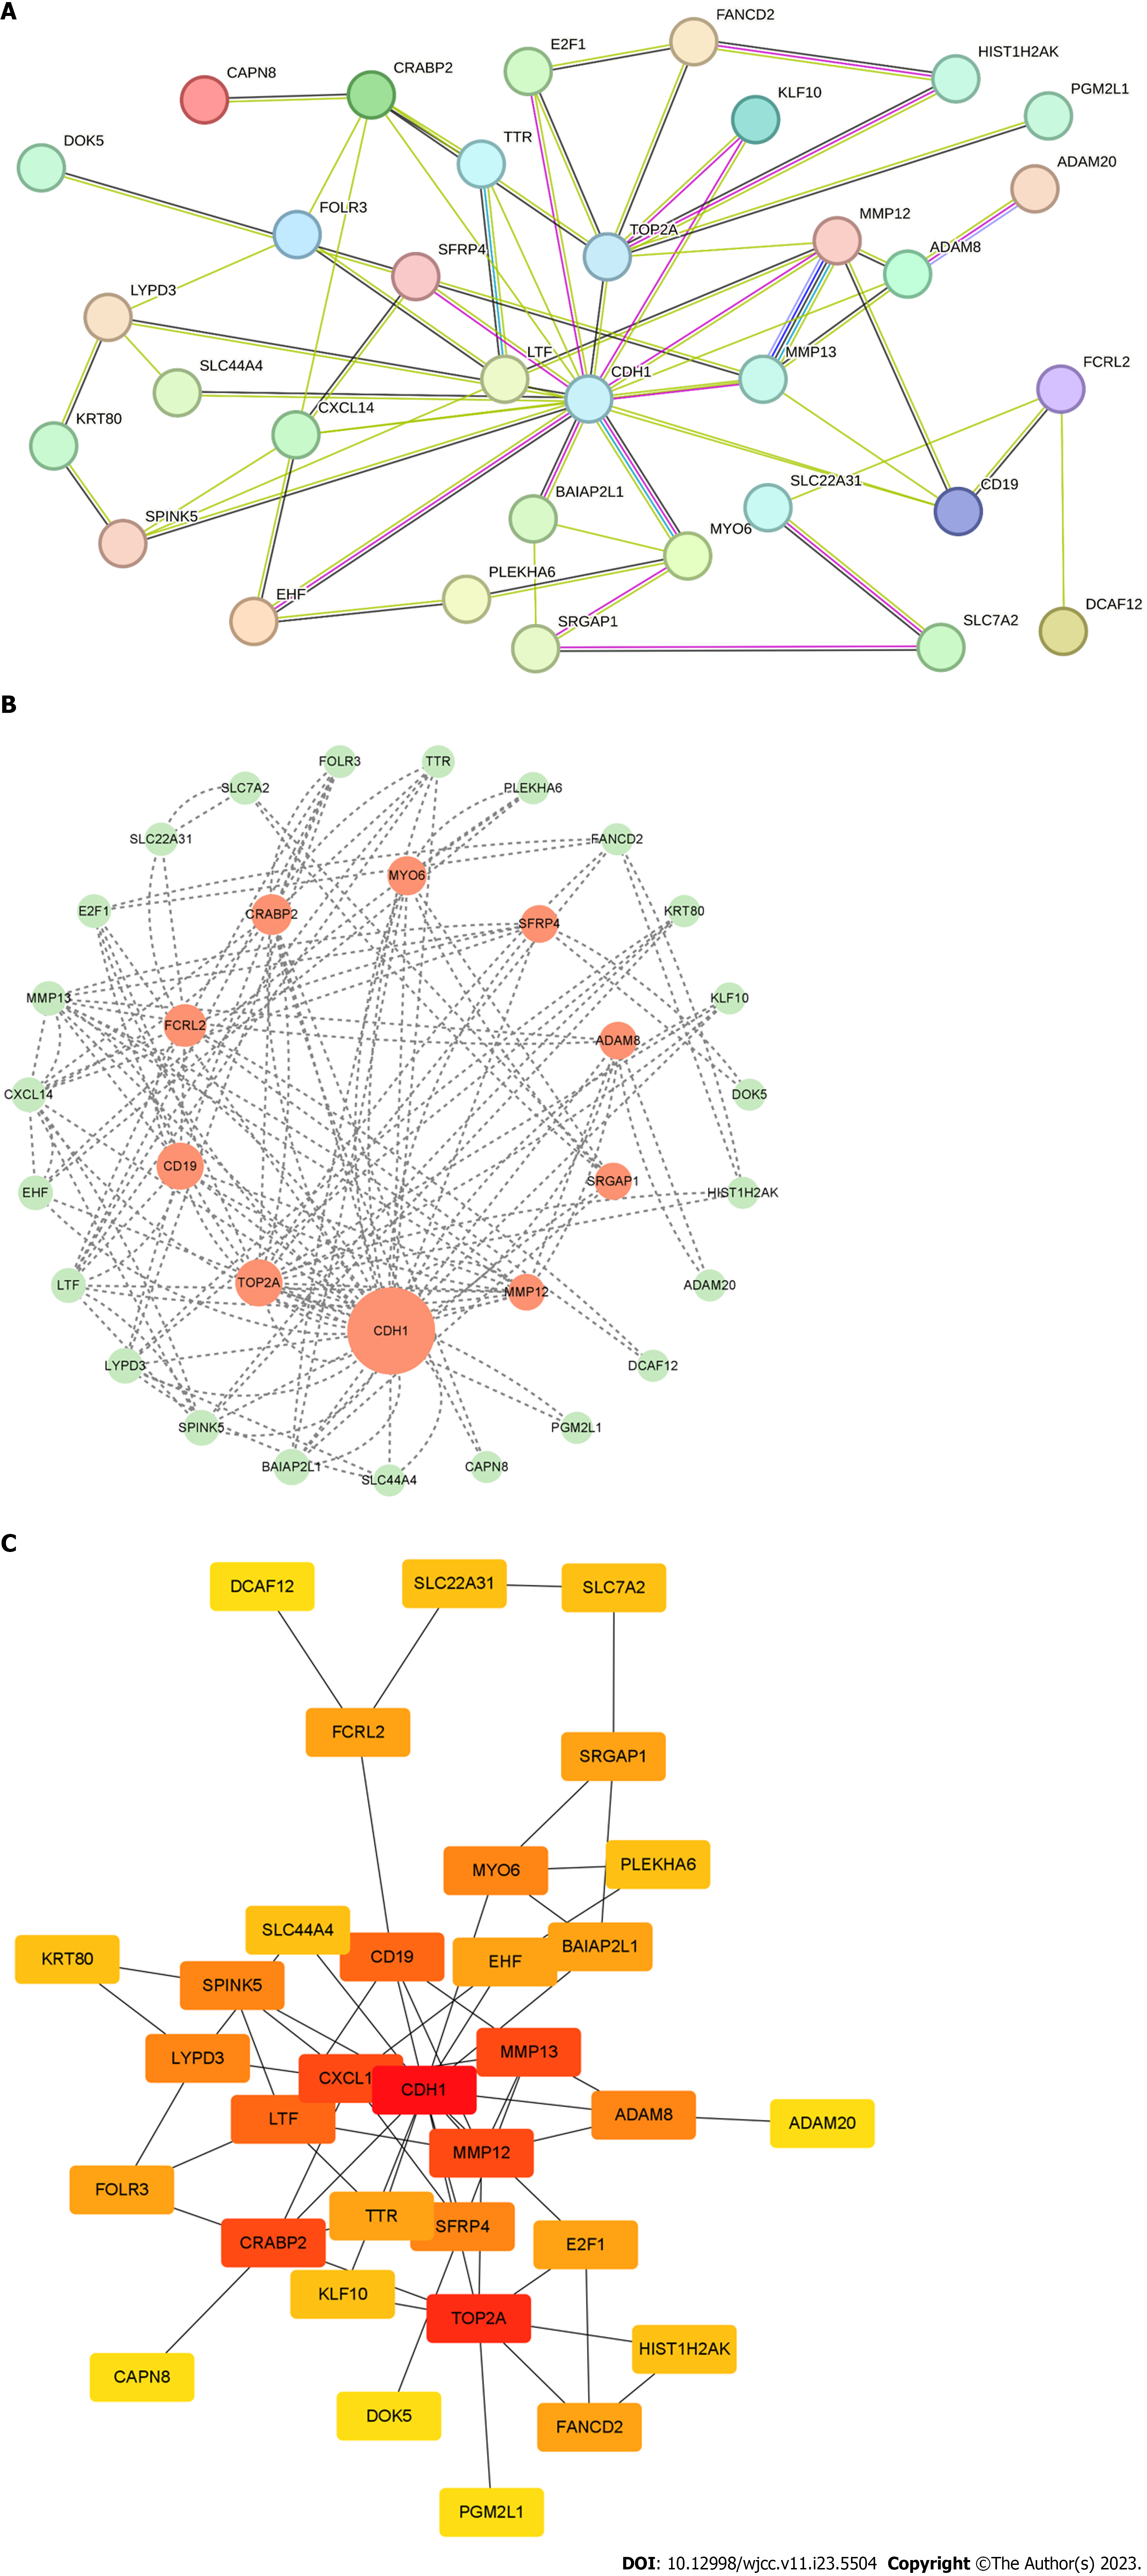
Figure 3 Protein-protein interaction network construction and hub gene screening.
A: Protein-protein interaction network diagram of differentially expressed genes constructed based on the Search Tool for the Retrieval of Interacting Genes database; B: Network diagram produced based on CytoHubba; C: Network diagram created based on CytoNCA.
Figure 4 Shared hub genes based on analysis performed using CytoHubba and CytoNCA.
CDH1: Cadherin 1; CRABP2: Cellular retinoic acid binding protein 2; MMP12: Matrix metallopeptidase 12; TOP2A: DNA topoisomerase II alpha.
Figure 5 Receiver operating characteristic analysis and Kaplan-Meier survival analysis.
A and B: Receiver operating characteristic analysis of hub genes in the (A) GSE116959 and (B) GSE118370 datasets; C-G: Kaplan-Meier survival analysis for CD19 (C), CDH 1 (D), CRABP2 (E), MMP 12 (F), and TOP2A (G). AUC: Area under the receiver operating characteristic curve; CDH1: Cadherin 1; CRABP2: Cellular retinoic acid binding protein 2; FPR: False positive rate; HR: Hazard ratio; MMP12: Matrix metallopeptidase 12; TOP2A: DNA topoisomerase II alpha; TPR: True positive rate.
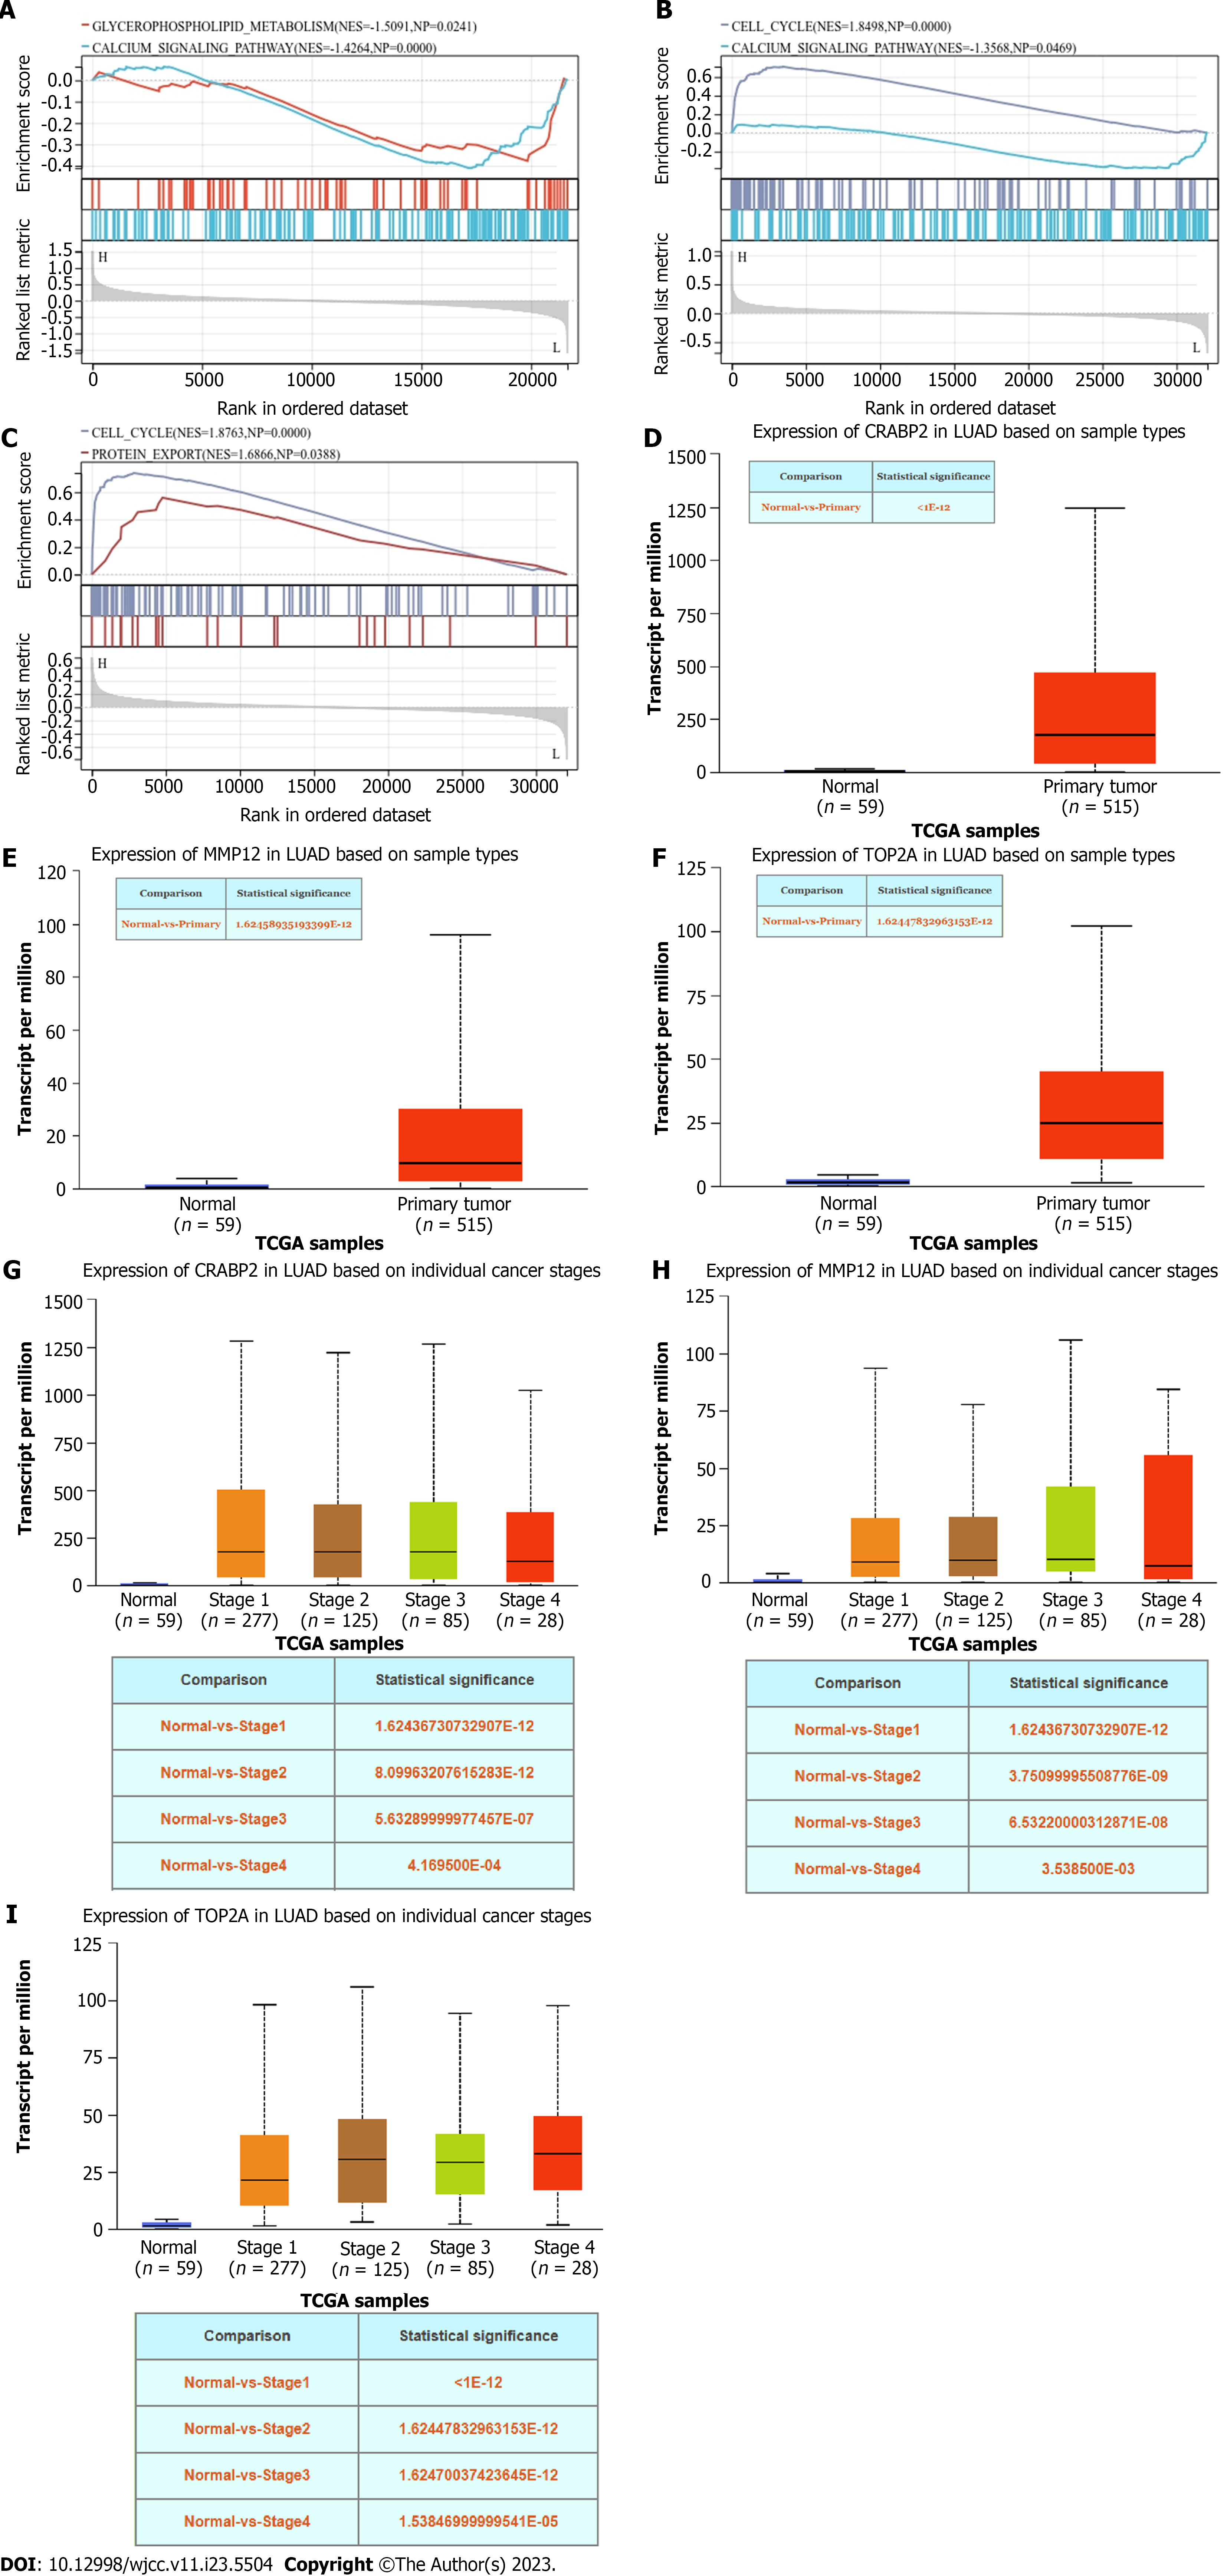
Figure 6 Single-sample gene set enrichment analysis and analysis of hub gene expression in tumors.
A-C: The single-sample gene set enrichment analysis of hub genes; D-F: Expression of the hub genes in tumor tissues and normal samples; G-I: Expression of the hub genes during tumor progression. LUAD: Lung adenocarcinoma; TCGA: The Cancer Genome Atlas.
Figure 7 Immunohistochemical staining of hub genes.
CRABP2: Cellular retinoic acid binding protein 2; MMP12: Matrix metallopeptidase 12; TOP2A: DNA topoisomerase II alpha.
- Citation: Zhang L, Liu Y, Zhuang JG, Guo J, Li YT, Dong Y, Song G. Identification of key genes and biological pathways in lung adenocarcinoma by integrated bioinformatics analysis. World J Clin Cases 2023; 11(23): 5504-5518
- URL: https://www.wjgnet.com/2307-8960/full/v11/i23/5504.htm
- DOI: https://dx.doi.org/10.12998/wjcc.v11.i23.5504


