Copyright
©The Author(s) 2023.
World J Clin Cases. Aug 6, 2023; 11(22): 5224-5235
Published online Aug 6, 2023. doi: 10.12998/wjcc.v11.i22.5224
Published online Aug 6, 2023. doi: 10.12998/wjcc.v11.i22.5224
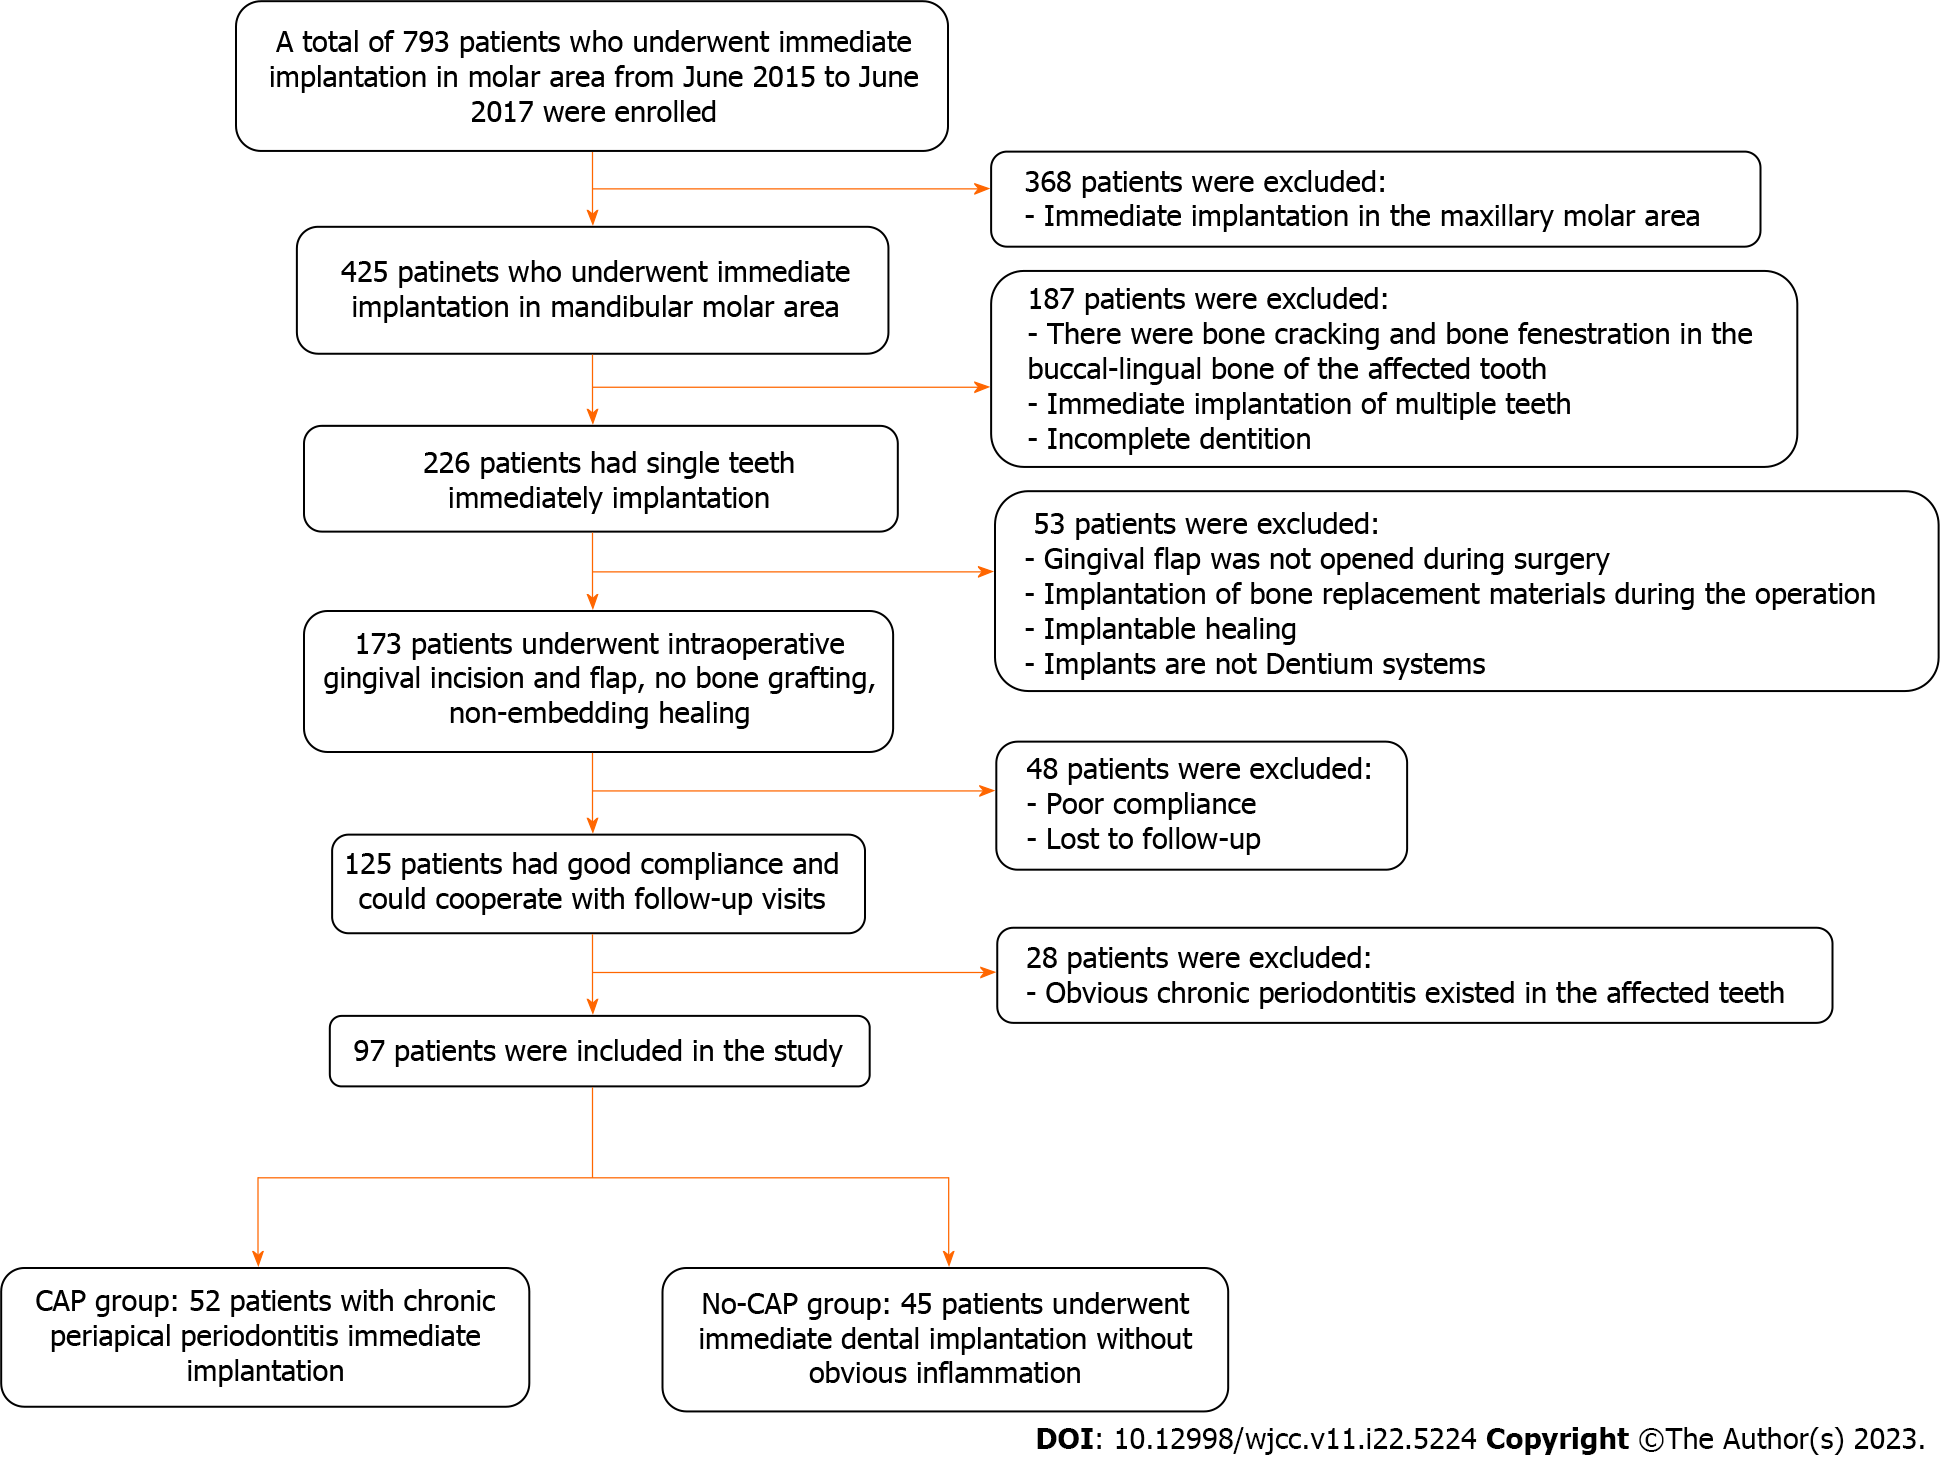
Figure 1 Patients’ screening flowchart.
CAP: Chronic apical periodontitis.
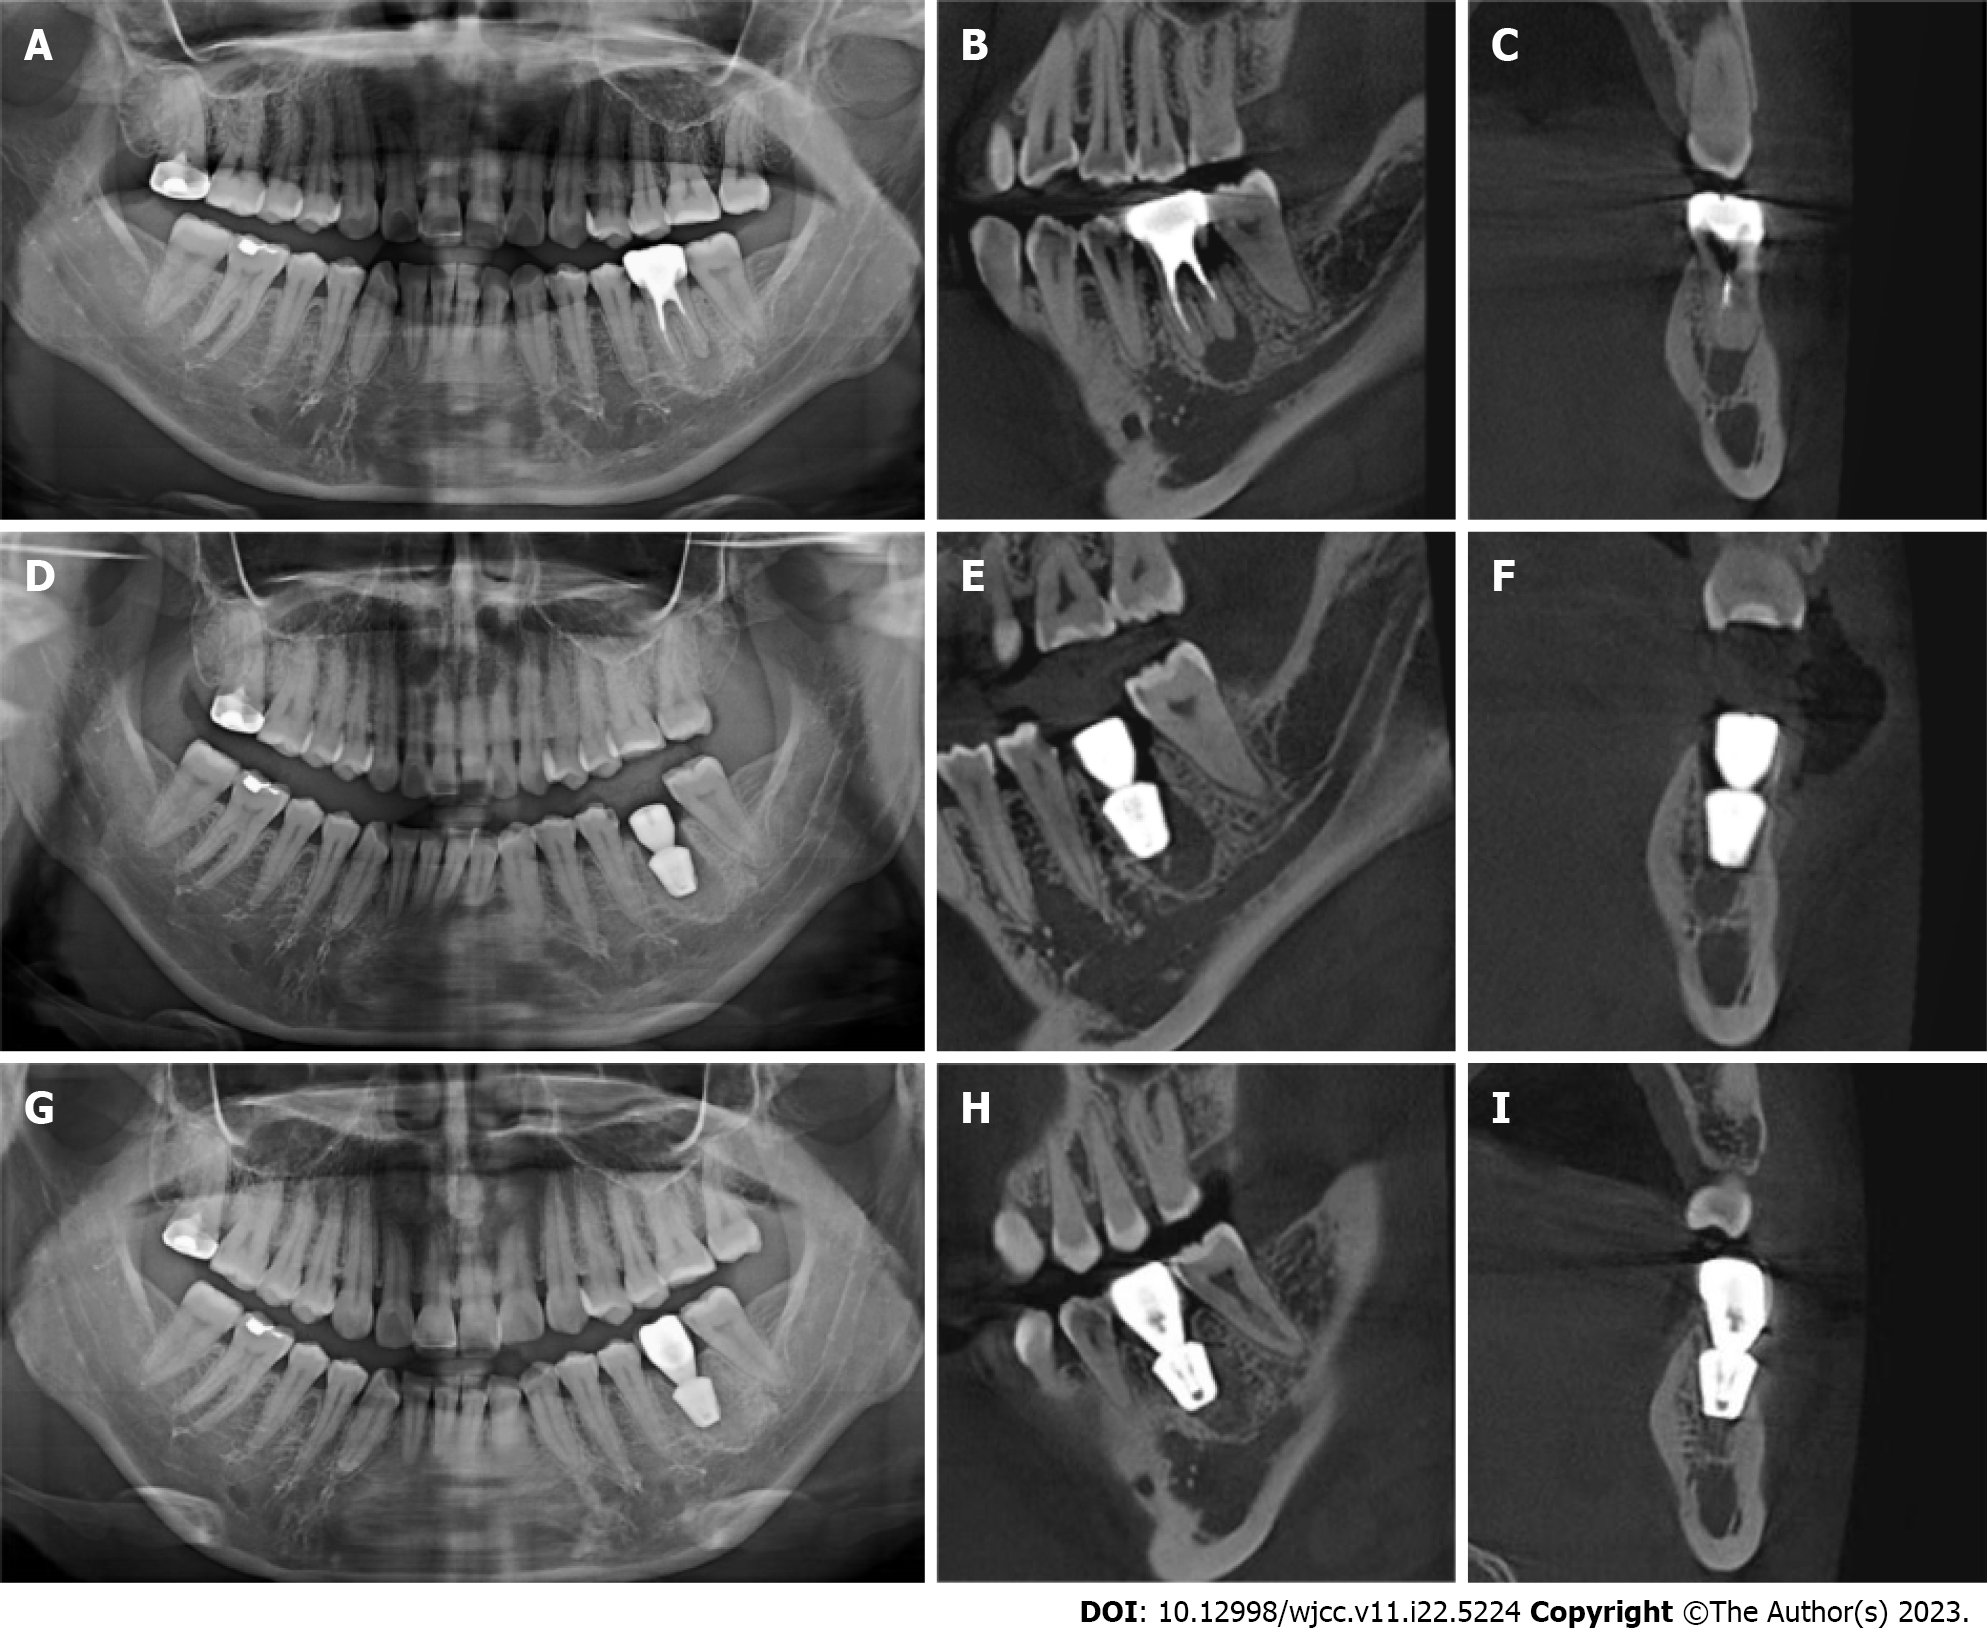
Figure 2 Cone-beam computed tomography scans of the chronic apical periodontitis group.
A-C: Cone-beam computed tomography (CBCT) scans of the chronic apical periodontitis (CAP) group before surgery; D-F: CBCT scans of the CAP group after immediate dental implantation; G-I: CBCT scans of the CAP group 5 years after restoration.
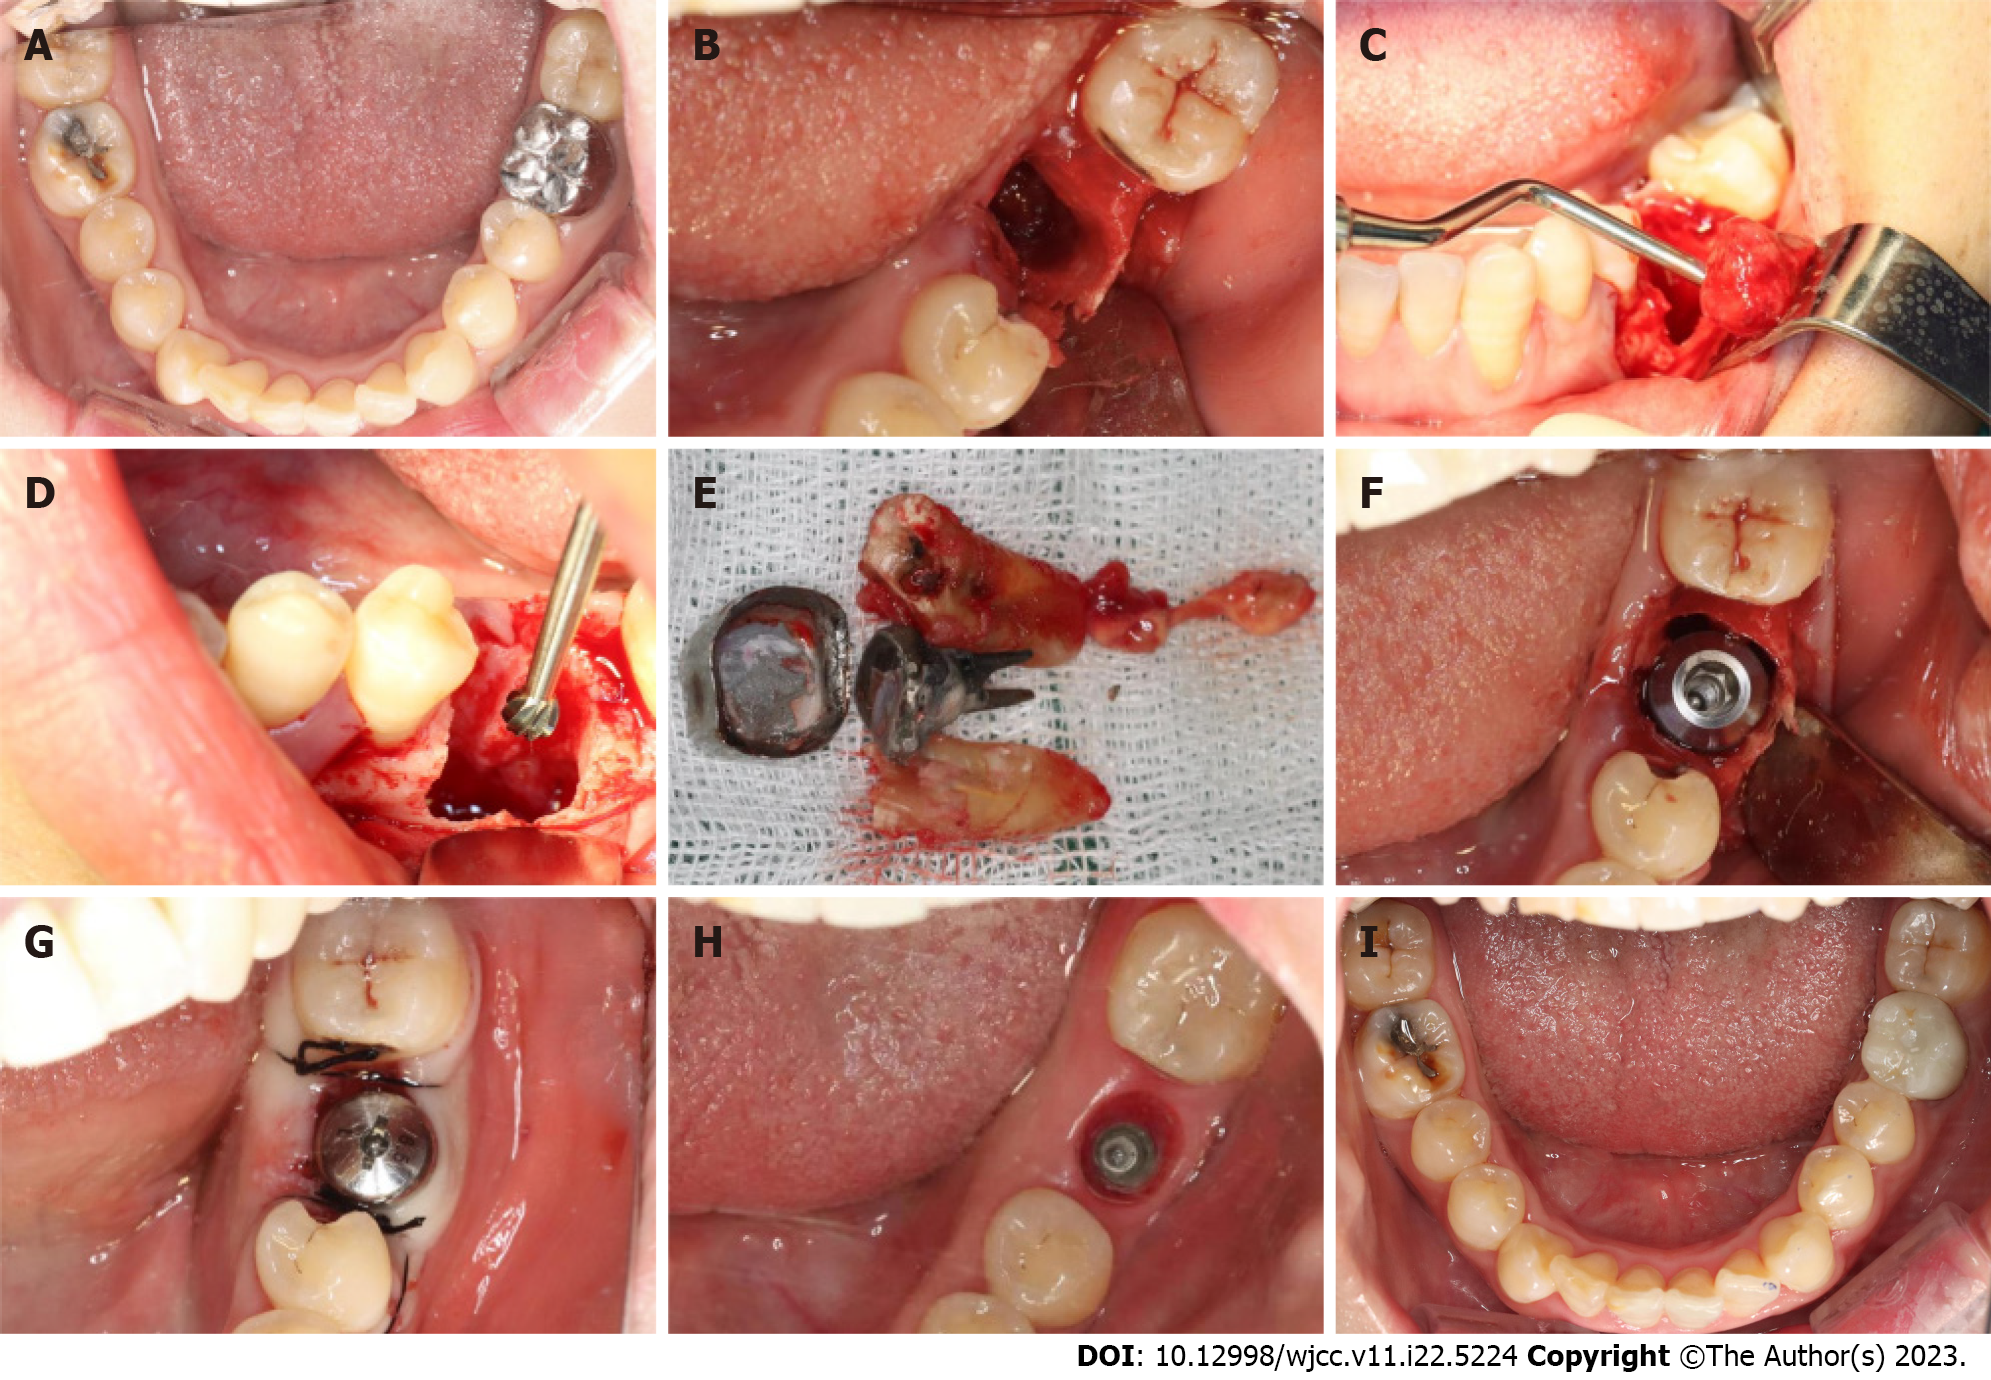
Figure 3 Immediate implant placement surgery and repair in the chronic apical periodontitis group.
A: Patients were examined before surgery; B: The gingiva was incised, and the mucoperiosteal flap was raised and removed; C: The inflammatory tissue in the extraction fossa was removed, and the primary implant hole was prepared; D: Residual inflammatory tissue on the bone wall of the inflammatory lesion area was removed using a ball drill via a primary implant hole; E: Removed teeth and removed inflammatory tissue; F: Immediate implant placement; G: Non-embedding healing; H: Gum cuff; I: Crown restoration completed.
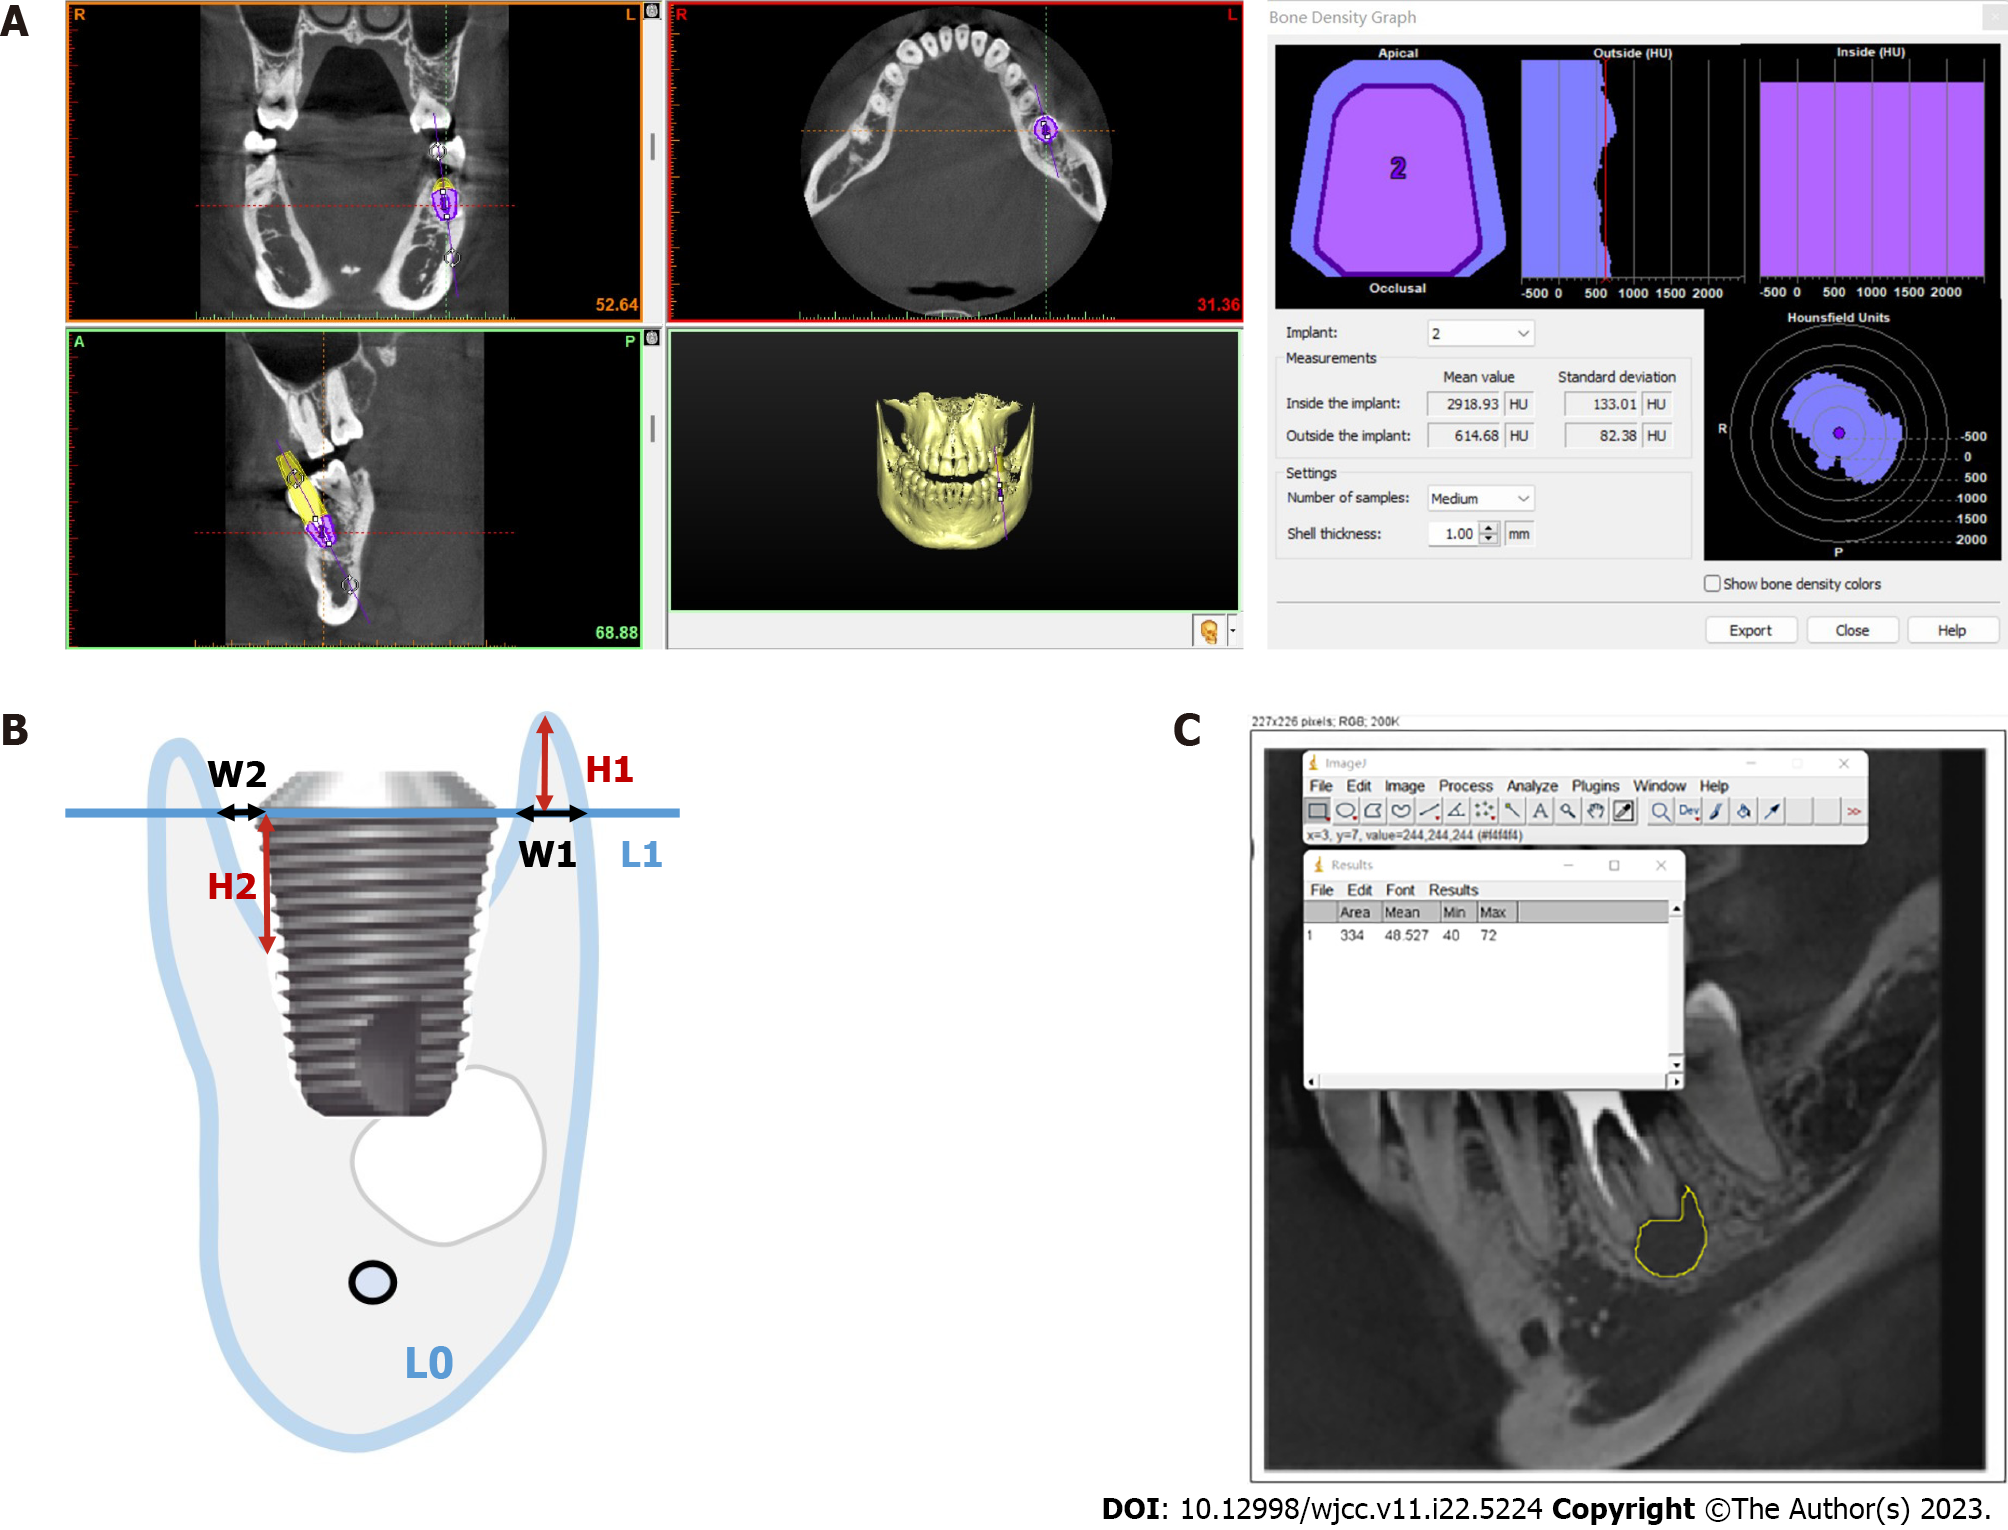
Figure 4 Method for measuring changes in bone tissue around implants.
A: The peri-implant bone mineral density was measured using Simplant software; B: Schemas of marginal bone resorption and jump gap measurements. L0 is the long axis of the implant. L1 is perpendicular to L0. H1 is the vertical distance from the crest of the alveolar bone to L1. W1 is the horizontal distance from the most lateral side of the alveolar bone wall to the edge of the implant. H2 is the vertical distance from the highest point of contact between the implant and the bone to L1. W2 is the width of the jump gap. C: Image J software was used to measure the gray value of the bone destruction area at the root apex of the affected tooth (the gray value of alveolar bone cone-beam computed tomography can reflect its bone mineral density).
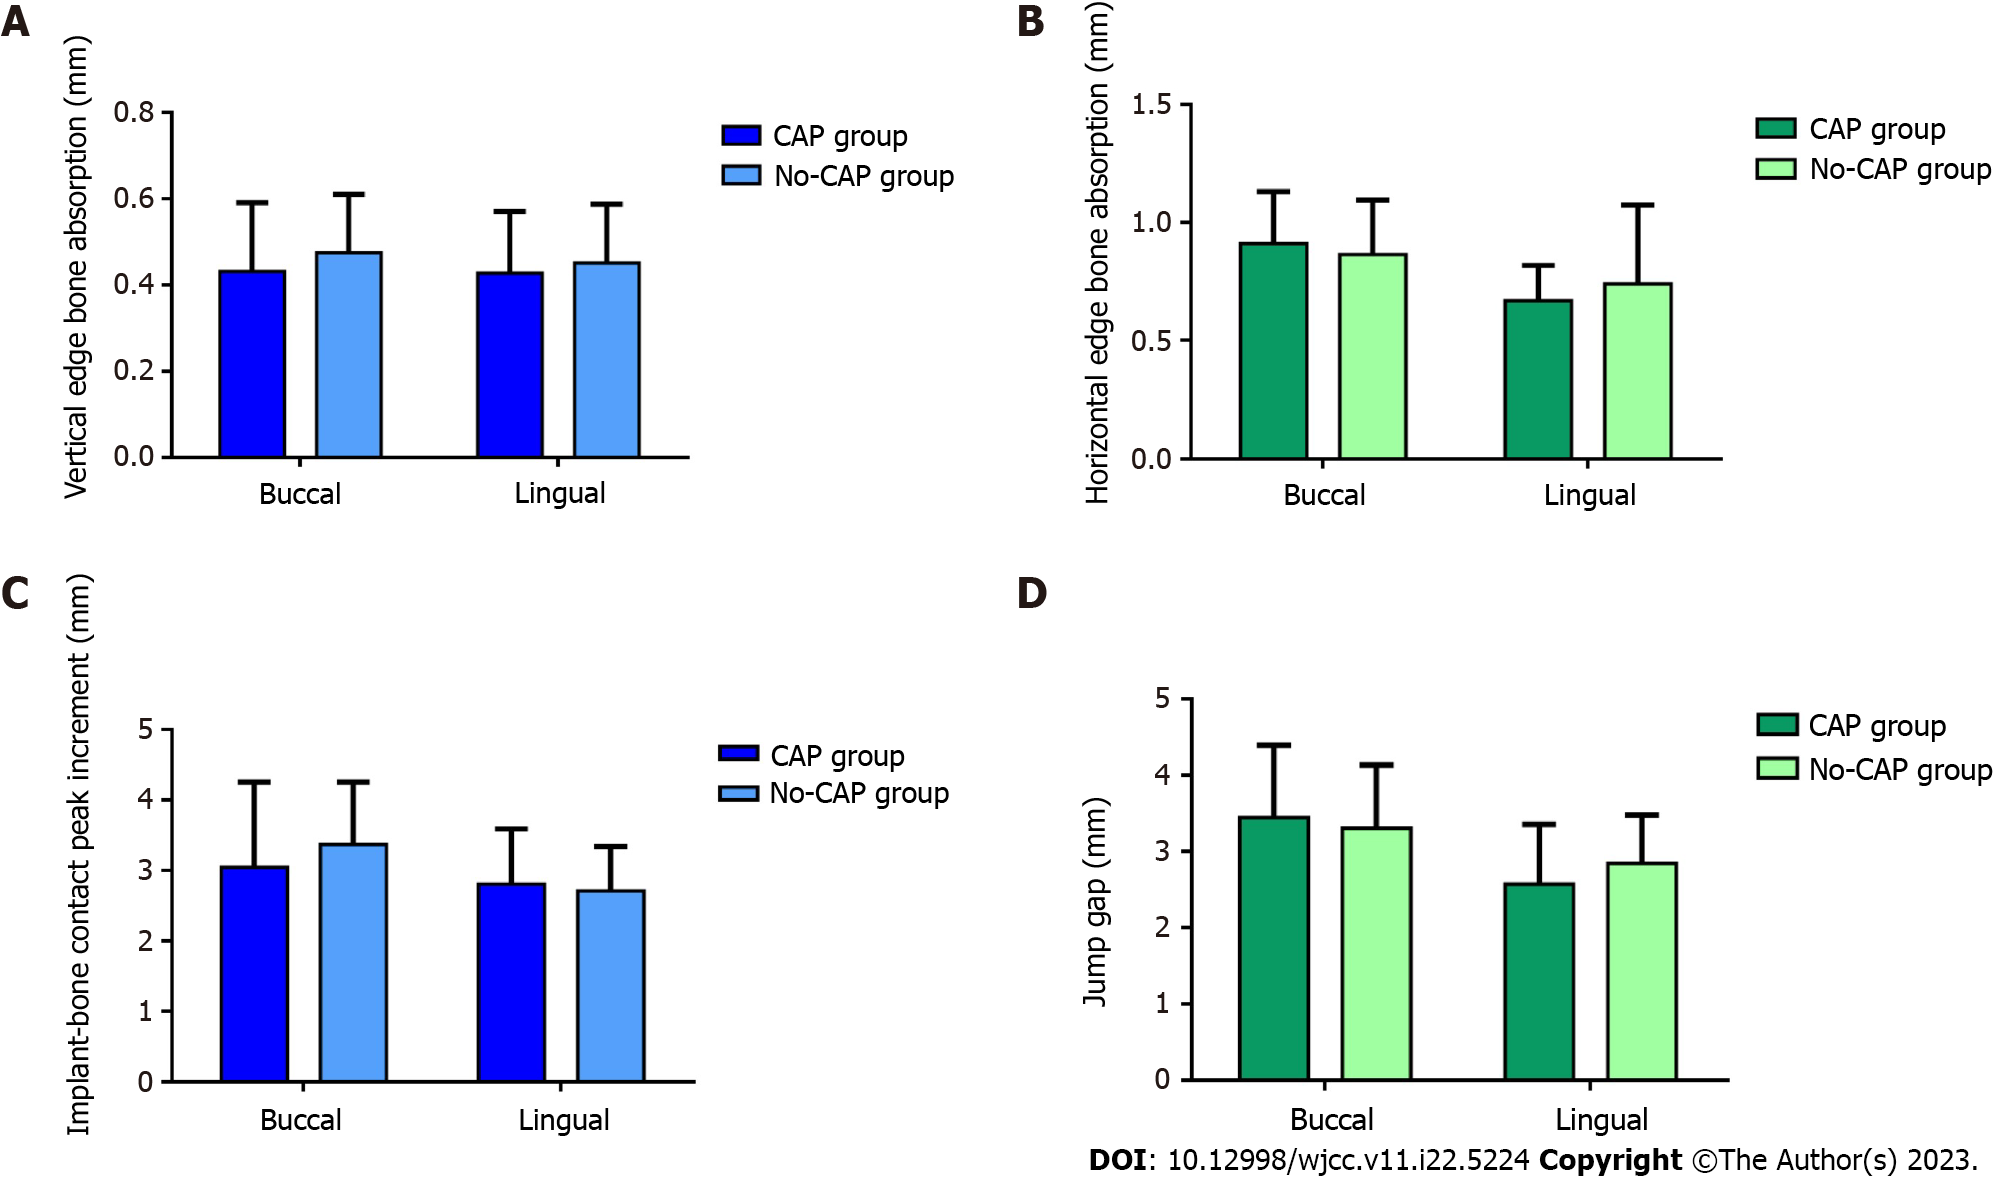
Figure 5 Changes in bone tissue around implants.
A: Vertical edge bone absorption of peri-implant (buccal, P = 0.268; lingual, P = 0.526); B: Horizontal edge bone absorption of peri-implant (buccal, P = 0.428; lingual, P = 0.560); C: Implant-bone contact peak increment (buccal, P = 0.247; lingual, P = 0.604); D: Changes in the jump gap (buccal, P = 0.527; lingual, P = 0.707).
- Citation: Yang H, Luo D, Yuan MJ, Yang JJ, Wang DS. Five-year outcomes of immediate implant placement for mandibular molars with and without chronic apical periodontitis: A retrospective study. World J Clin Cases 2023; 11(22): 5224-5235
- URL: https://www.wjgnet.com/2307-8960/full/v11/i22/5224.htm
- DOI: https://dx.doi.org/10.12998/wjcc.v11.i22.5224


