Copyright
©The Author(s) 2023.
World J Clin Cases. Jun 26, 2023; 11(18): 4277-4286
Published online Jun 26, 2023. doi: 10.12998/wjcc.v11.i18.4277
Published online Jun 26, 2023. doi: 10.12998/wjcc.v11.i18.4277
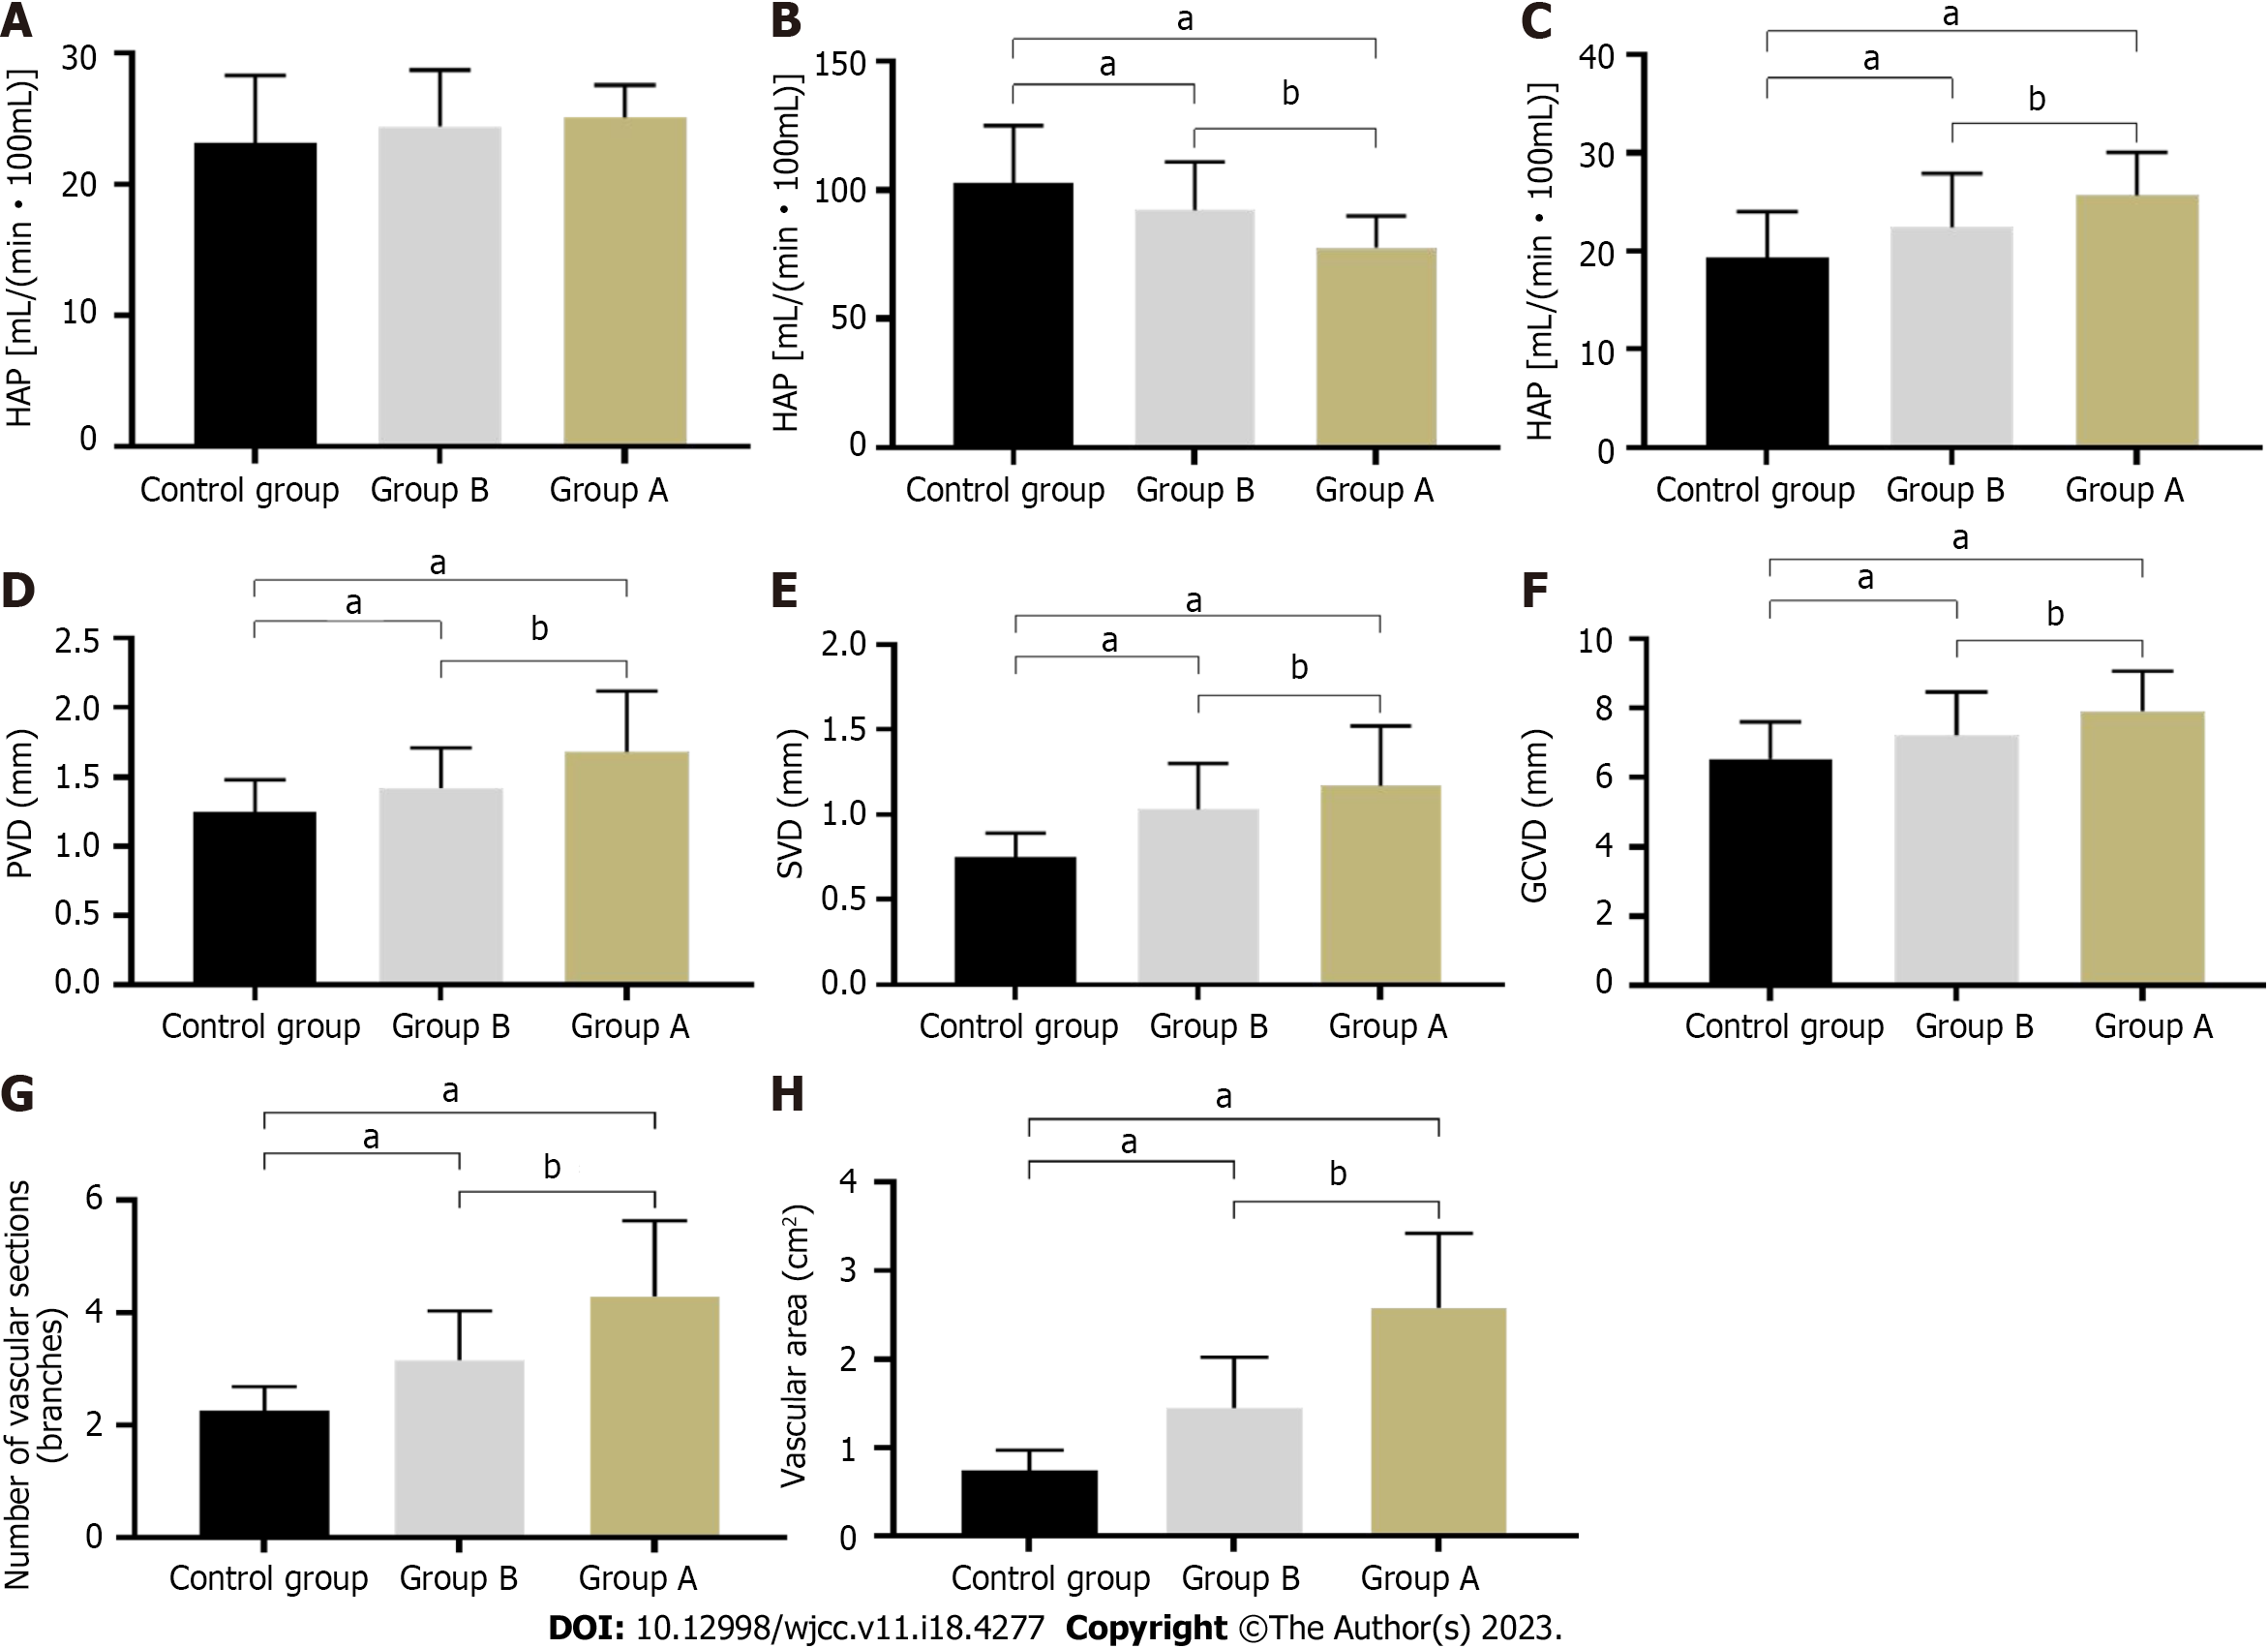
Figure 1 Comparison.
A-C: Perfusion parameters; D-F: Internal diameter of veins; G and H: The number of vascular cross-sections and vascular area in the stomach fundus spleen portal region. Compared to the control group, aP < 0.05; compared to group B, bP < 0.05.
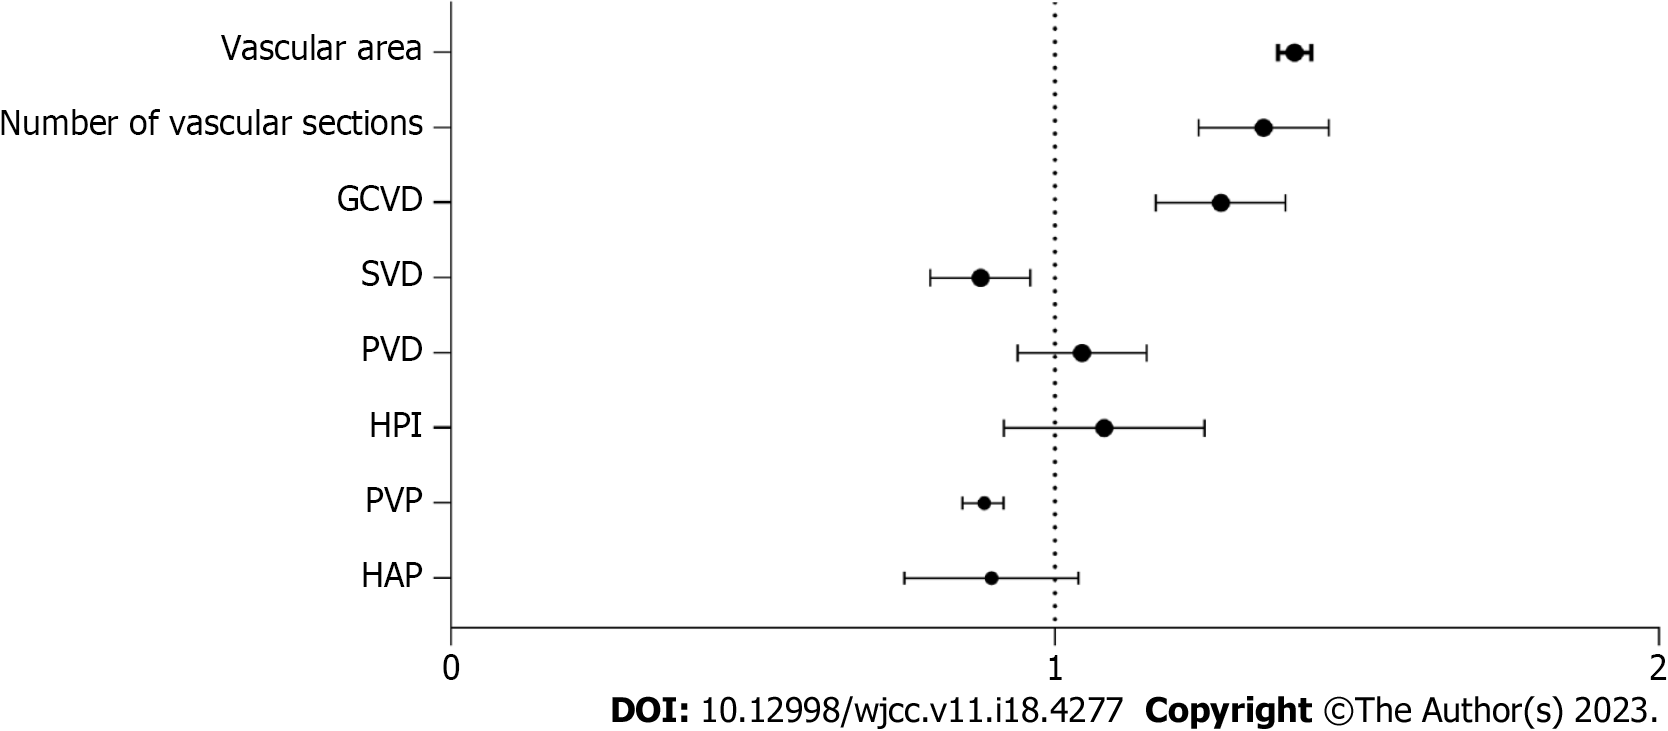
Figure 2 Forest plot of Logistic multivariate regression analysis.
HAP: Hepatic artery; PVP: Portal vein; HPI: Hepatic artery perfusion index; PVD: Portal vein diameter; SVD: Splenic vein diameter; GCVD: Gastric coronary vein diameter.
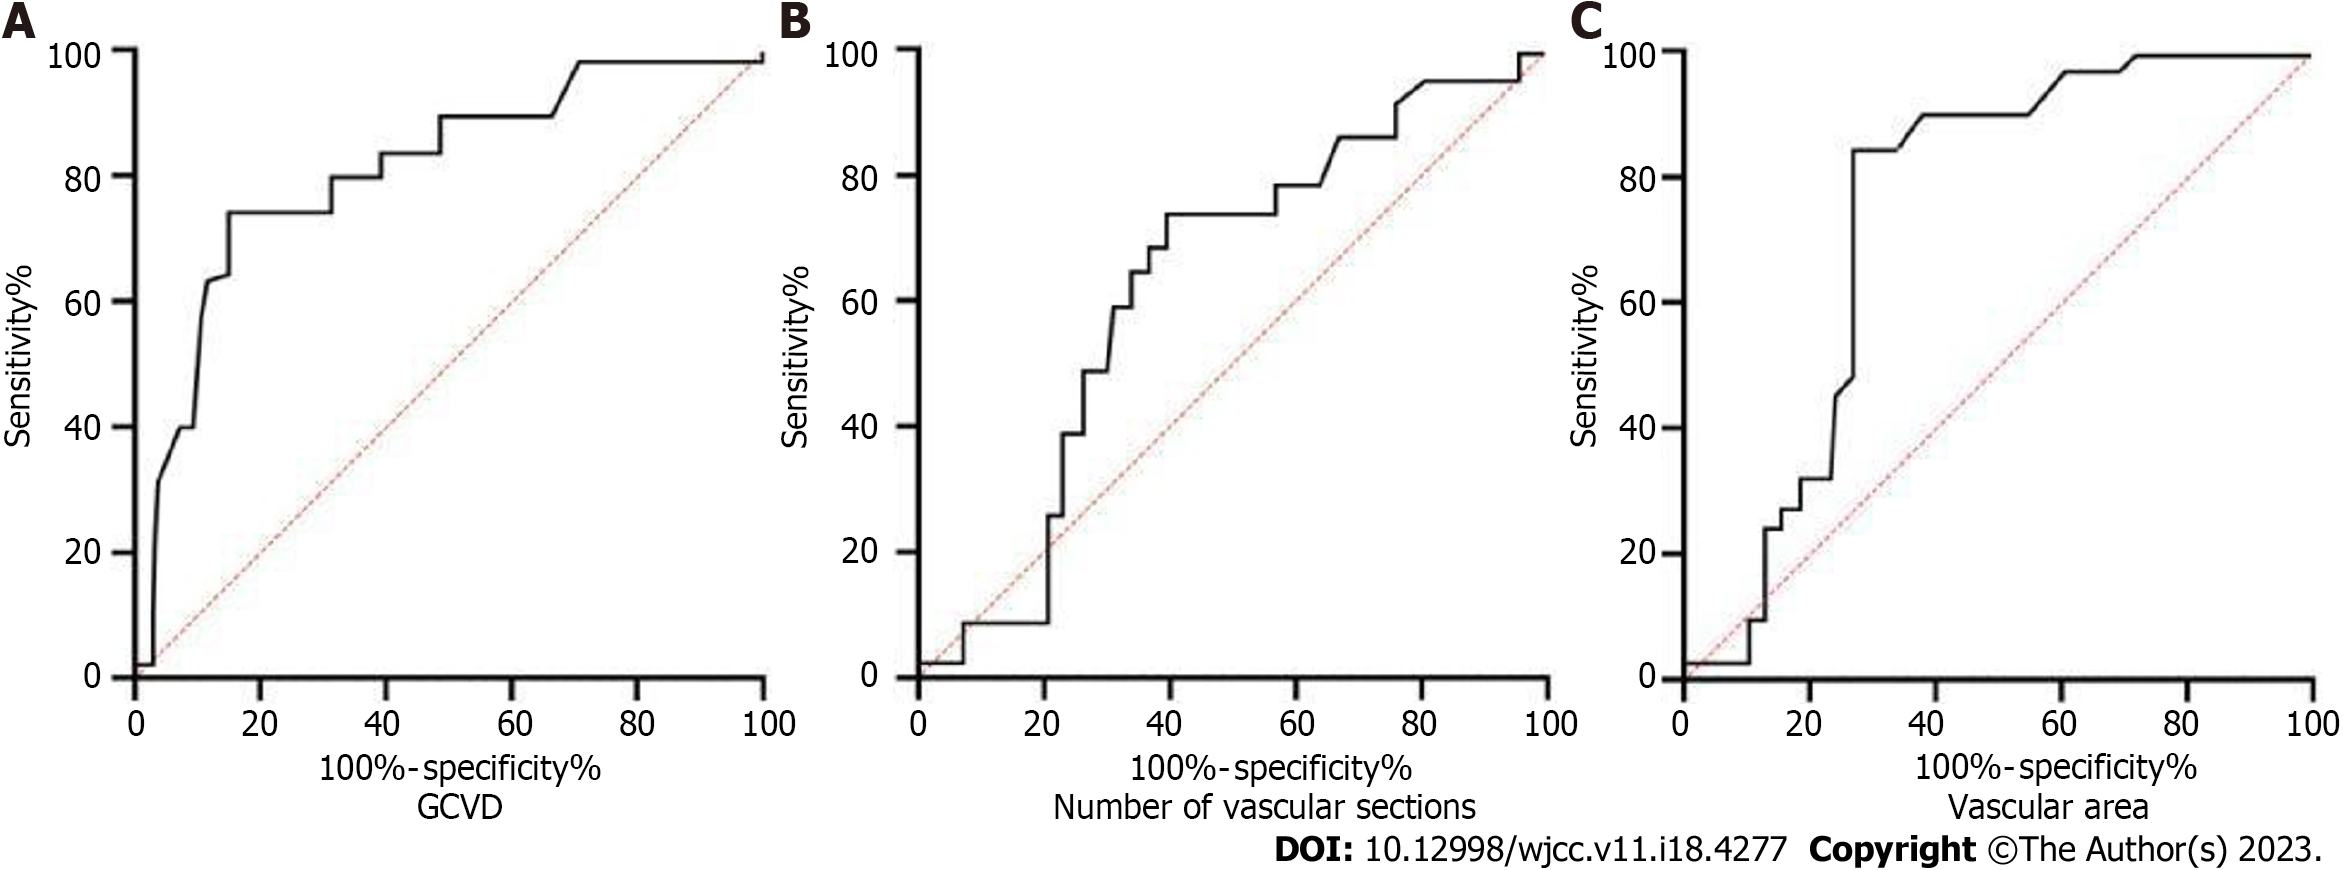
Figure 3 Receiver operating characteristic curve of significantly correlated indicators.
GCVD: Gastric coronary vein diameter.
- Citation: Song XJ, Liu JL, Jia SY, Zhang K. Portal vein computed tomography imaging characteristics and their relationship with bleeding risk in patients with liver cirrhosis undergoing interventional therapy. World J Clin Cases 2023; 11(18): 4277-4286
- URL: https://www.wjgnet.com/2307-8960/full/v11/i18/4277.htm
- DOI: https://dx.doi.org/10.12998/wjcc.v11.i18.4277


