Copyright
©The Author(s) 2023.
World J Clin Cases. May 16, 2023; 11(14): 3340-3350
Published online May 16, 2023. doi: 10.12998/wjcc.v11.i14.3340
Published online May 16, 2023. doi: 10.12998/wjcc.v11.i14.3340
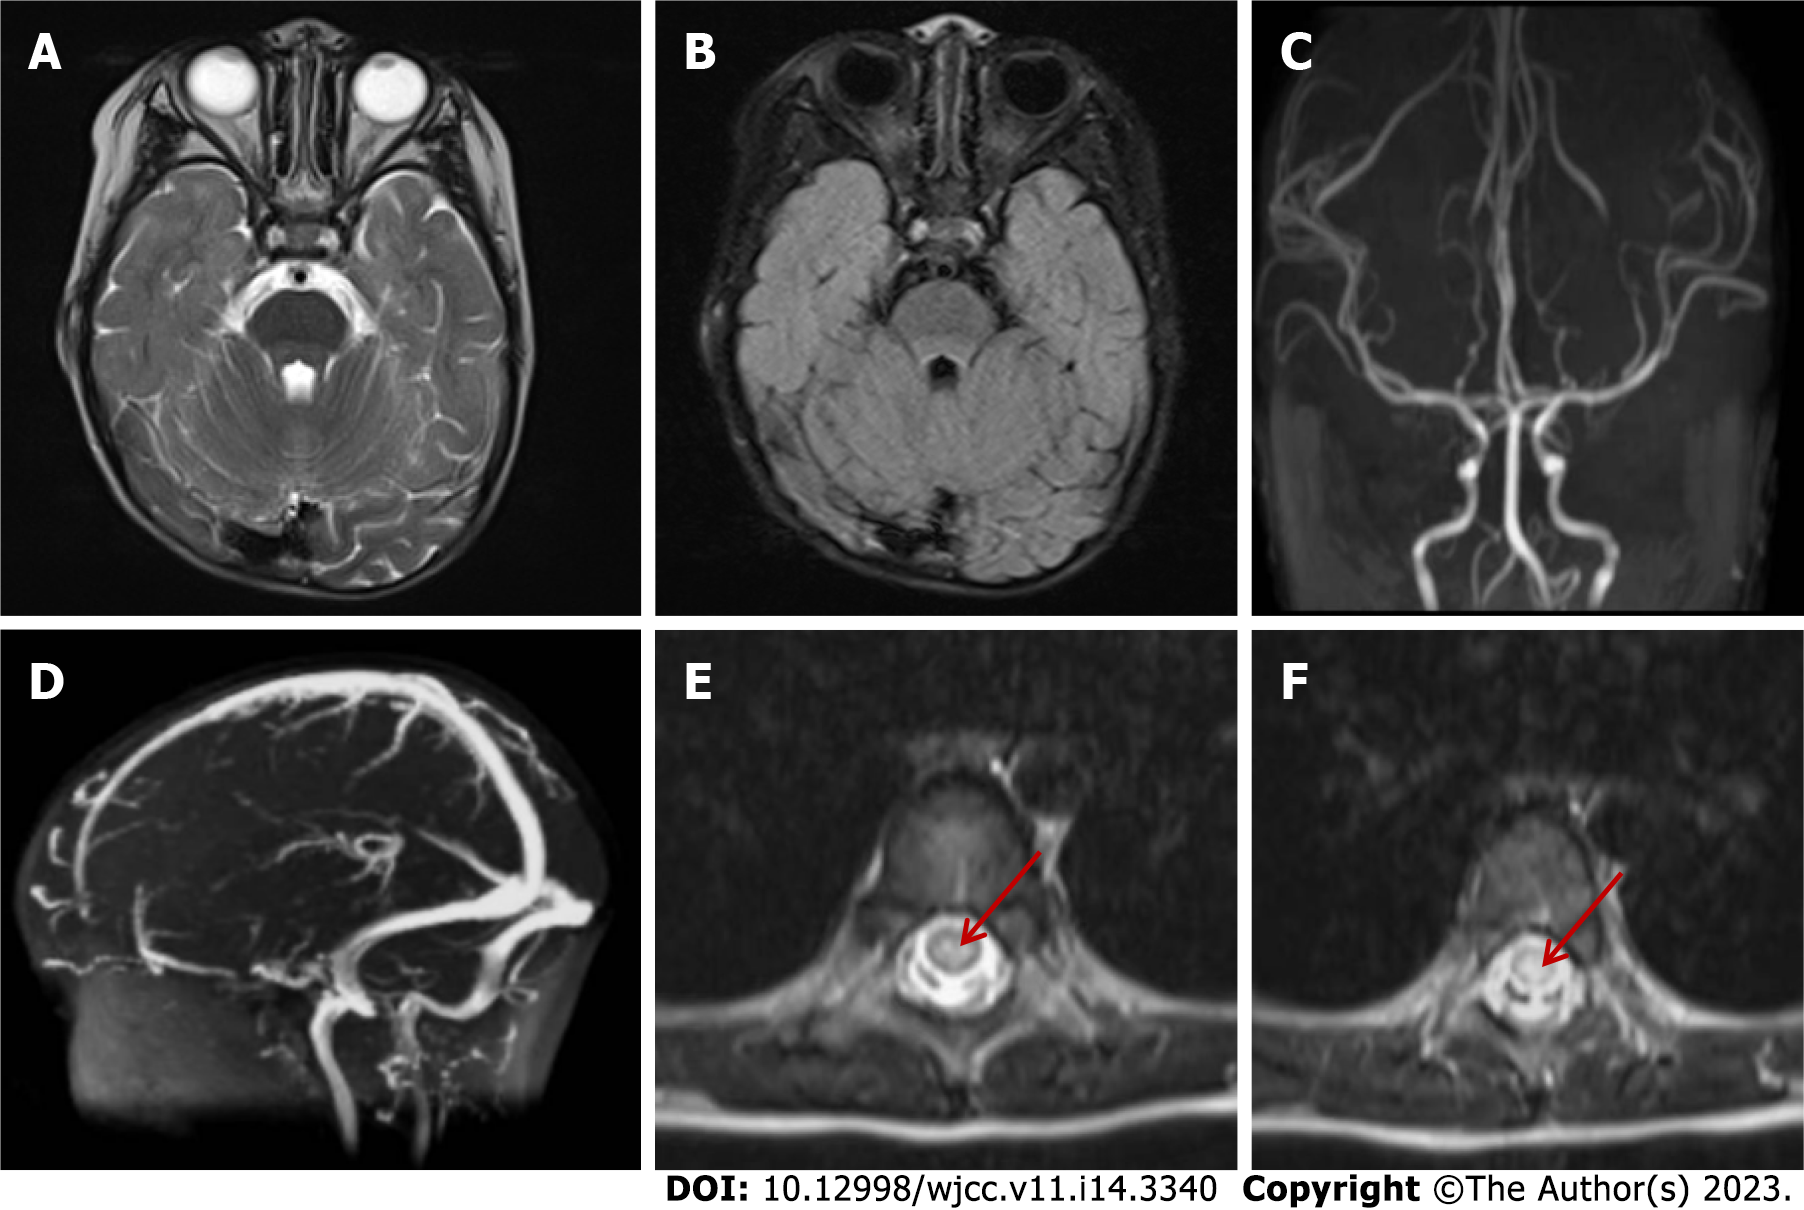
Figure 1 The imaging findings of brain and spinal cord magnetic resonance on day 2 after admission.
A and B: T2-weighted magnetic resonance imaging and fluid-attenuated inversion-recovery imaging of the head, respectively, showed no abnormal signals in the brainstem, cerebellum, and cerebral cortex; C: Magnetic resonance arterial angiography of the head was normal; D: Brain magnetic resonance venography was normal; E and F: T2 hyperintensity in T7-10 horizontal transverse section of thoracic spinal cord (indicated by red arrow).
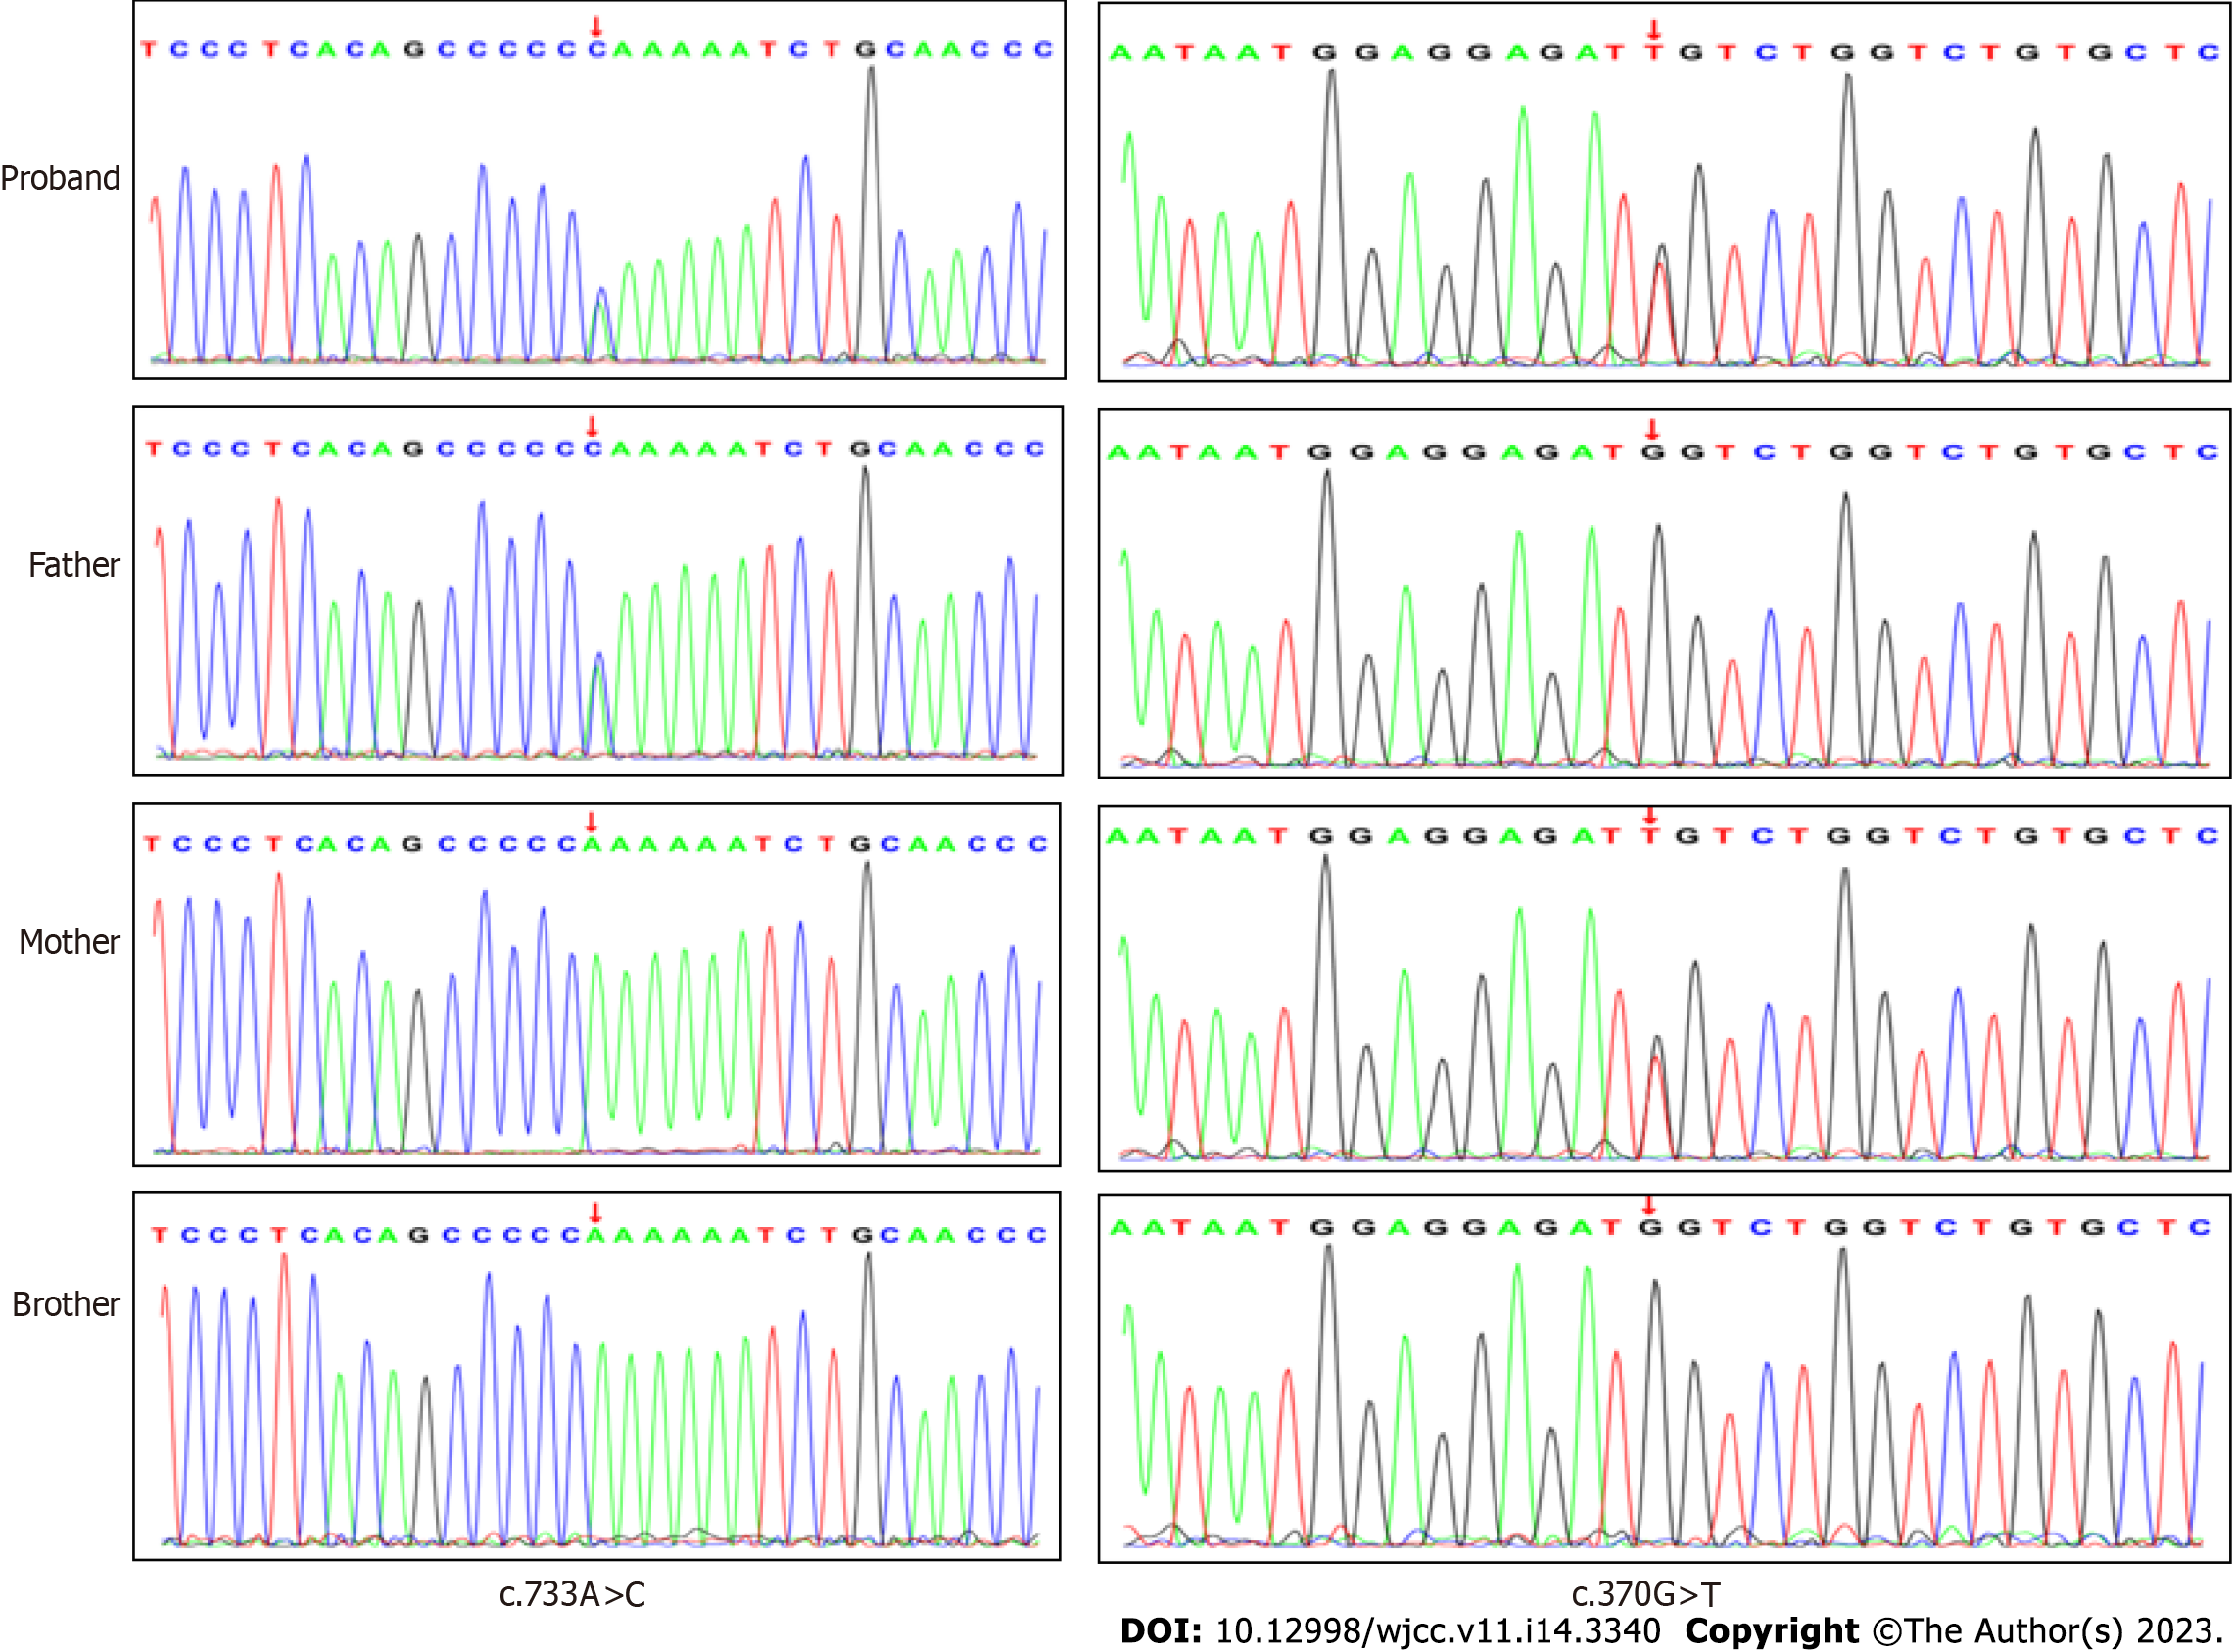
Figure 2 Verification of NAXE (NM_144772.
3) complex heterozygous variation in the patient by Sanger sequencing.
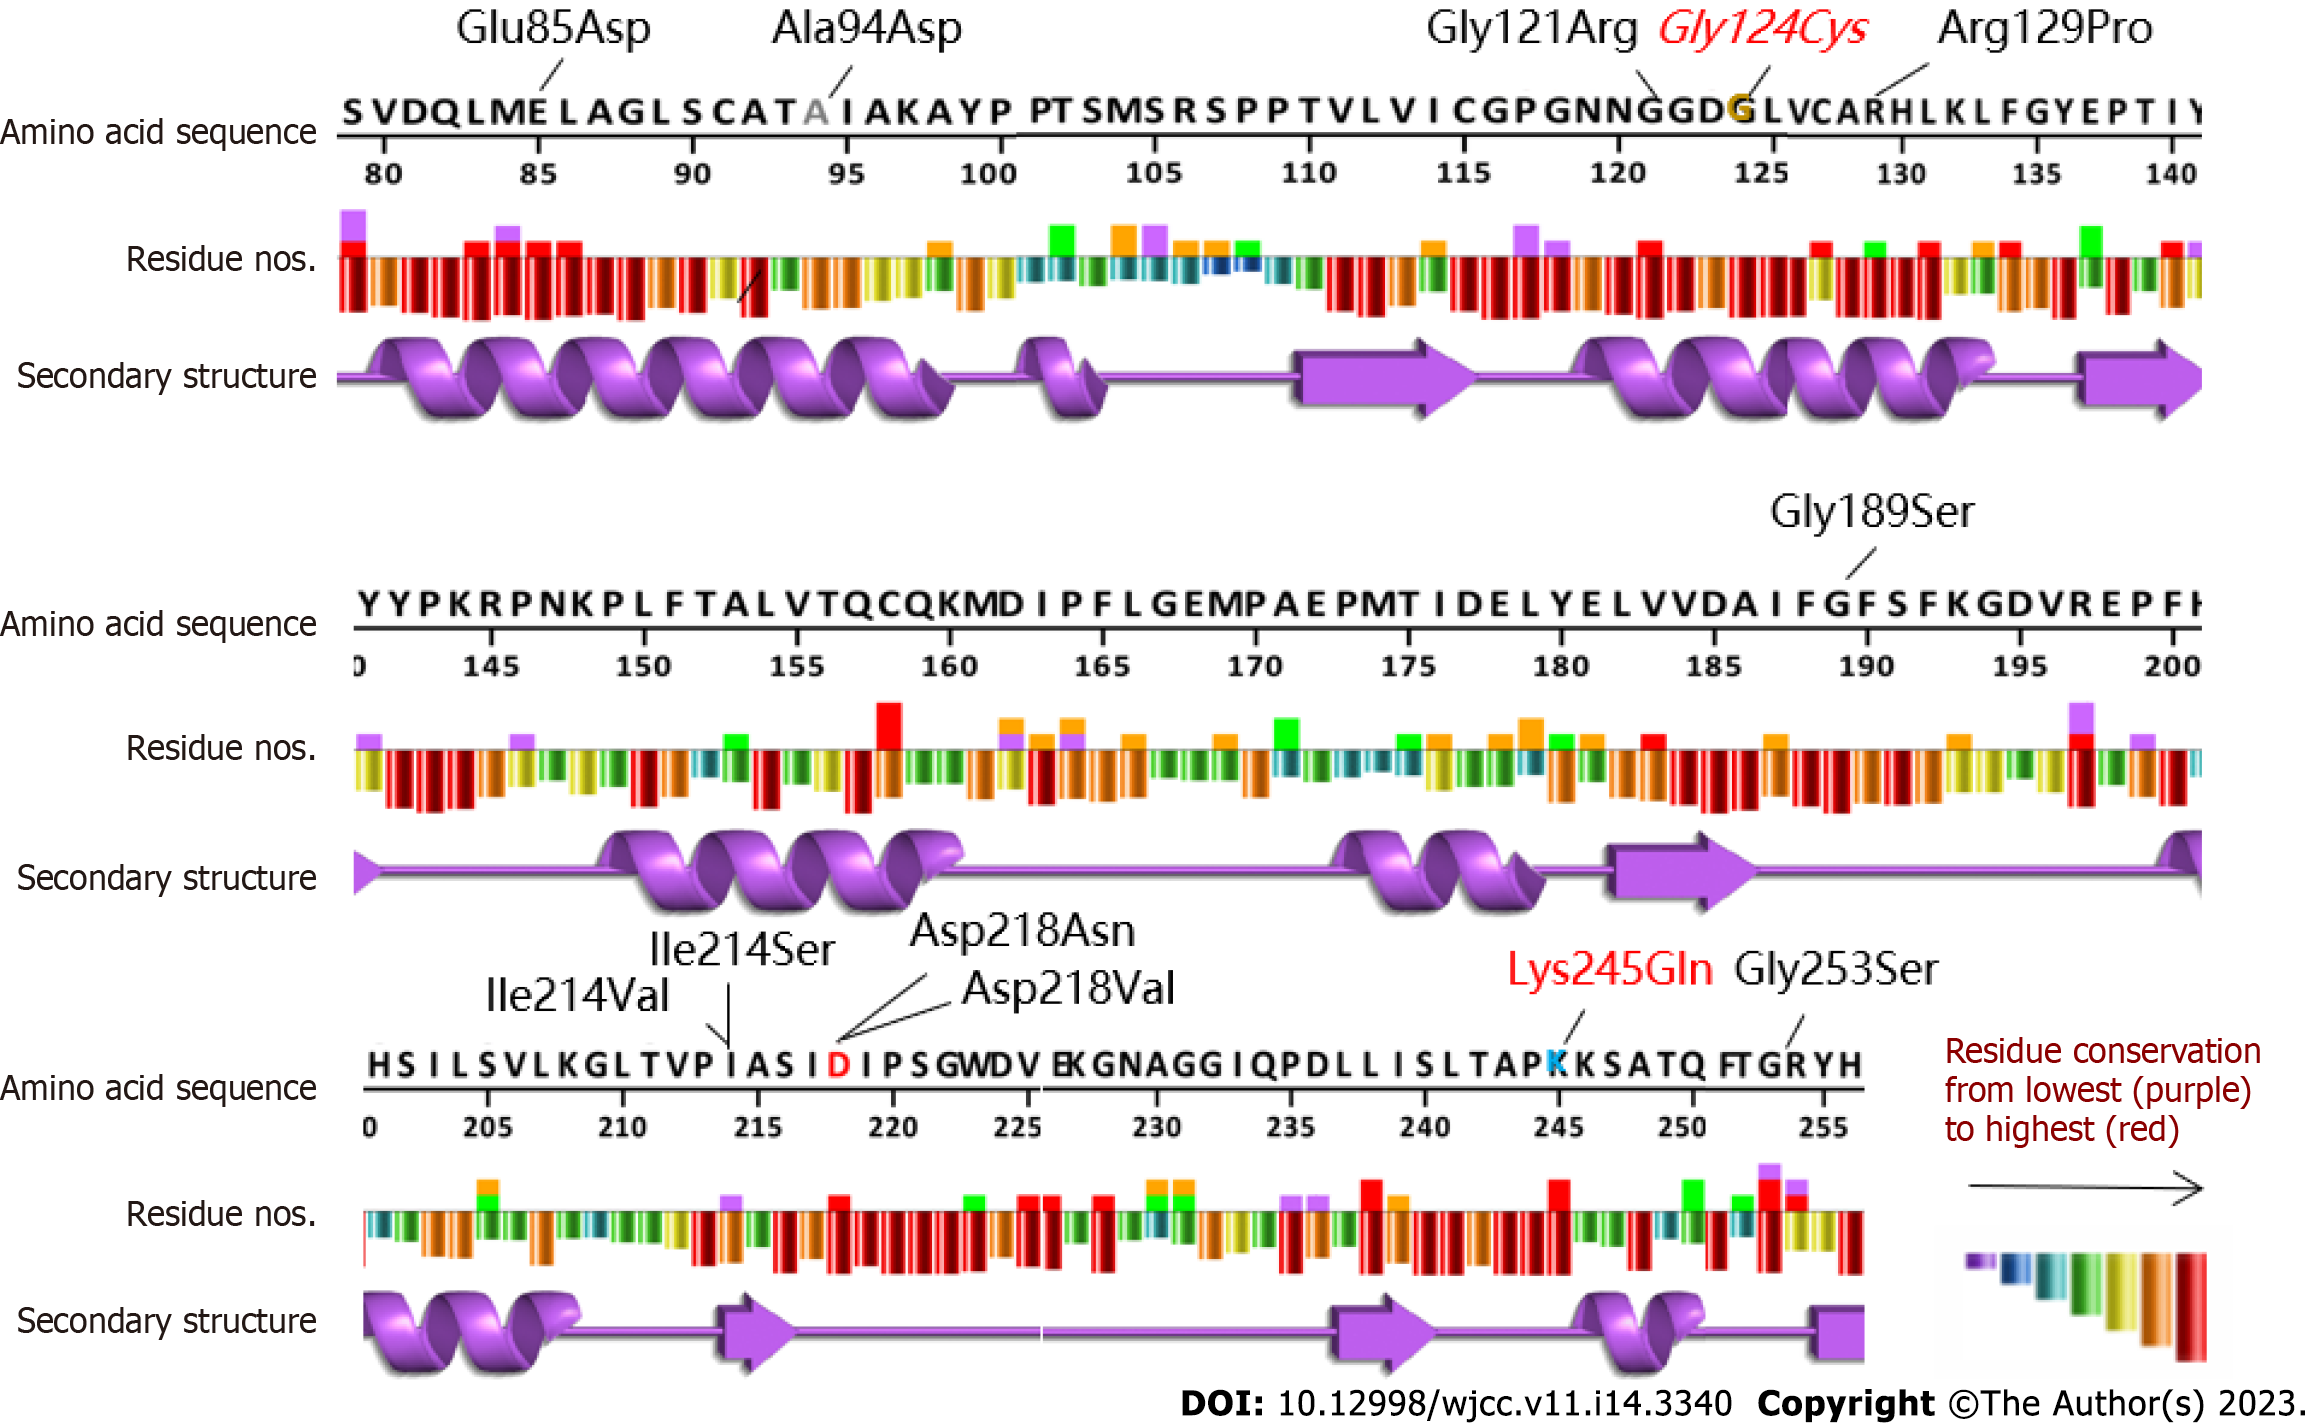
Figure 3 Conservative analysis of NAXE variation sites.
The variants are indicated in red, and the new variants are expressed in italics. The analysis tool used EMBL-EBI VarSite (https://www.ebi.ac.uk/thornton-srv/databases/VarSite) and compared > 100 homologous sequences in different species.
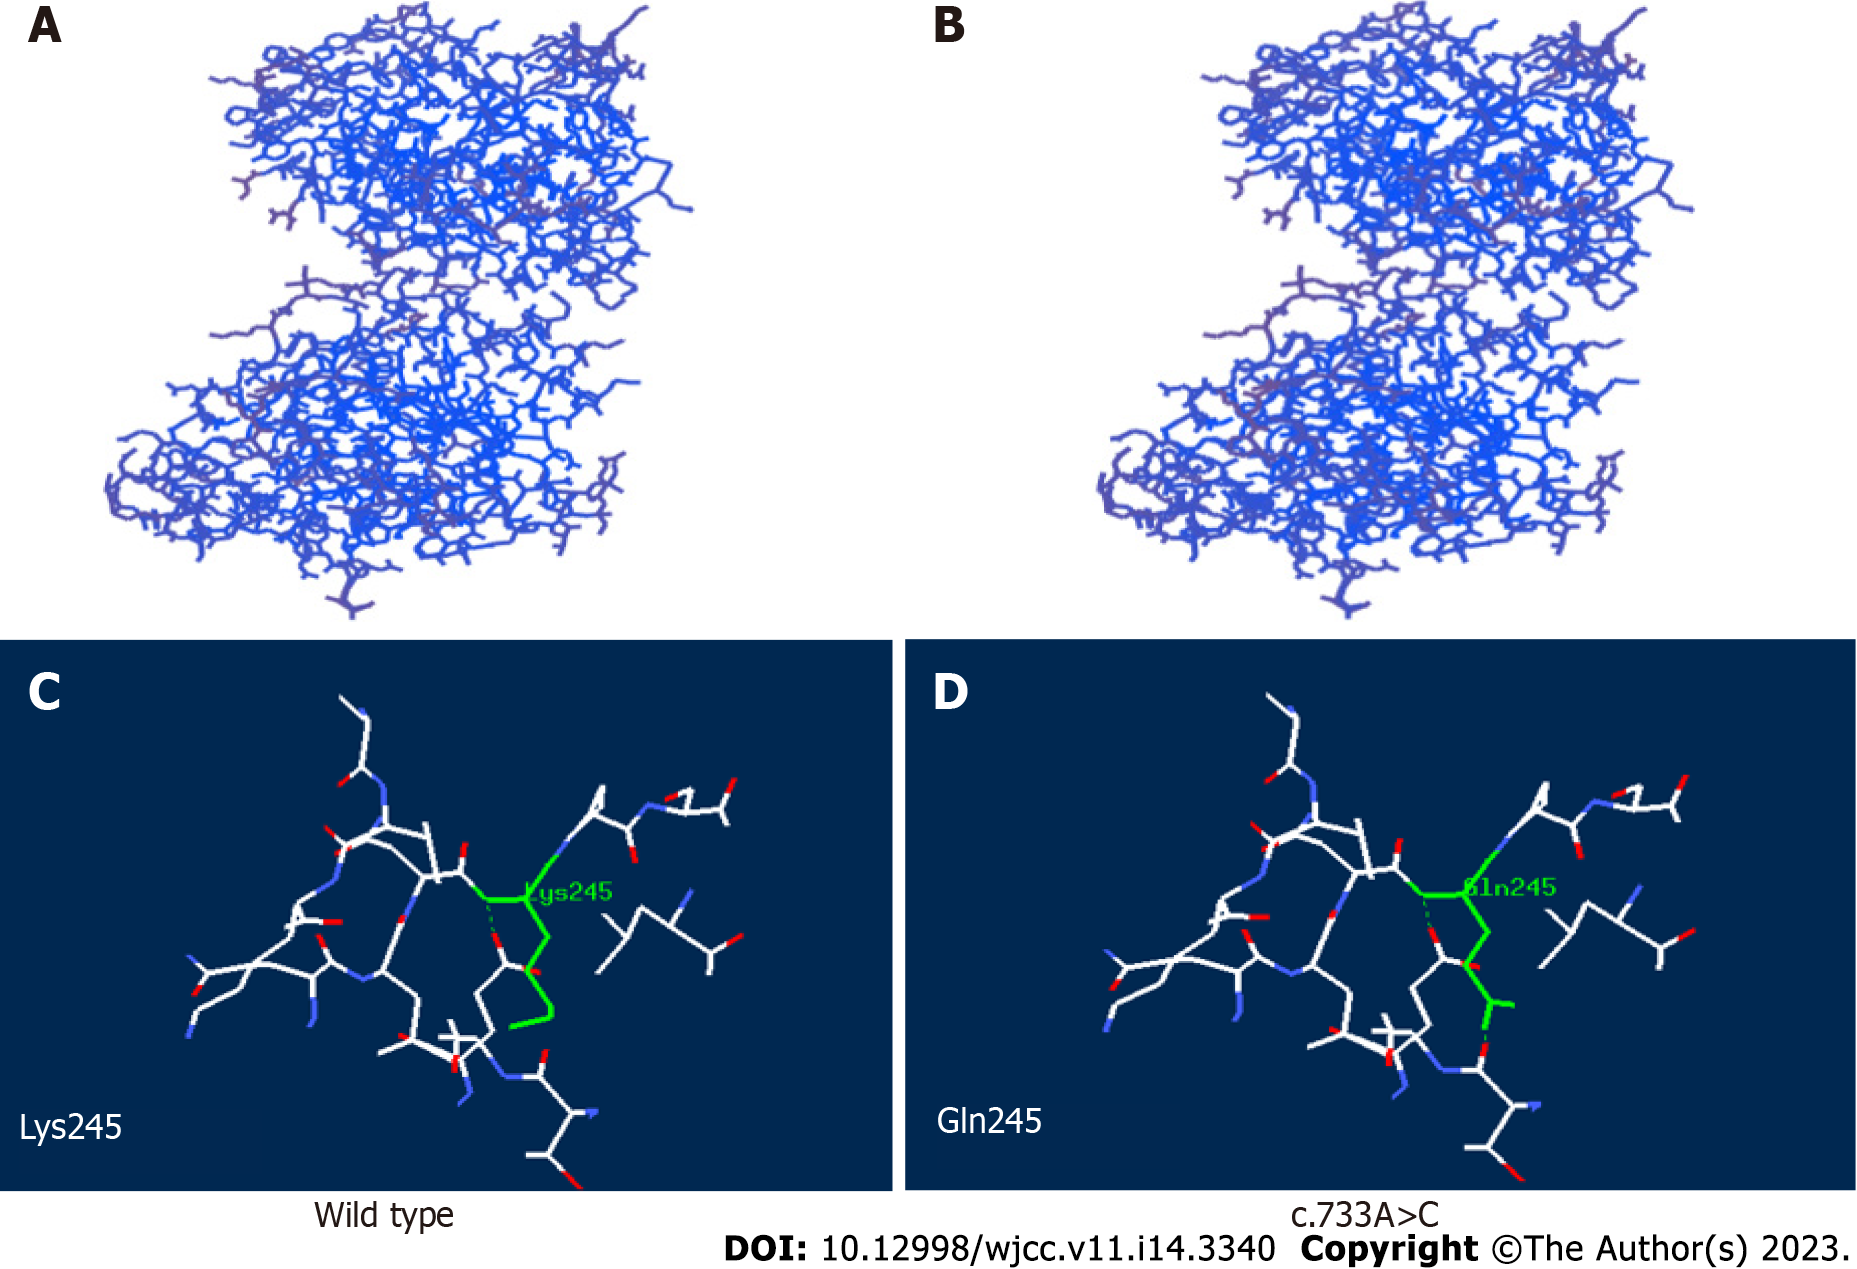
Figure 4 Structural analysis of wild-type and the variant APOA1BP with c.
733A>C mutation. A: The three-dimensional structure of wild-type (WT); B: The three-dimensional structure of the mutant; C: The residue of missense mutant site together with the nearby functional site of WT; D: The residue of missense mutant site together with the nearby functional site of the mutant. Residues of the mutant sites are highlighted in green.
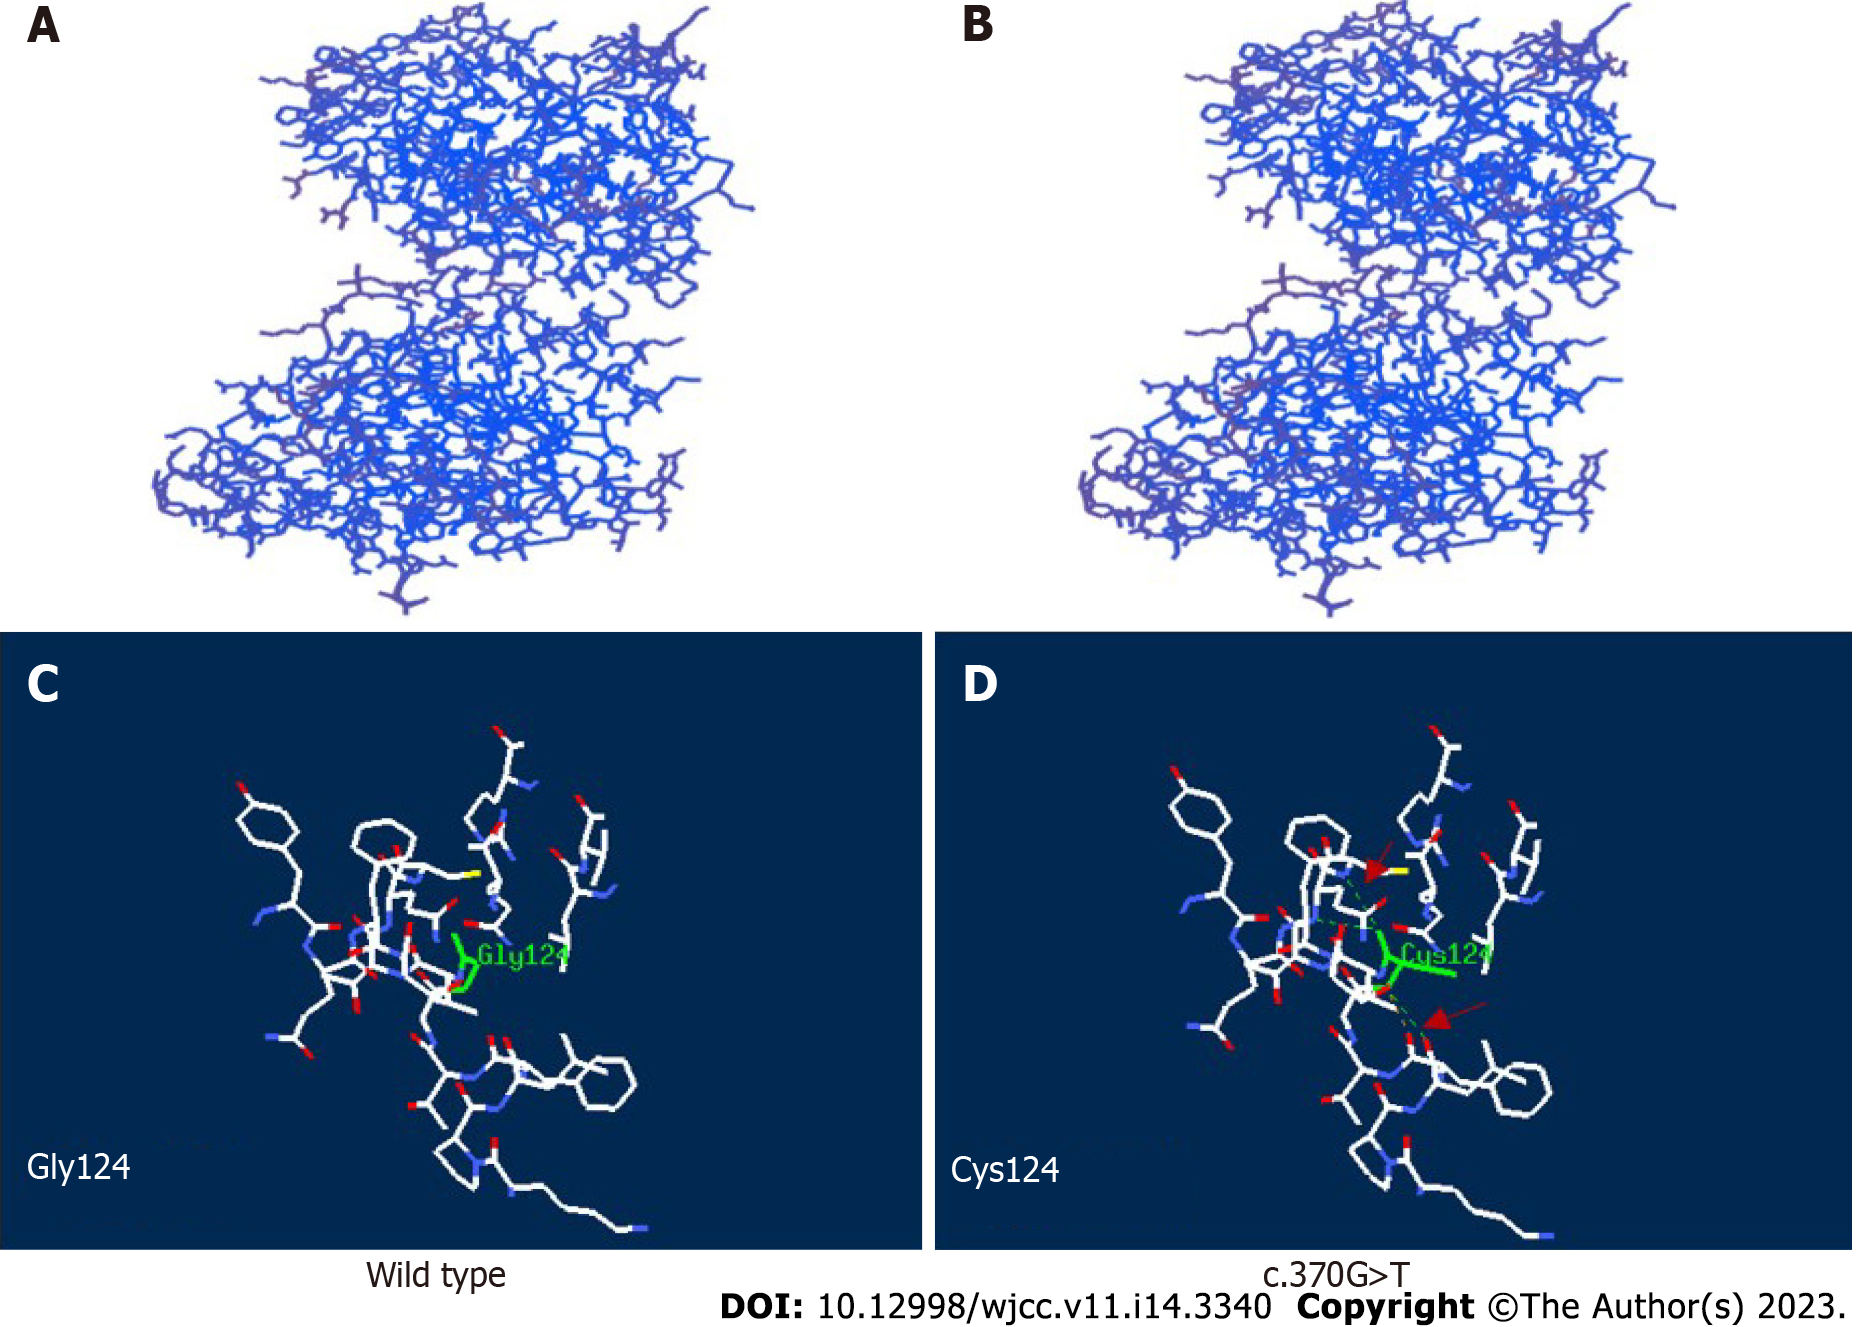
Figure 5 Structural analysis of wild-type and variant APOA1BP with c.
370G>T mutation. A: The three-dimensional structure of wild-type (WT); B: The three-dimensional structure of the mutant; C: The residue of missense mutant site together with the nearby functional site of WT; D: The residue of missense mutant site together with the nearby functional site of the mutant. Residues of the mutant sites are highlighted in green solid line. The computed hydrogen bonds are shown as green dashed lines and red arrow.
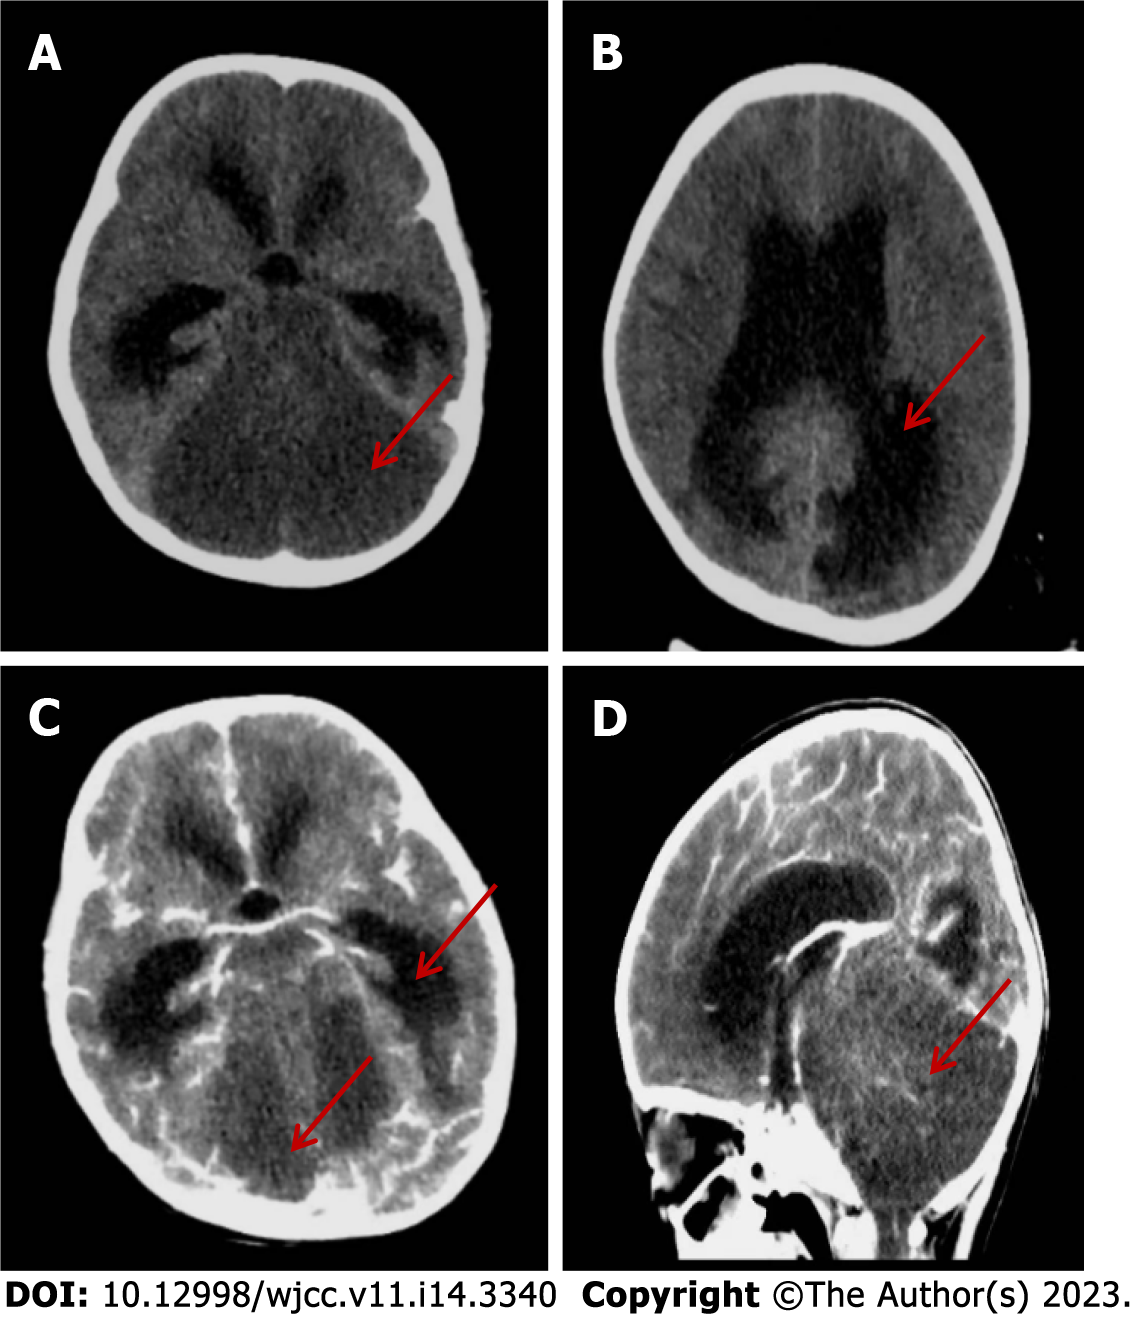
Figure 6 The imaging findings of head computed tomography on day 12 after admission.
A: There was a large area of diffuse hypointense signal in the posterior fossa, and the cerebellar parenchymal structure was unclear; B: There was marked dilatation of the supratentorial ventricles and obstructive hydrocephalus with paraventricular edema; C: No parenchymal enhancement mass was found on contrast-enhanced scan; D: The sagittal view showed supratentorial elevation with diffuse brain swelling on contrast-enhanced scan.
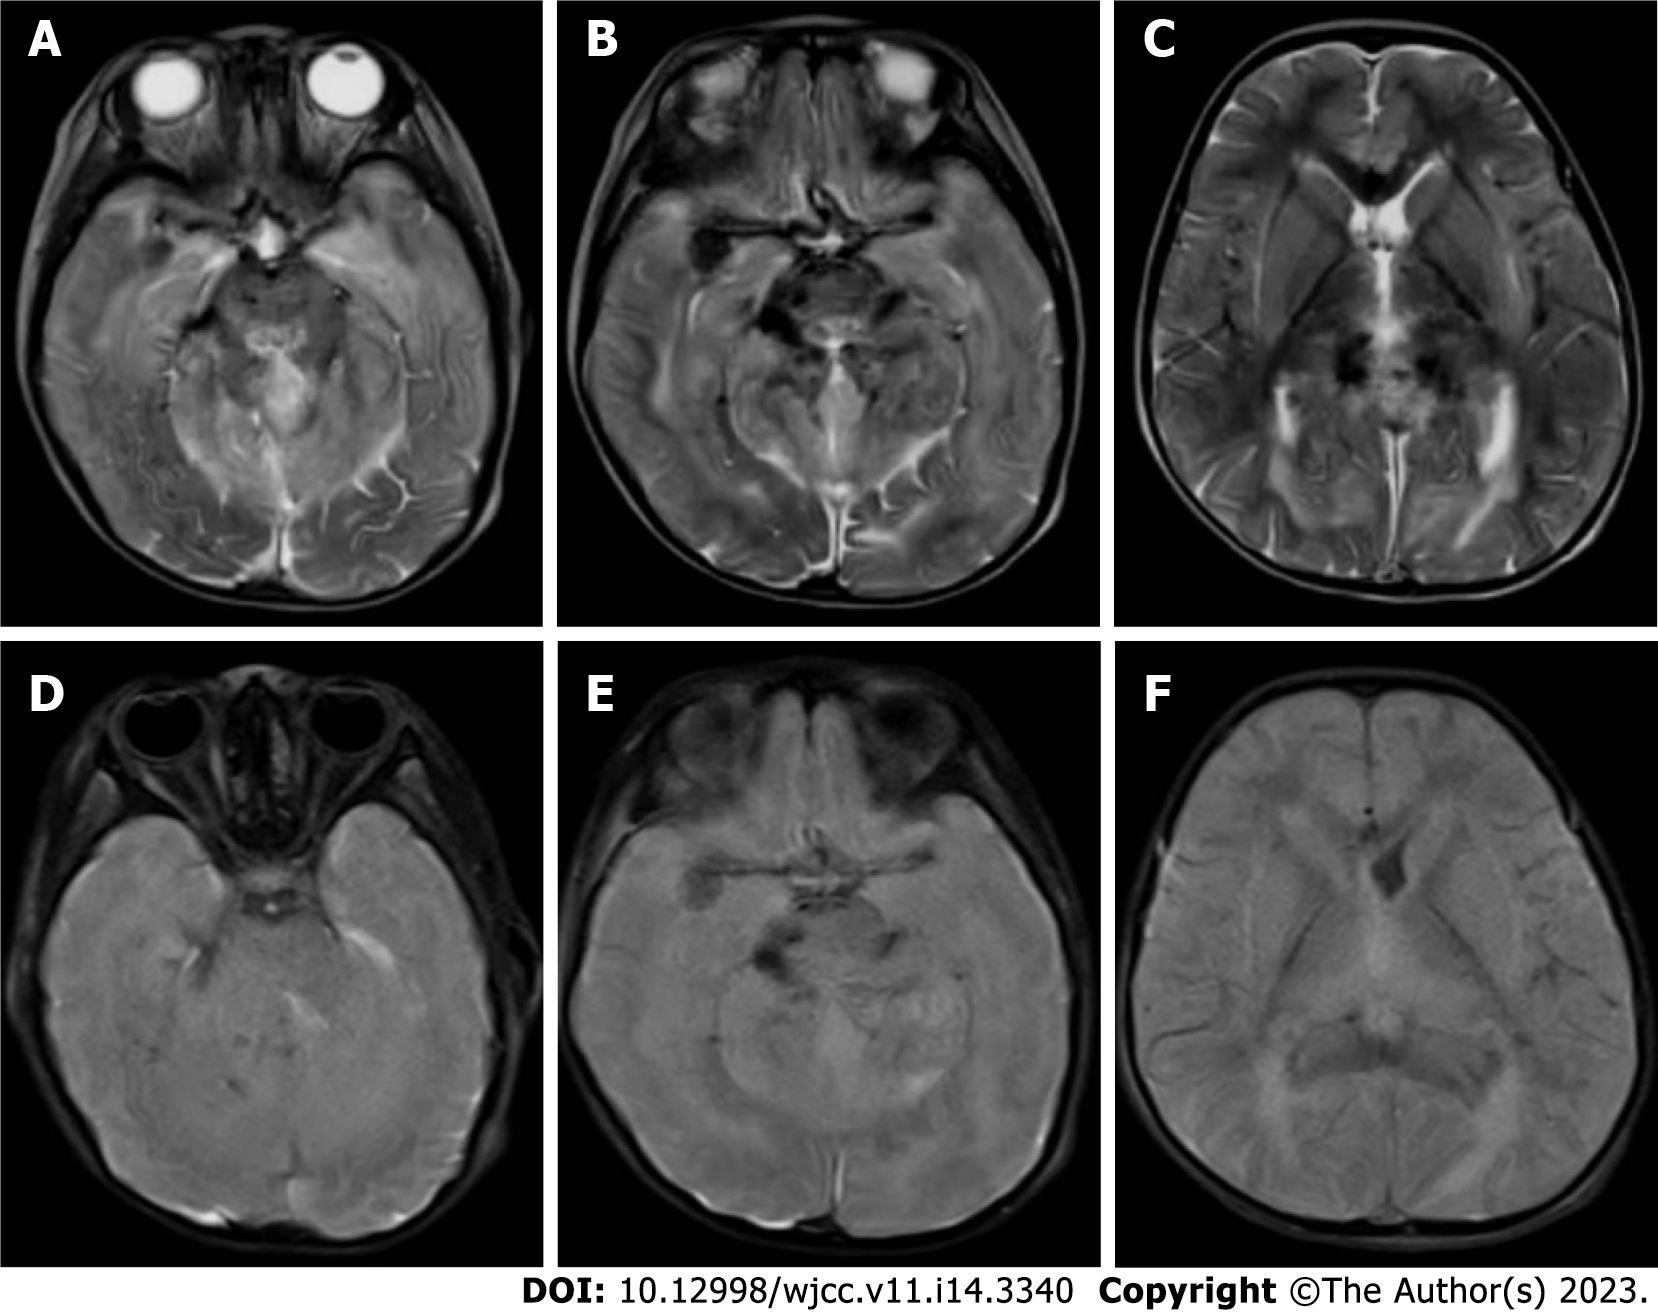
Figure 7 The imaging findings of head magnetic resonance on day 26 after admission.
A-C: T2-weighted imaging showed blurred boundary between gray matter and white matter, structural disorder of brain stem and cerebellar hemisphere, and multiple long T2 signal shadows; D-F: Fluid-attenuated inversion-recovery (FLAIR) images showed blurred gray and white matter, disordered structure, high FLAIR signal around the cerebellum and lateral ventricle, and significant narrowing of the lateral ventricle.
- Citation: Ding L, Huang TT, Ying GH, Wang SY, Xu HF, Qian H, Rahman F, Lu XP, Guo H, Zheng G, Zhang G. De novo mutation of NAXE (APOAIBP)-related early-onset progressive encephalopathy with brain edema and/or leukoencephalopathy-1: A case report. World J Clin Cases 2023; 11(14): 3340-3350
- URL: https://www.wjgnet.com/2307-8960/full/v11/i14/3340.htm
- DOI: https://dx.doi.org/10.12998/wjcc.v11.i14.3340


