Copyright
©The Author(s) 2023.
World J Clin Cases. May 16, 2023; 11(14): 3275-3281
Published online May 16, 2023. doi: 10.12998/wjcc.v11.i14.3275
Published online May 16, 2023. doi: 10.12998/wjcc.v11.i14.3275
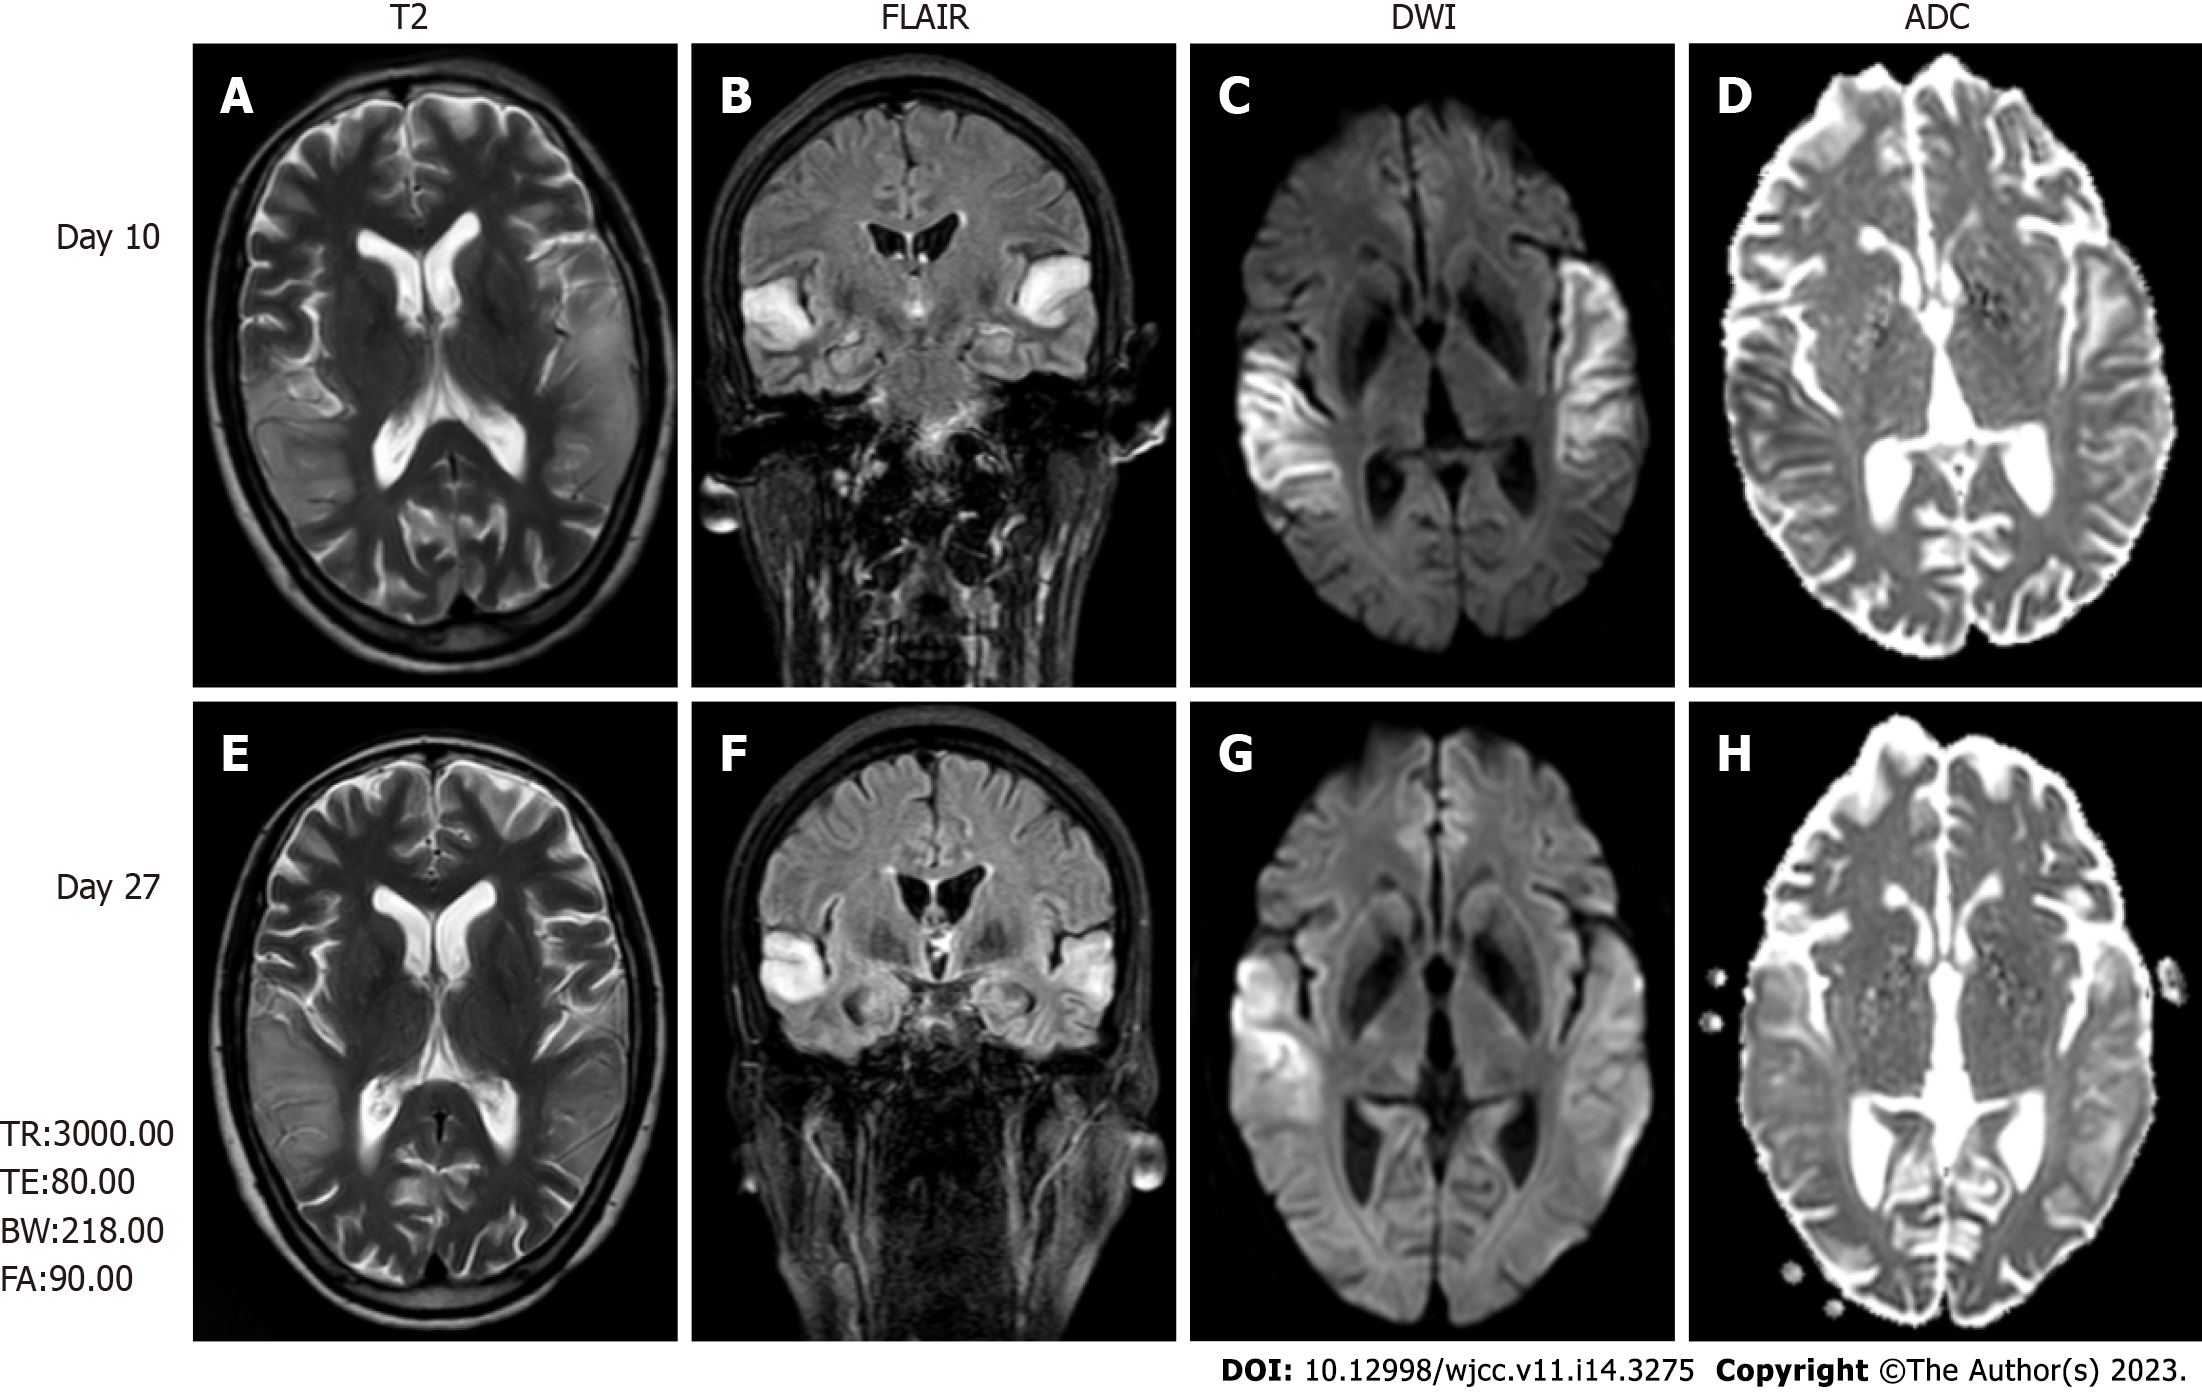
Figure 1 Brain magnetic resonance imaging, fluid-attenuated inversion recovery images, diffusion-weighted images, and apparent diffusion coefficient maps.
A and E: Brain magnetic resonance imaging (MRI) revealed high-intensity lesions in the bitemporal lobe on T2-weighted images; B and F: Fluid-attenuated inversion recovery (FLAIR) images; C, D, G and H: Diffusion-weighted images (DWI) (C and G). The parts of the lesions involving the cortex appeared hyperintense on DWI (C and G) and hypointense on apparent diffusion coefficient maps (D and H), which is consistent with cytotoxic edema. The follow-up brain MRI obtained on day 27 showed extensive reduction FLAIR/DWI signals in the left temporal lobe, without an apparent reduction in T2 signals. T2: T2-weighted images; FLAIR: Fluid-attenuated inversion recovery images; DWI: Diffusion-weighted images; ADC: Apparent diffusion coefficient.
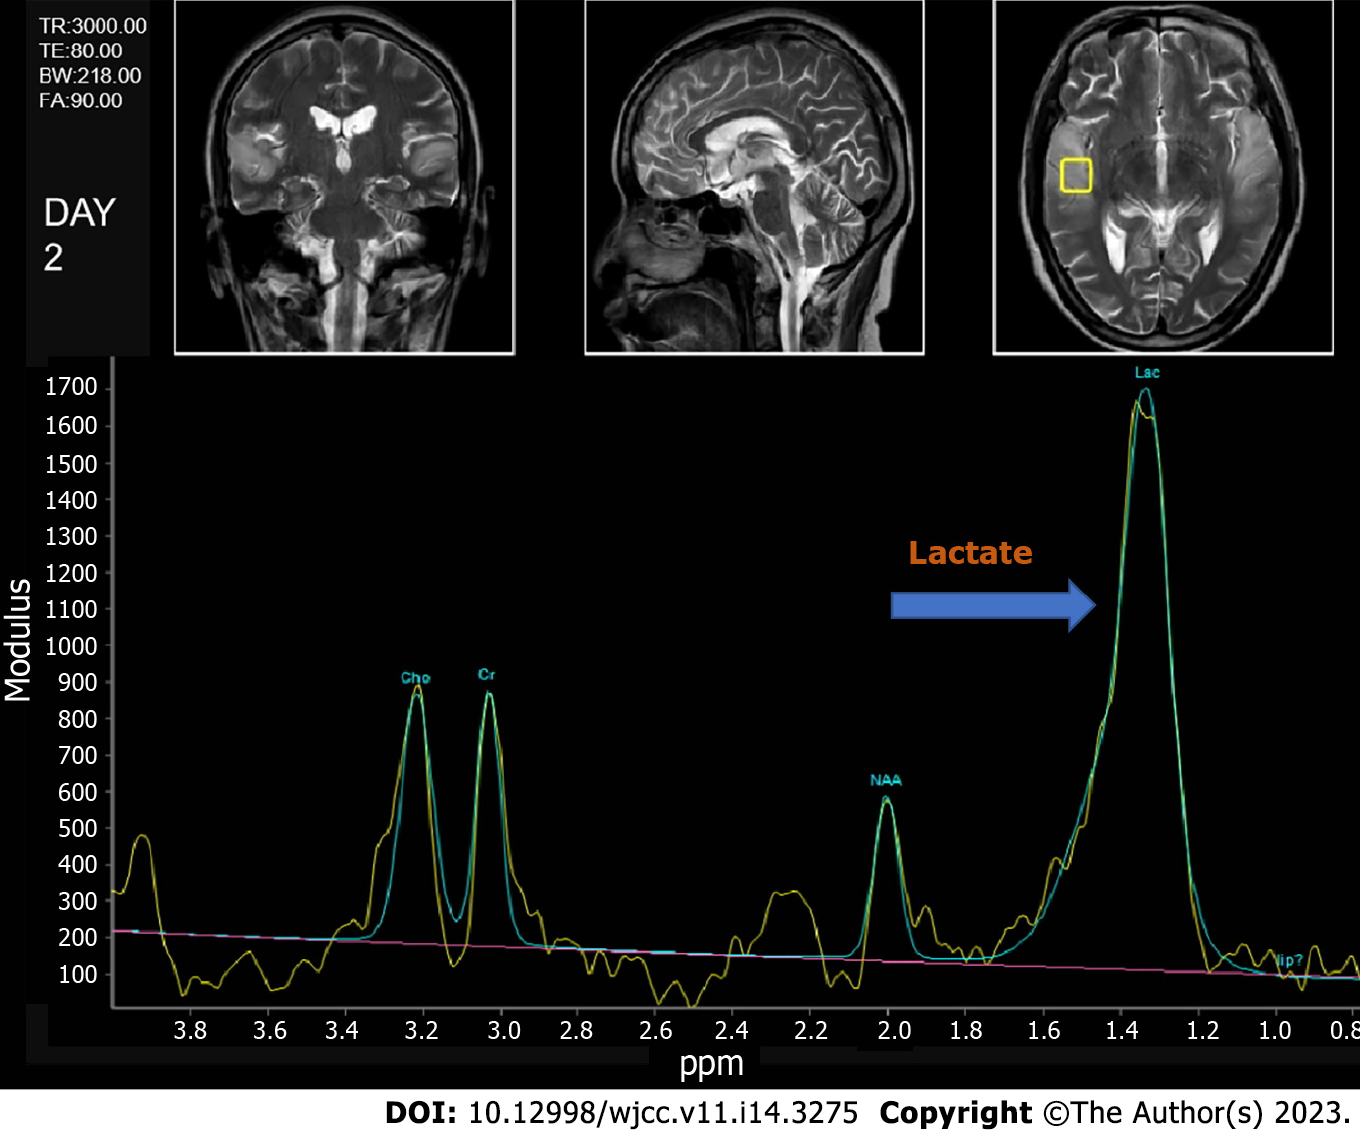
Figure 2 Brain magnetic resonance spectroscopy image, with a visible lip peak in the lesion area, a significantly increased lactate peak, and a decreased NAA peak.
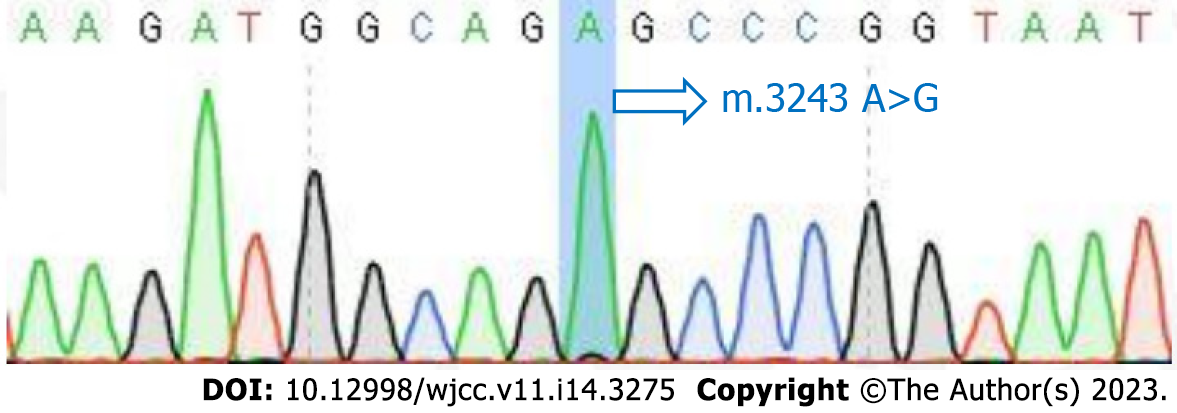
Figure 3 Results of the mitochondrial encephalomyopathy with lactic acidosis and stroke-like episodes mutation blood test.
Figure 4 The timeline of the patient's clinical course.
CT: Computed tomography; MRI: Magnetic resonance imaging; EEG: Electroencephalogram; CSF: Cerebrospinal fluid; MRS: Magnetic resonance spectroscopy; MELAS: Mitochondrial encephalopathy, lactic acidosis, and stroke-like episodes.
- Citation: Wang JW, Yuan XB, Chen HF. Late-onset mitochondrial encephalomyopathy with lactic acidosis and stroke-like episodes syndrome with mitochondrial DNA 3243A>G mutation masquerading as autoimmune encephalitis: A case report. World J Clin Cases 2023; 11(14): 3275-3281
- URL: https://www.wjgnet.com/2307-8960/full/v11/i14/3275.htm
- DOI: https://dx.doi.org/10.12998/wjcc.v11.i14.3275


