Copyright
©The Author(s) 2023.
World J Clin Cases. May 16, 2023; 11(14): 3224-3237
Published online May 16, 2023. doi: 10.12998/wjcc.v11.i14.3224
Published online May 16, 2023. doi: 10.12998/wjcc.v11.i14.3224
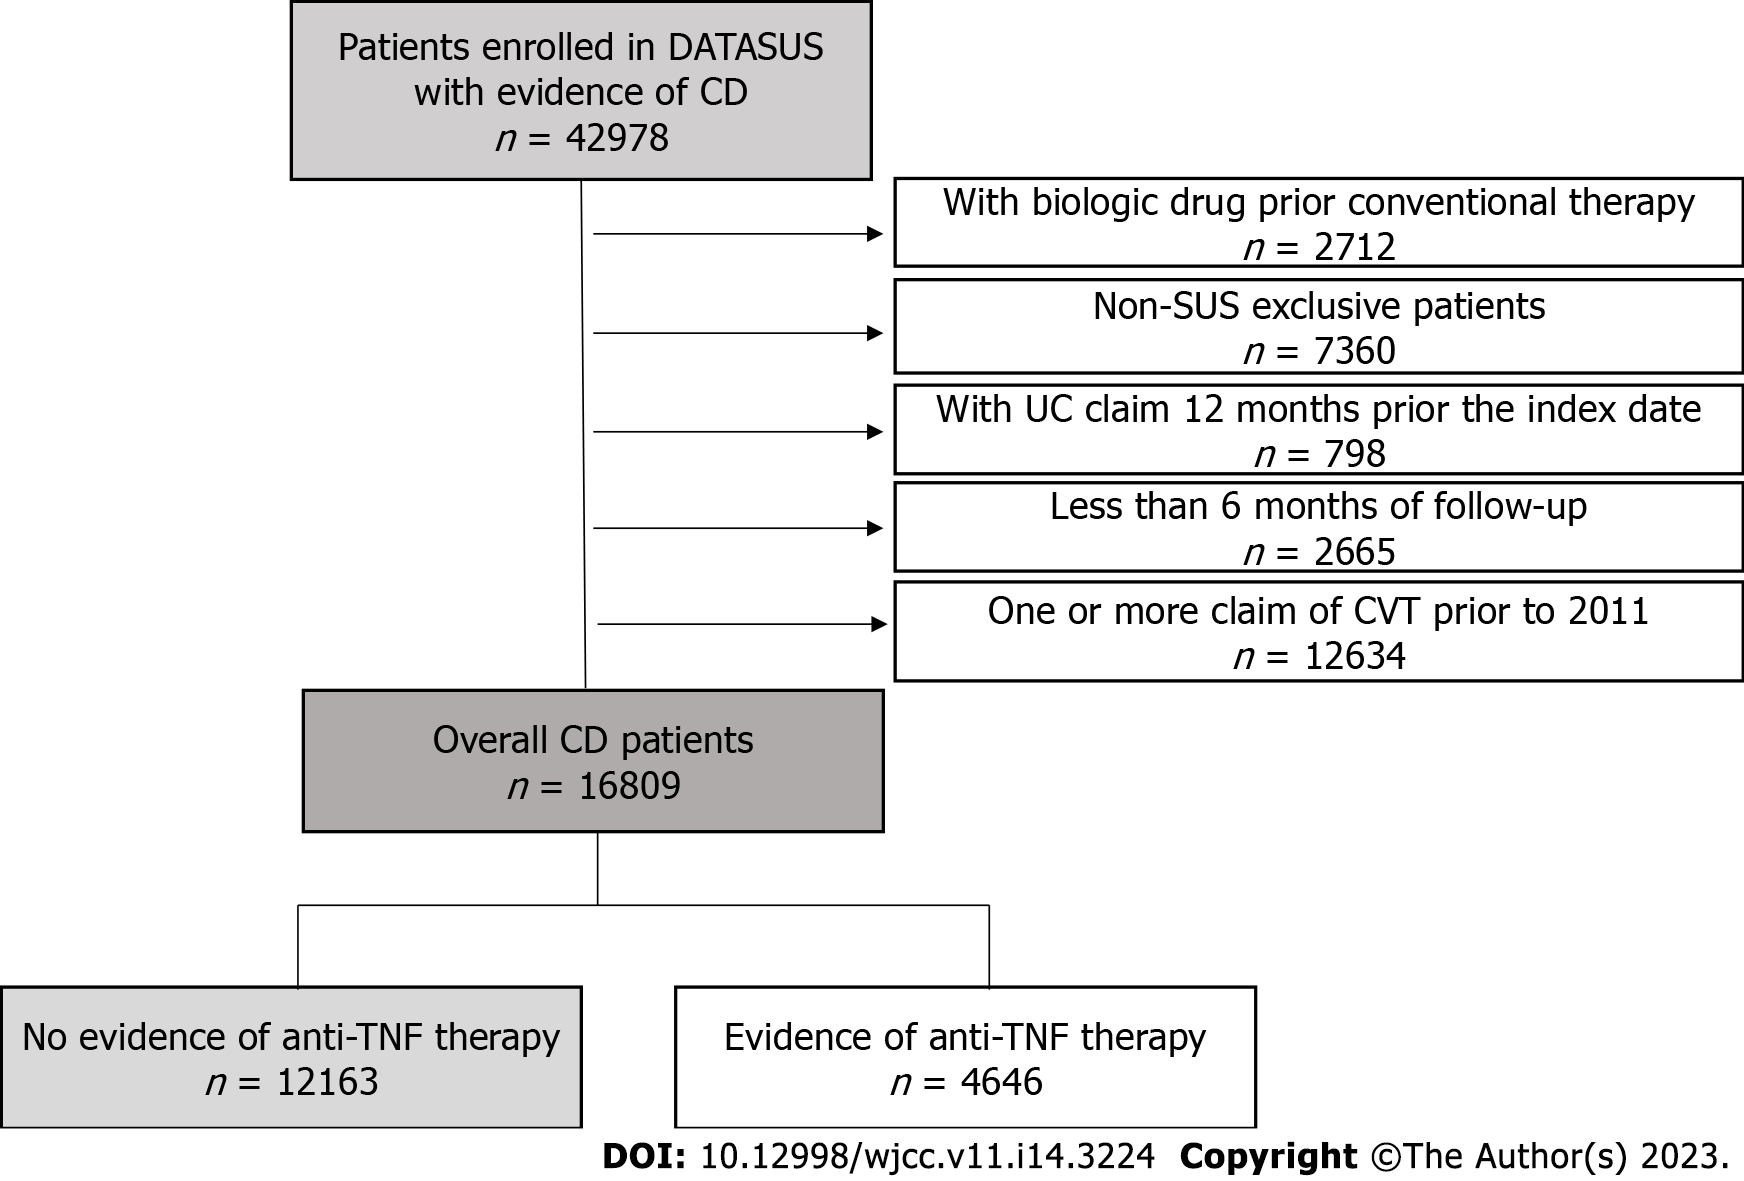
Figure 1 Patient attrition flowchart.
CD: Crohn’s disease; CVT: Conventional therapy; SUS: Sistema Único de Saúde; TNF: Tumor necrosis factor; UC: Ulcerative colitis.
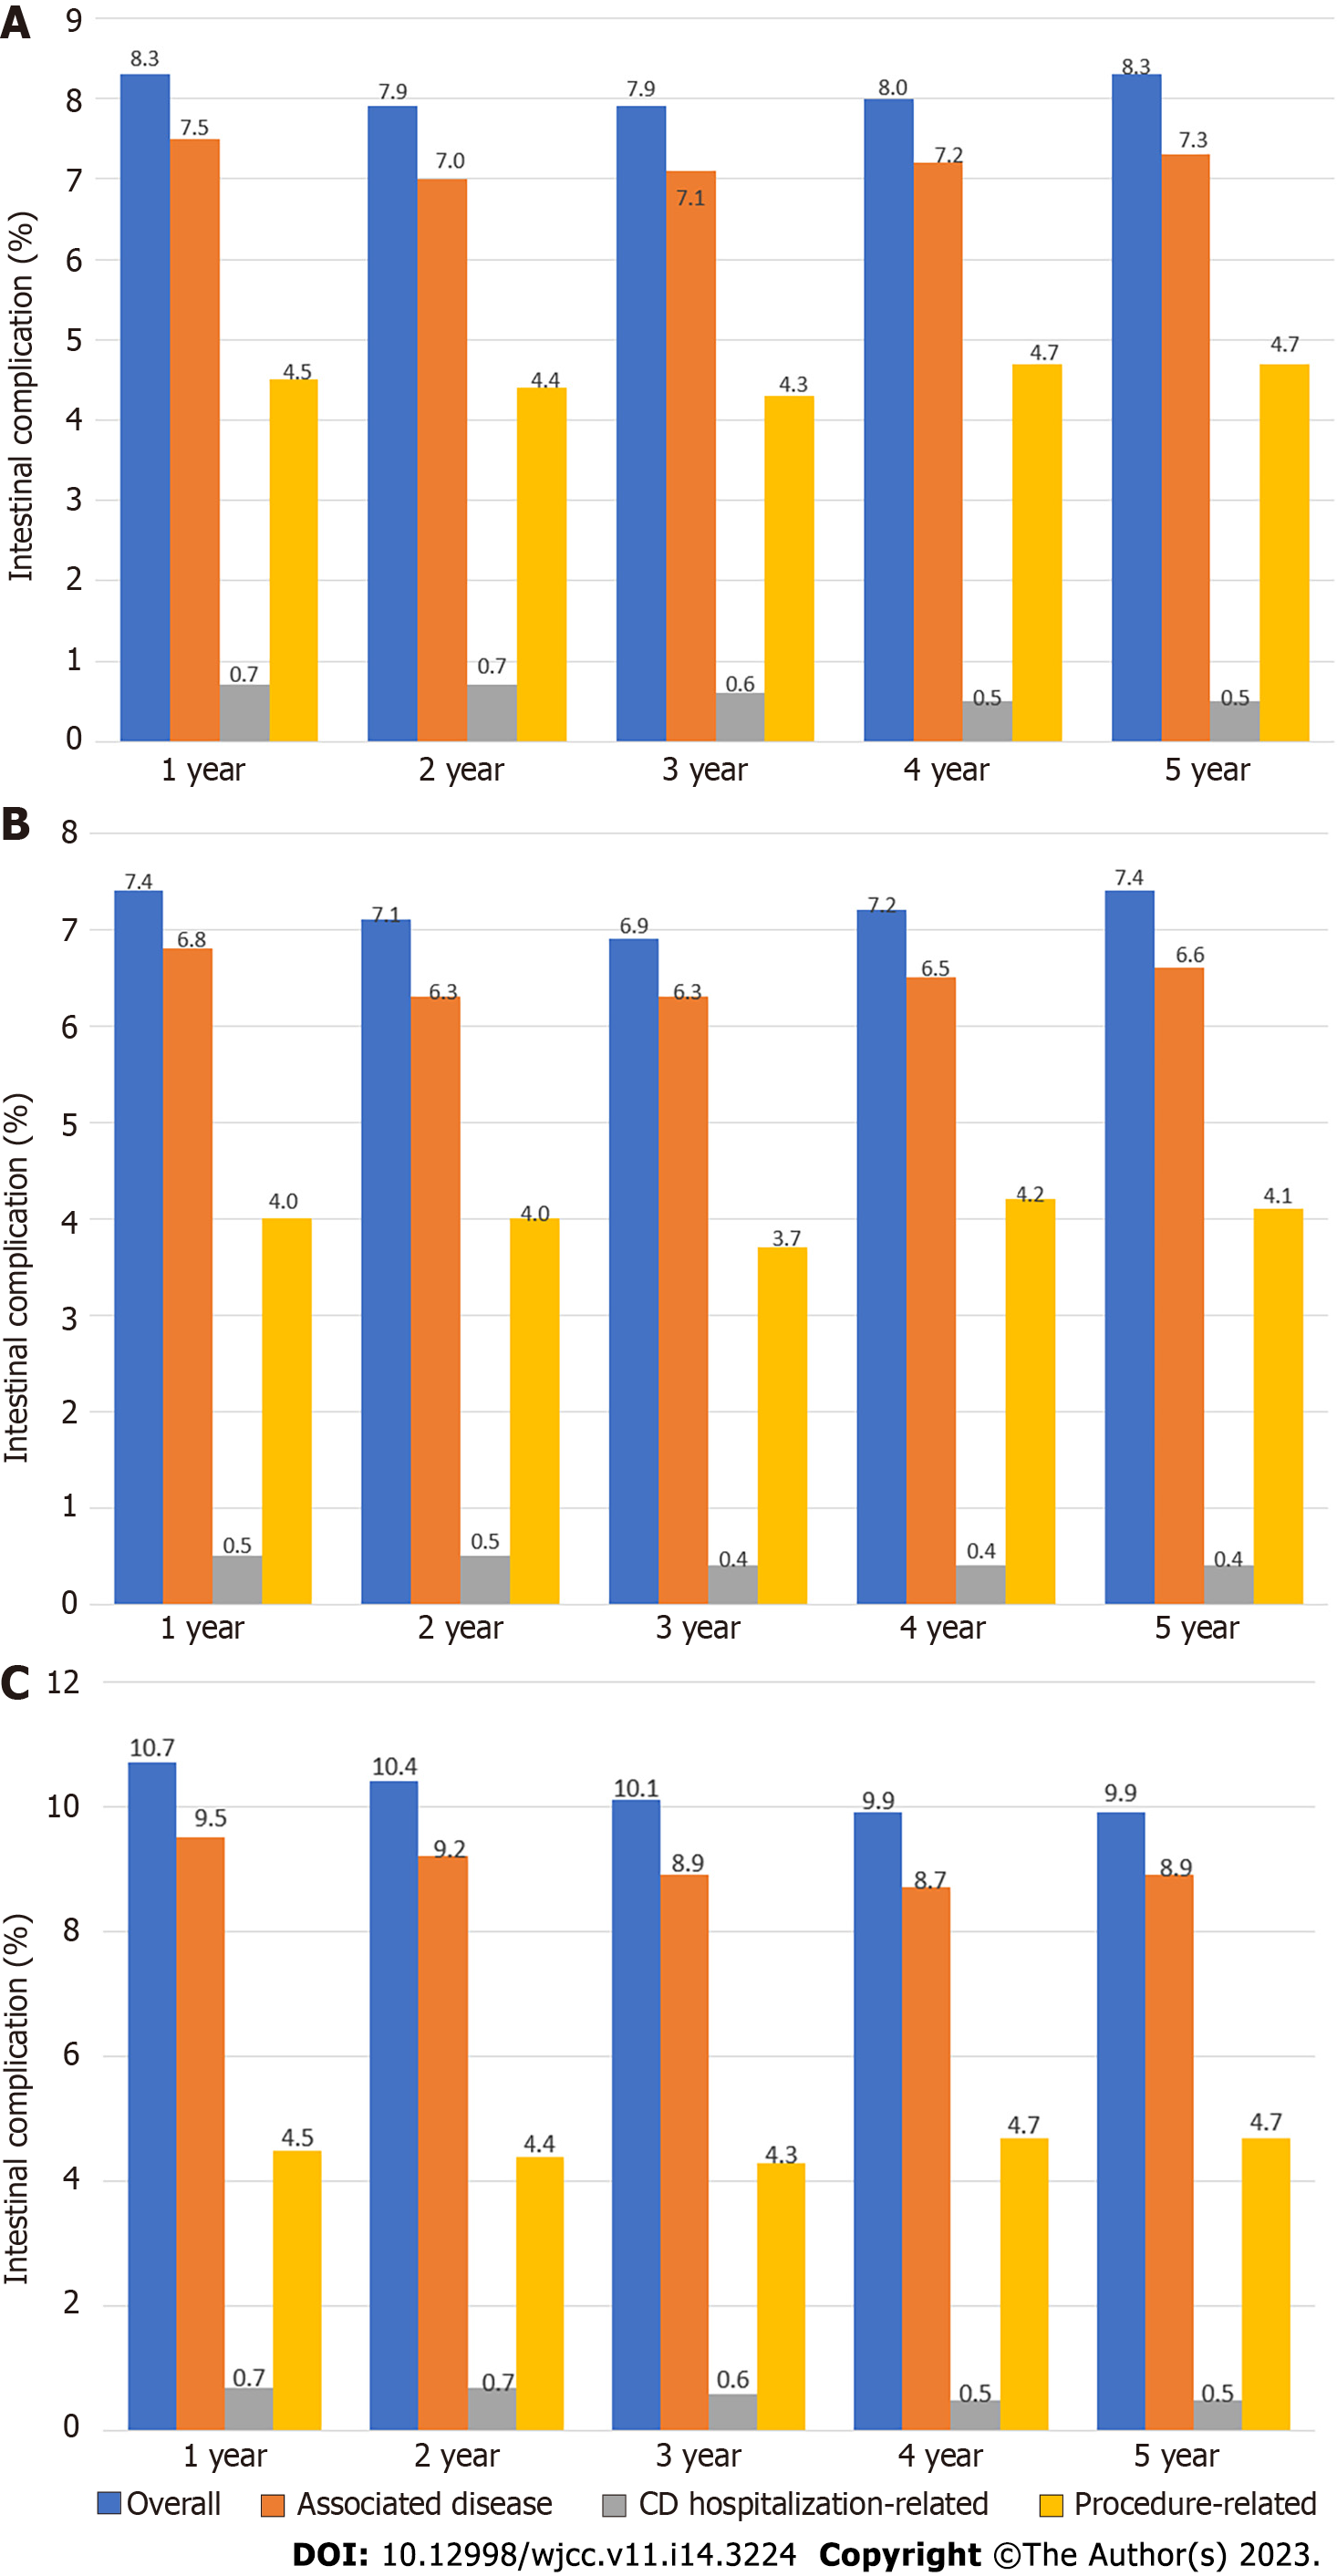
Figure 2 Annual rates of intestinal complications.
A: The overall population with CD (n = 16809); B: CVT-only population (n = 12163); C: Anti-TNF therapy population (n = 4646). CD: Crohn’s disease; CVT: Conventional therapy; TNF: Tumor necrosis factor.
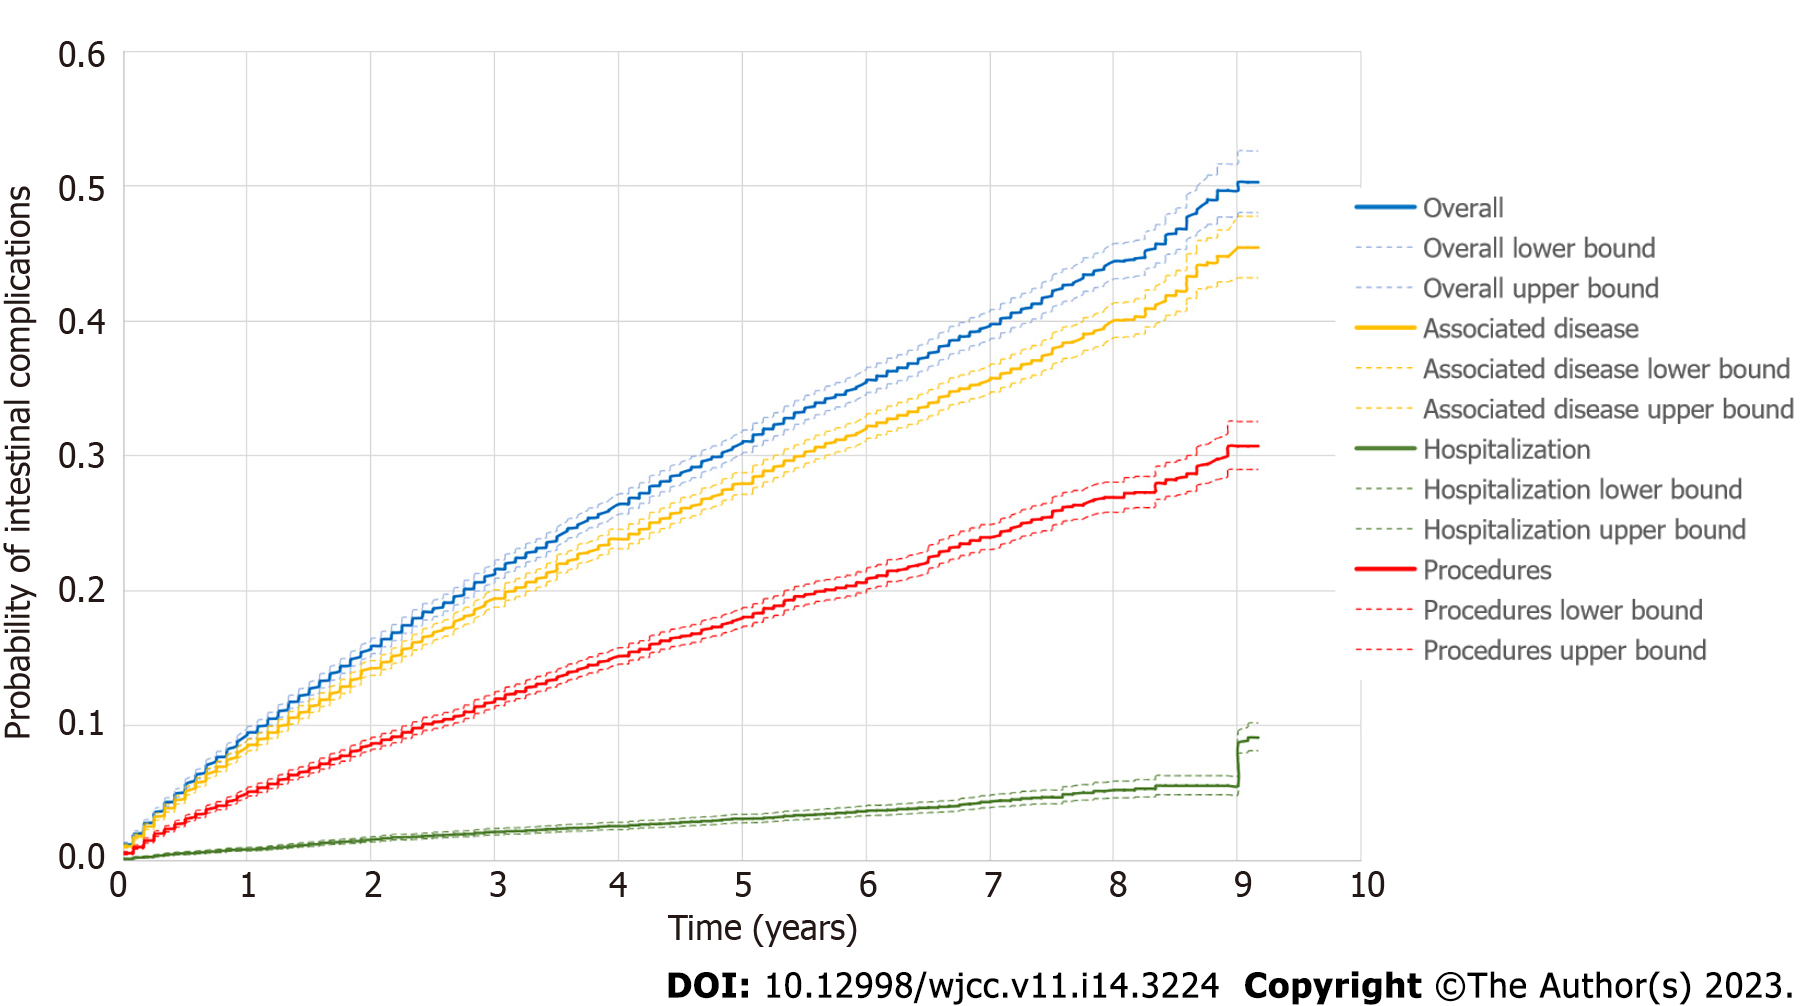
Figure 3 Kaplan–Meier curve depicting time to intestinal complications in the general population with Crohn’s disease (n = 16809) according to the type of intestinal complications (overall, associated disease, hospitalization-related, or procedure-related).
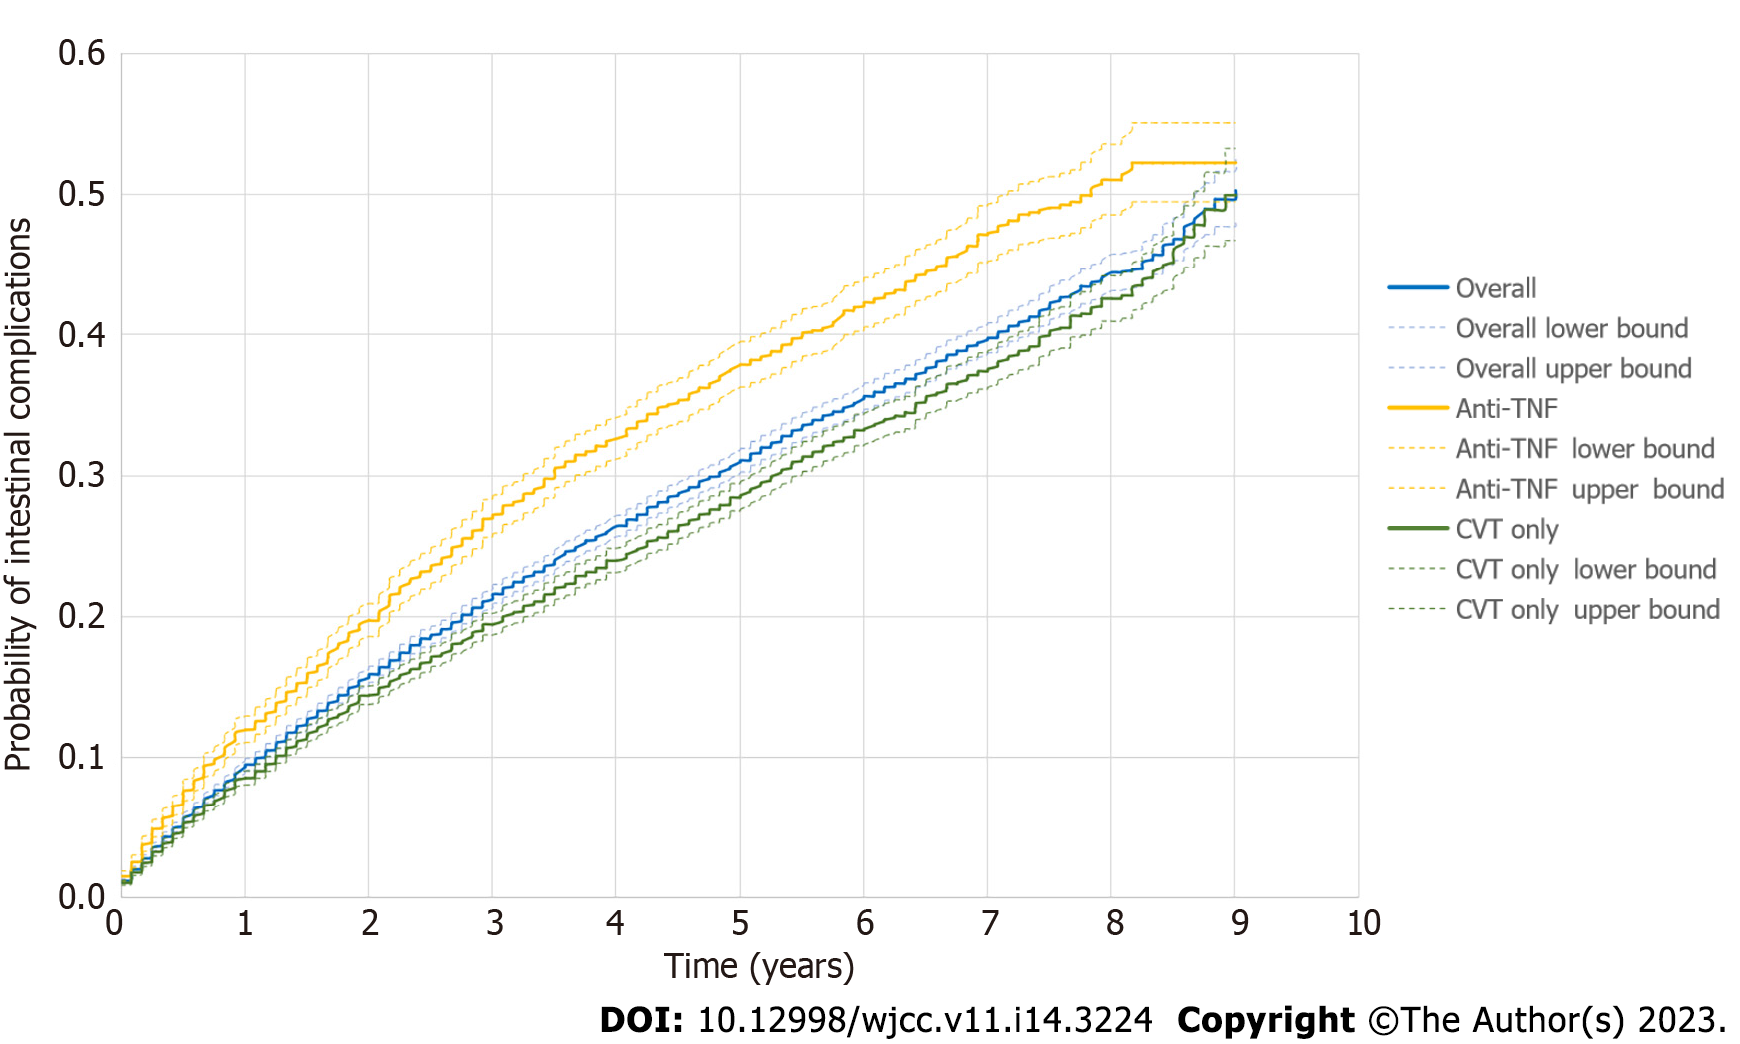
Figure 4 Kaplan–Meier curve depicting the time to intestinal complications in the general population with Crohn’s disease (n = 16809) and subgroups conventional therapy-only cohort (n = 12163) and anti-tumor necrosis factor-therapy cohort (n = 4646).
CVT: Conventional therapy; TNF: Tumor necrosis factor.
- Citation: Sassaki LY, Martins AL, Galhardi-Gasparini R, Saad-Hossne R, Ritter AMV, Barreto TB, Marcolino T, Balula B, Yang-Santos C. Intestinal complications in patients with Crohn’s disease in the Brazilian public healthcare system between 2011 and 2020. World J Clin Cases 2023; 11(14): 3224-3237
- URL: https://www.wjgnet.com/2307-8960/full/v11/i14/3224.htm
- DOI: https://dx.doi.org/10.12998/wjcc.v11.i14.3224


