Copyright
©The Author(s) 2023.
World J Clin Cases. Apr 16, 2023; 11(11): 2474-2481
Published online Apr 16, 2023. doi: 10.12998/wjcc.v11.i11.2474
Published online Apr 16, 2023. doi: 10.12998/wjcc.v11.i11.2474
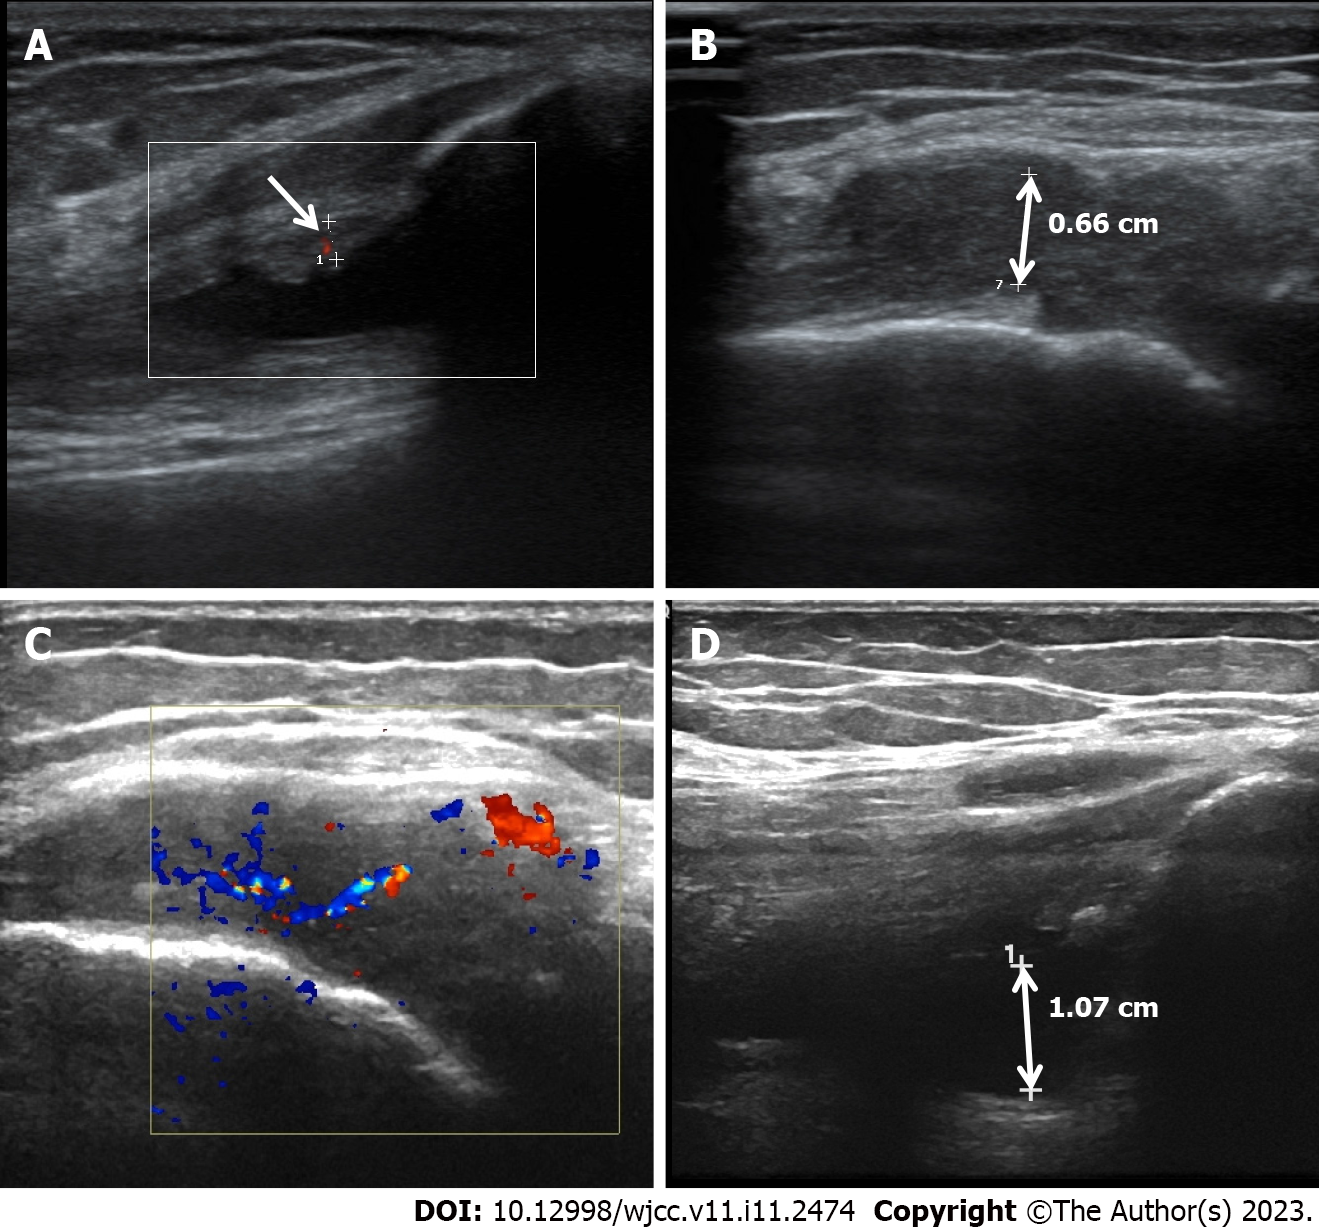
Figure 1 Doppler flow imaging and ultrasonographic pictures.
A: Doppler flow imaging shows a few punctate blood flow signals in articular cavity (arrow); B: Ultrasonographic pictures showed that the synovial membrane of the joint was thickened, about 0.66 cm at the thickest point (bidirectional arrow); C: Doppler flow imaging shows abundant blood flow signal in articular cavity. D: Ultrasonographic pictures showed that the synovial membrane of the joint was thickened, about 1.07 cm at the thickest part (bidirectional arrow).
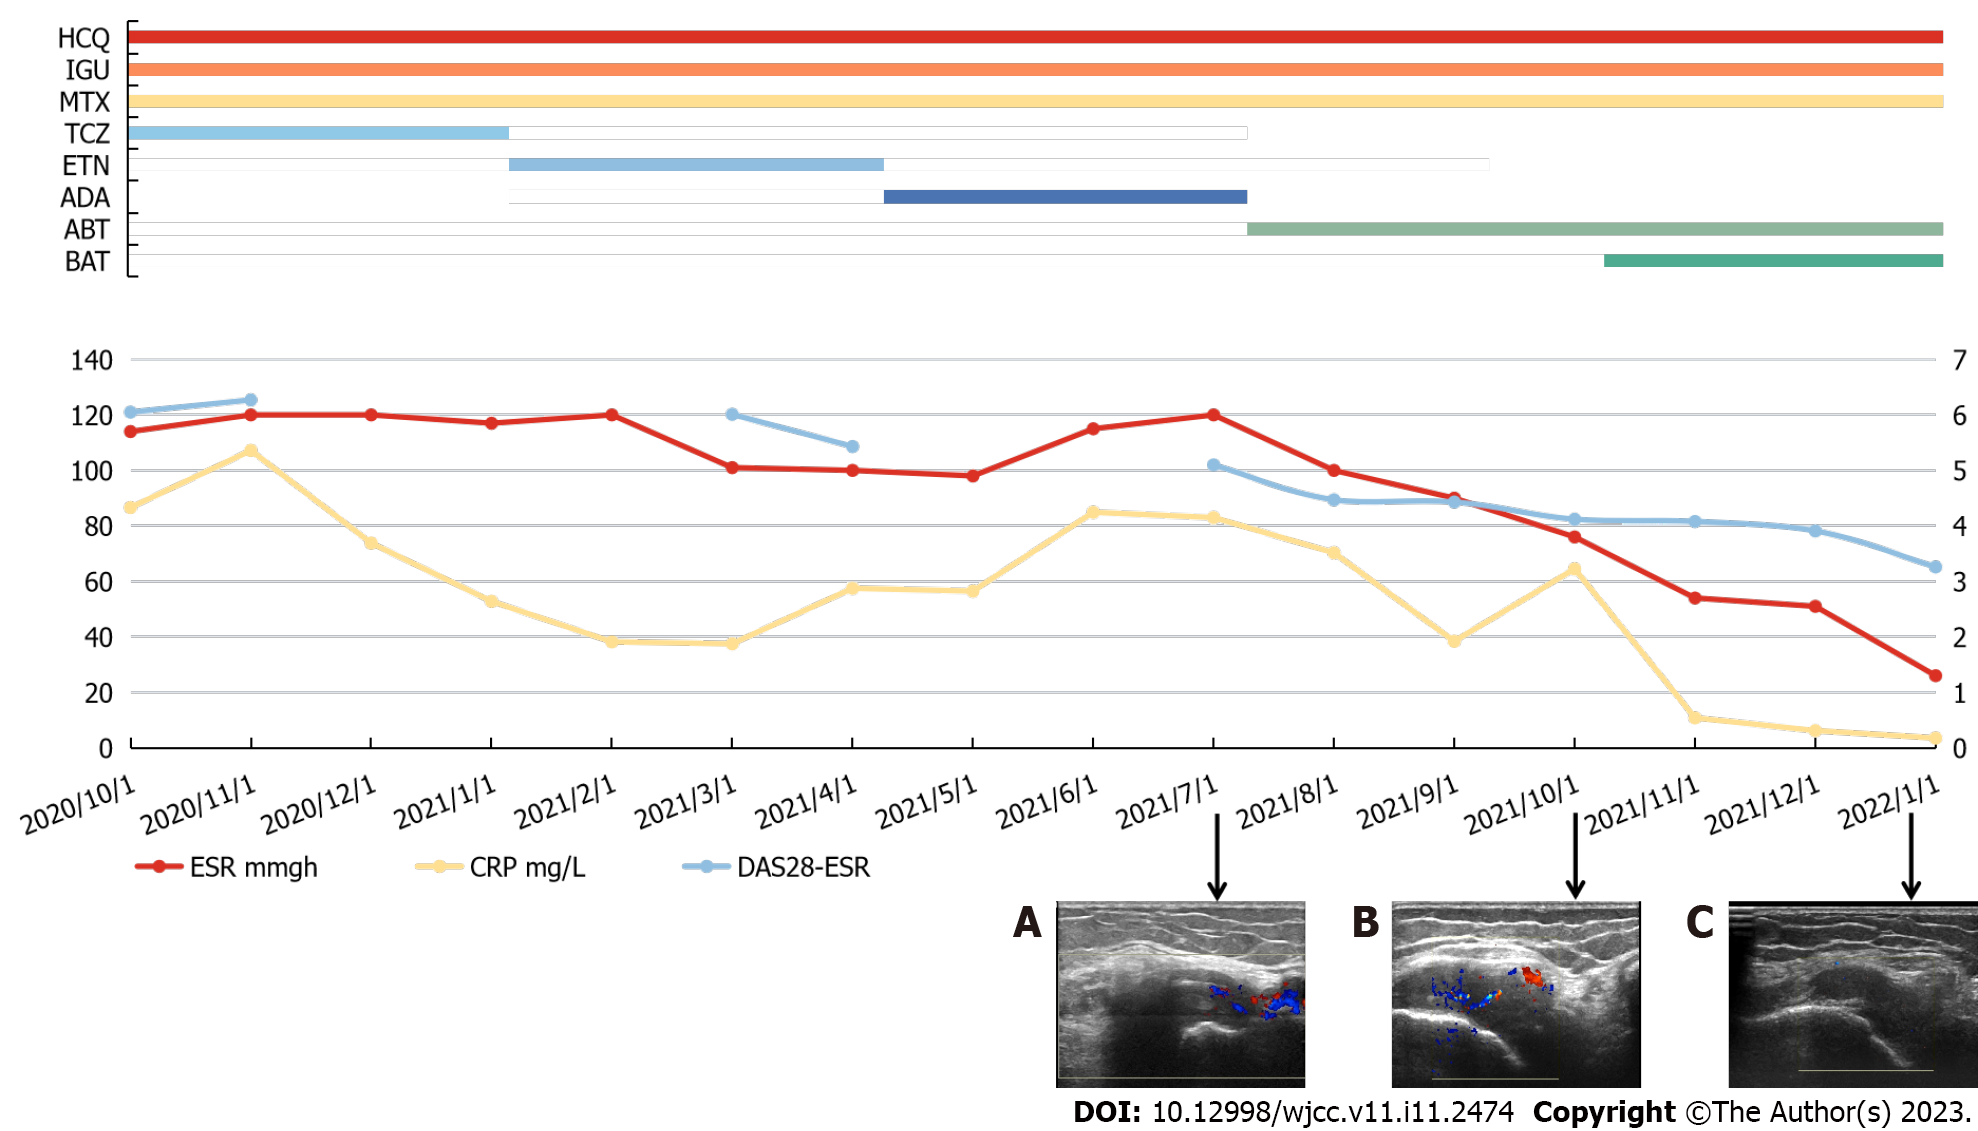
Figure 2 Clinical course of the patient (this statistic does not include tofacitinib because it was only utilized for two weeks).
A: Doppler flow imaging showed abundant blood flow signal in the articular cavity in 2021-7-1 (arrow); B: Doppler flow imaging showed abundant blood flow signal in the articular cavity in 2021-10-1 (arrow); C: Doppler flow imaging showed a few punctate blood flow signal in the articular cavity in 2022-1-1 (arrow); HCQ: Hydroxychloroquine, 400 mg/day; IGU: Iguratimod, 50 mg/day; MTX: Methotrexate, 12.5 mg /week; TCZ: Tocilizumab, 400 mg/4 weeks; ETN: Etanercept, 50 mg/week; ADA: Adalimumab, 40 mg/2week; ABT: Abatacept, 250 mg/week; BAT: Bbaricitinib, 2 mg/day; ESR: Erythrocyte sedimentation rate; CRP: C-reactive protein; DAS28-ESR: Disease Activity Score for 28 joints with erythrocyte sedimentation rate.
- Citation: Qi JP, Jiang H, Wu T, Zhang Y, Huang W, Li YX, Wang J, Zhang J, Ying ZH. Difficult-to-treat rheumatoid arthritis treated with Abatacept combined with Baricitinib: A case report. World J Clin Cases 2023; 11(11): 2474-2481
- URL: https://www.wjgnet.com/2307-8960/full/v11/i11/2474.htm
- DOI: https://dx.doi.org/10.12998/wjcc.v11.i11.2474


