Copyright
©The Author(s) 2023.
World J Clin Cases. Apr 16, 2023; 11(11): 2374-2385
Published online Apr 16, 2023. doi: 10.12998/wjcc.v11.i11.2374
Published online Apr 16, 2023. doi: 10.12998/wjcc.v11.i11.2374
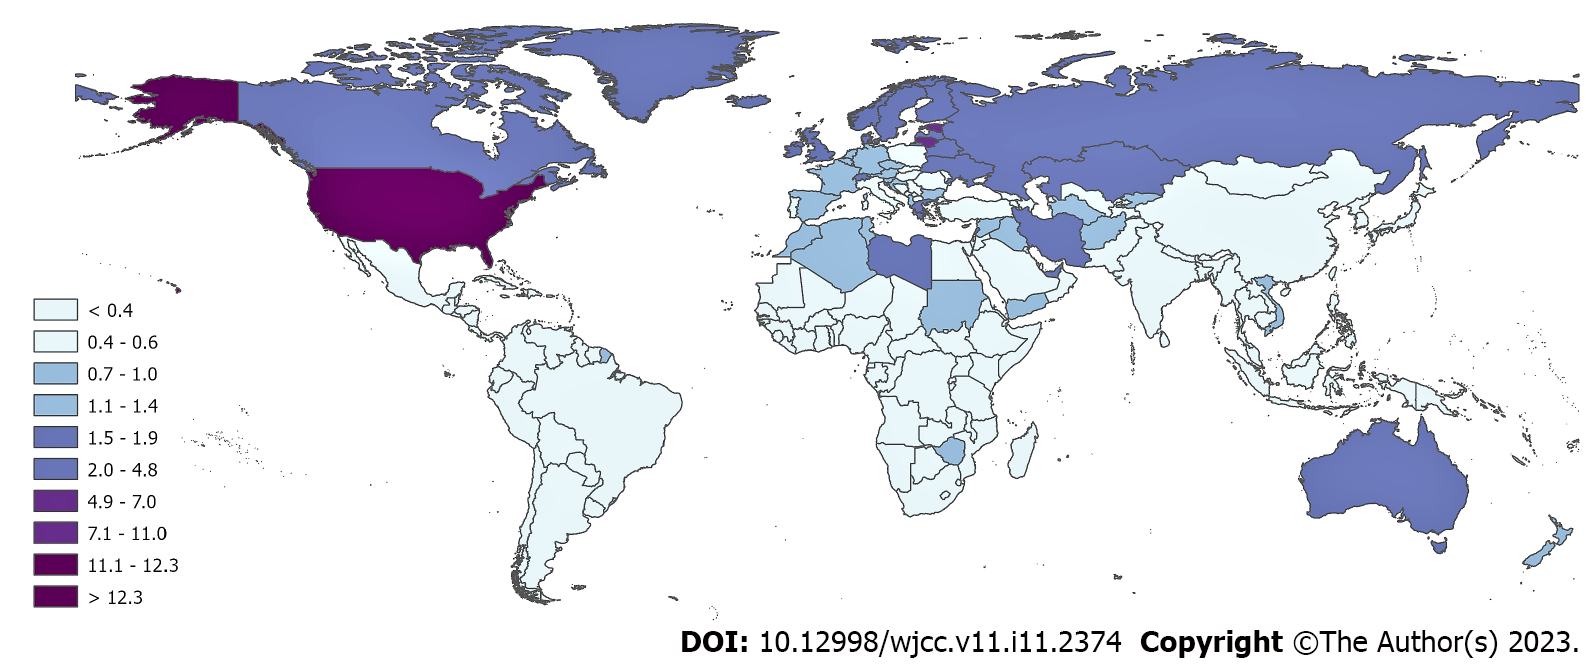
Figure 1 Death rates (number of deaths per 100000 individuals in 2019) from opioid overdoses in the world.
Source: IHME, Global Burden of Disease, 2019 (https://www.healthdata.org/gbd/2019). Maps were generated using ArcGIS Pro. 2.8[86].
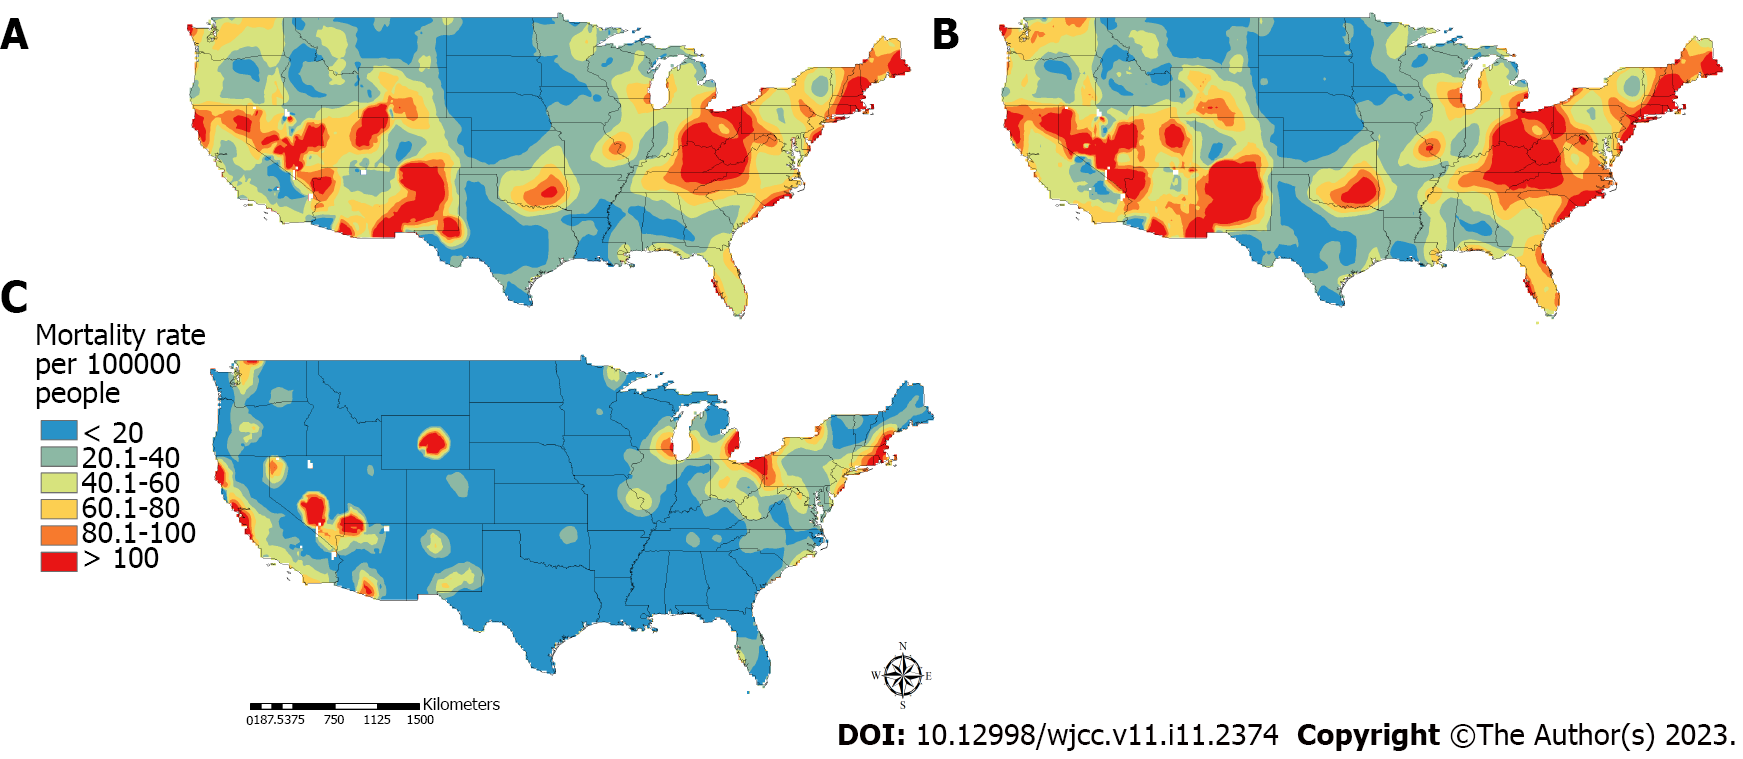
Figure 2 Spatial distribution of the substance use disorder related mortality.
A: The general population; B: White population; C: Black population in the contiguous United States. Maps were generated using ArcGIS Pro. 2.8[86].
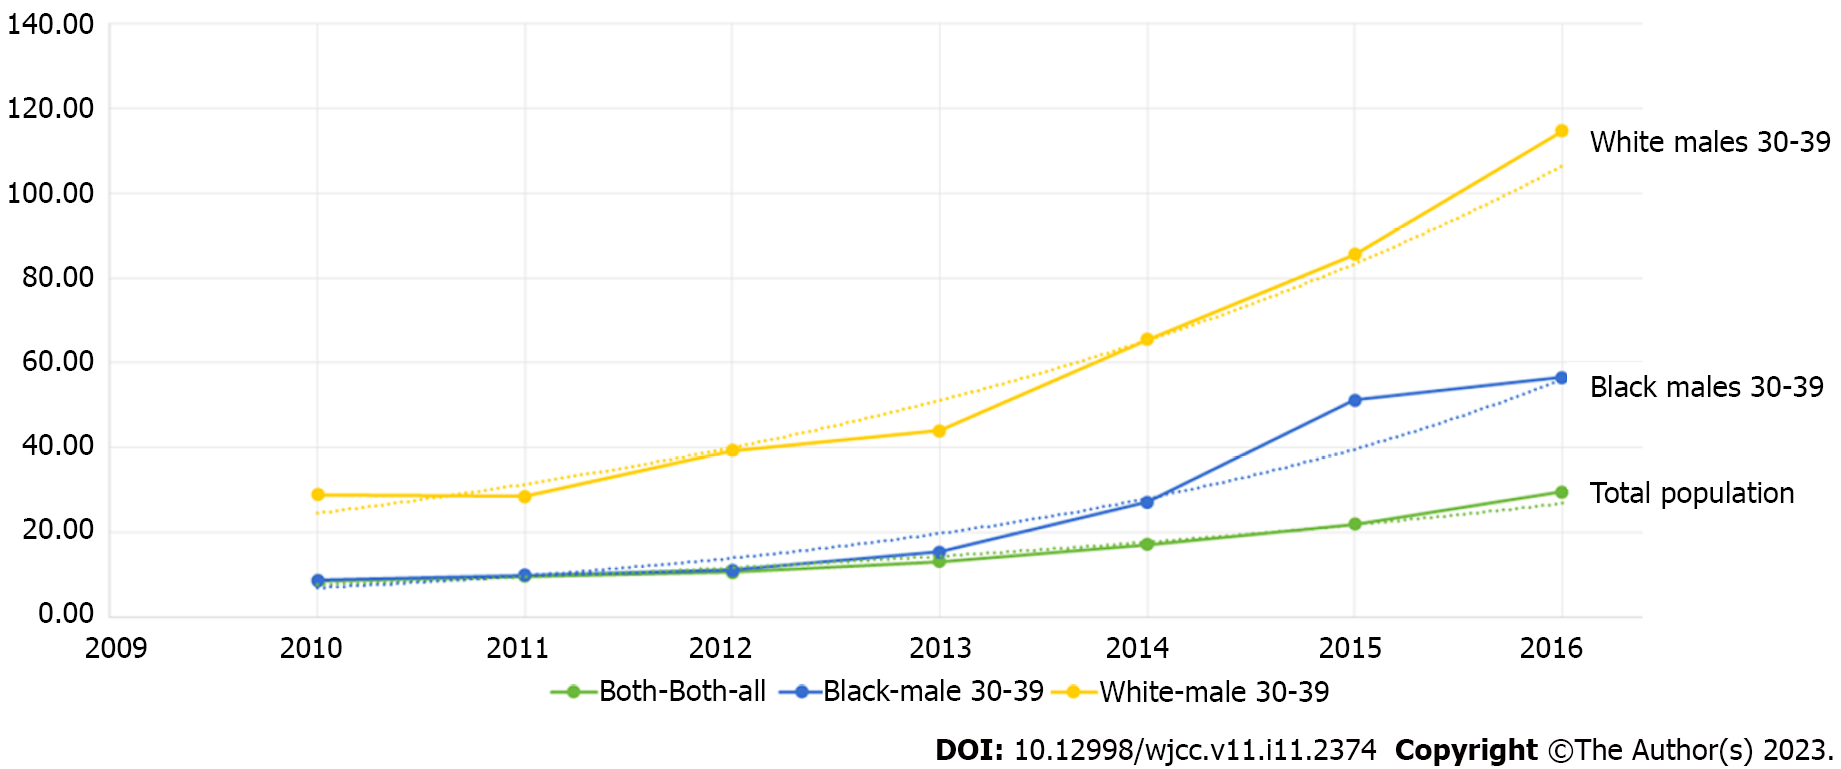
Figure 3 Temporal dynamics of the opioids overdose epidemic in Ohio (2010–2016) in the total population and in the most affected populations.
The highest prescription opioid overdose mortality rates were found in the White male population aged 30-39 years, with 125 deaths/100000 persons, followed by Black males of same age, with 57 deaths/100000 persons compared to the 29 deaths/100000 persons for the total population in 2016. Dashed lines illustrated the fitted exponential curve for each growth rate. Plot was created using the software environment R[87].
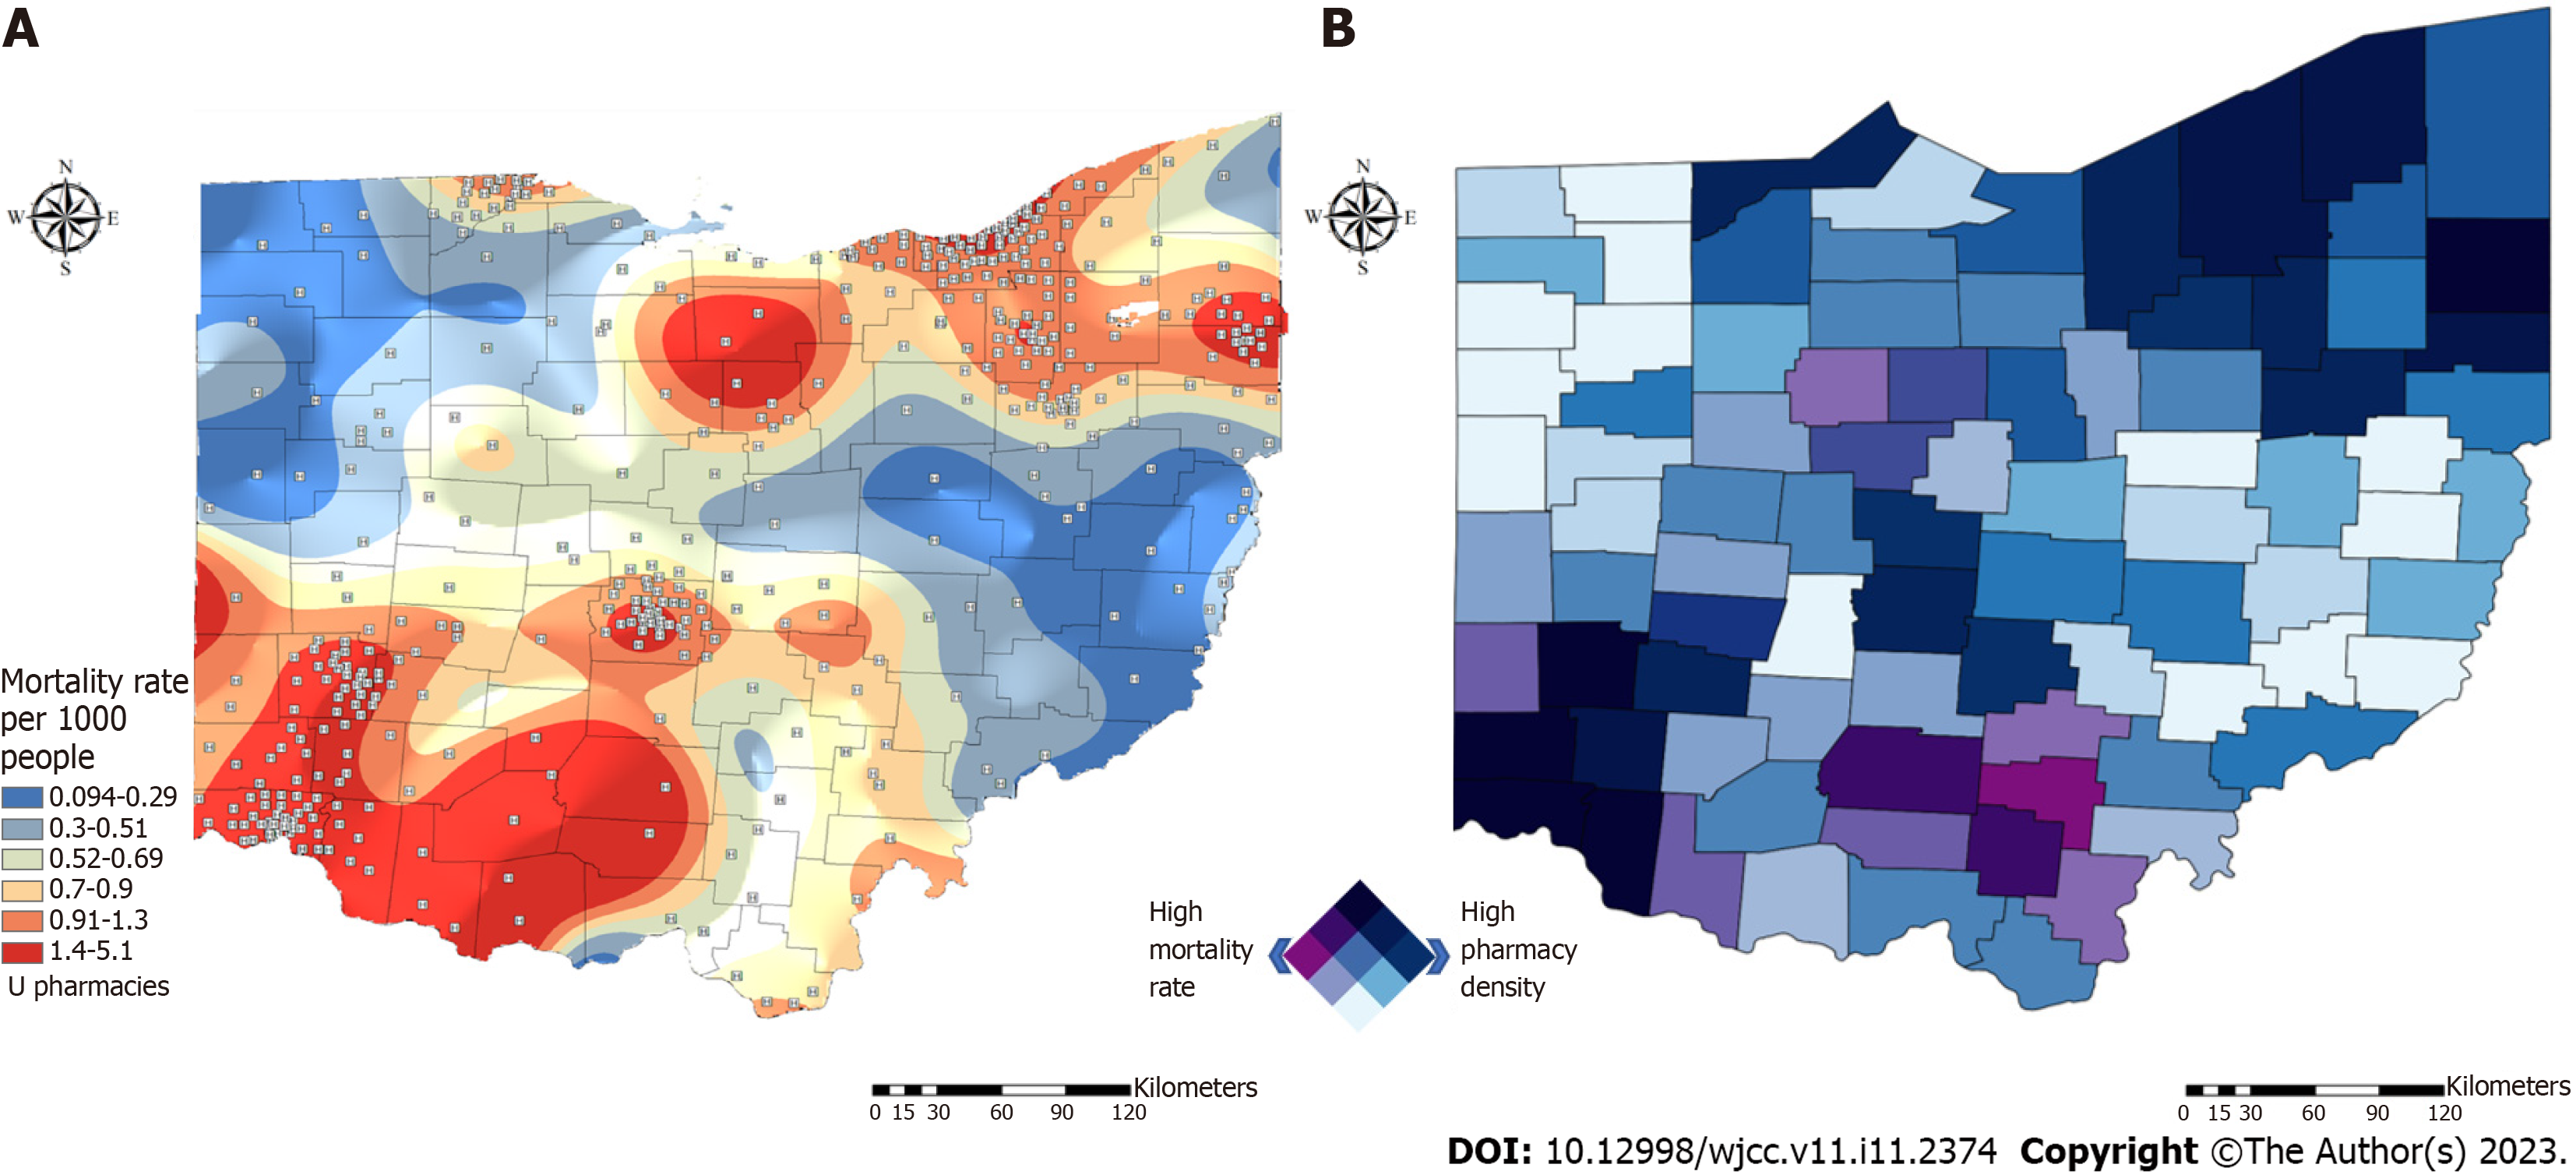
Figure 4 Spatial distribution of the opioid overdose epidemic in Ohio.
A: Spatial distribution of opioids overdose mortality rate in Ohio; B: Bivariate map illustrating counties with high opioid overdose mortality rate (purple) and high density of pharmacies (blue). Counties in dark color have both high opioids overdose mortality and density of pharmacies dispensing naloxone. Maps were generated using ArcGIS Pro. 2.8[86].
- Citation: Cuadros DF, Branscum AJ, Moreno CM, MacKinnon NJ. Narrative minireview of the spatial epidemiology of substance use disorder in the United States: Who is at risk and where? World J Clin Cases 2023; 11(11): 2374-2385
- URL: https://www.wjgnet.com/2307-8960/full/v11/i11/2374.htm
- DOI: https://dx.doi.org/10.12998/wjcc.v11.i11.2374


