Copyright
©The Author(s) 2023.
World J Clin Cases. Apr 6, 2023; 11(10): 2329-2335
Published online Apr 6, 2023. doi: 10.12998/wjcc.v11.i10.2329
Published online Apr 6, 2023. doi: 10.12998/wjcc.v11.i10.2329
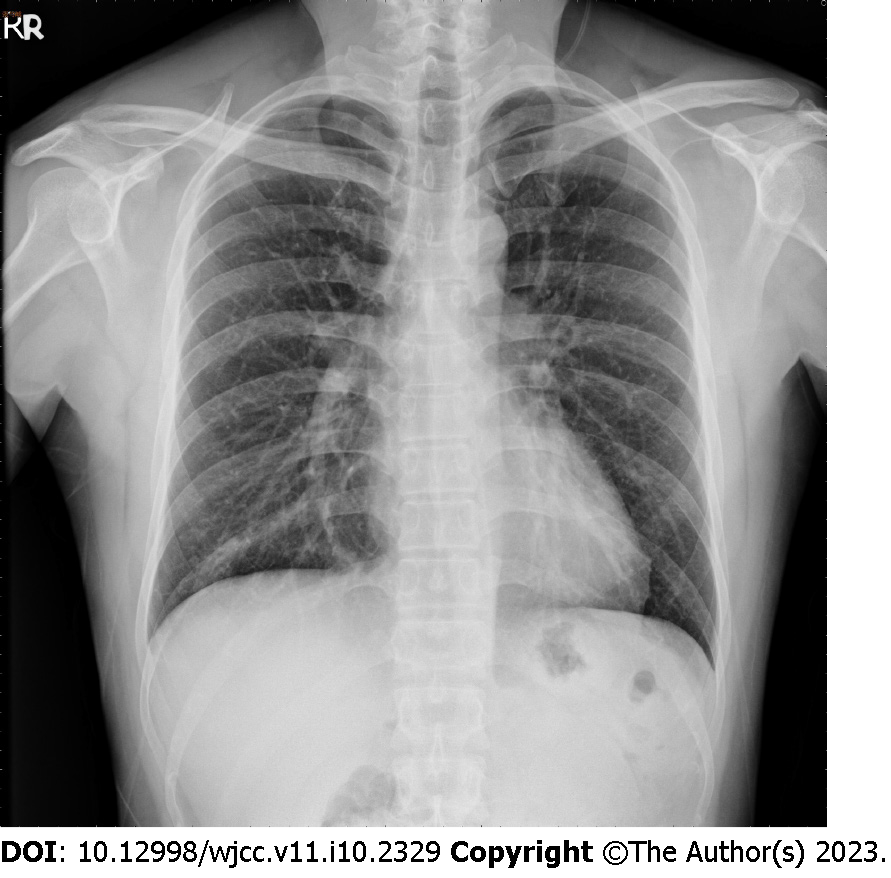
Figure 1 Chest radiograph obtained after the initial examination.
The image shows increased lung markings with peribronchial wall thickening in the bilateral lower lung fields.
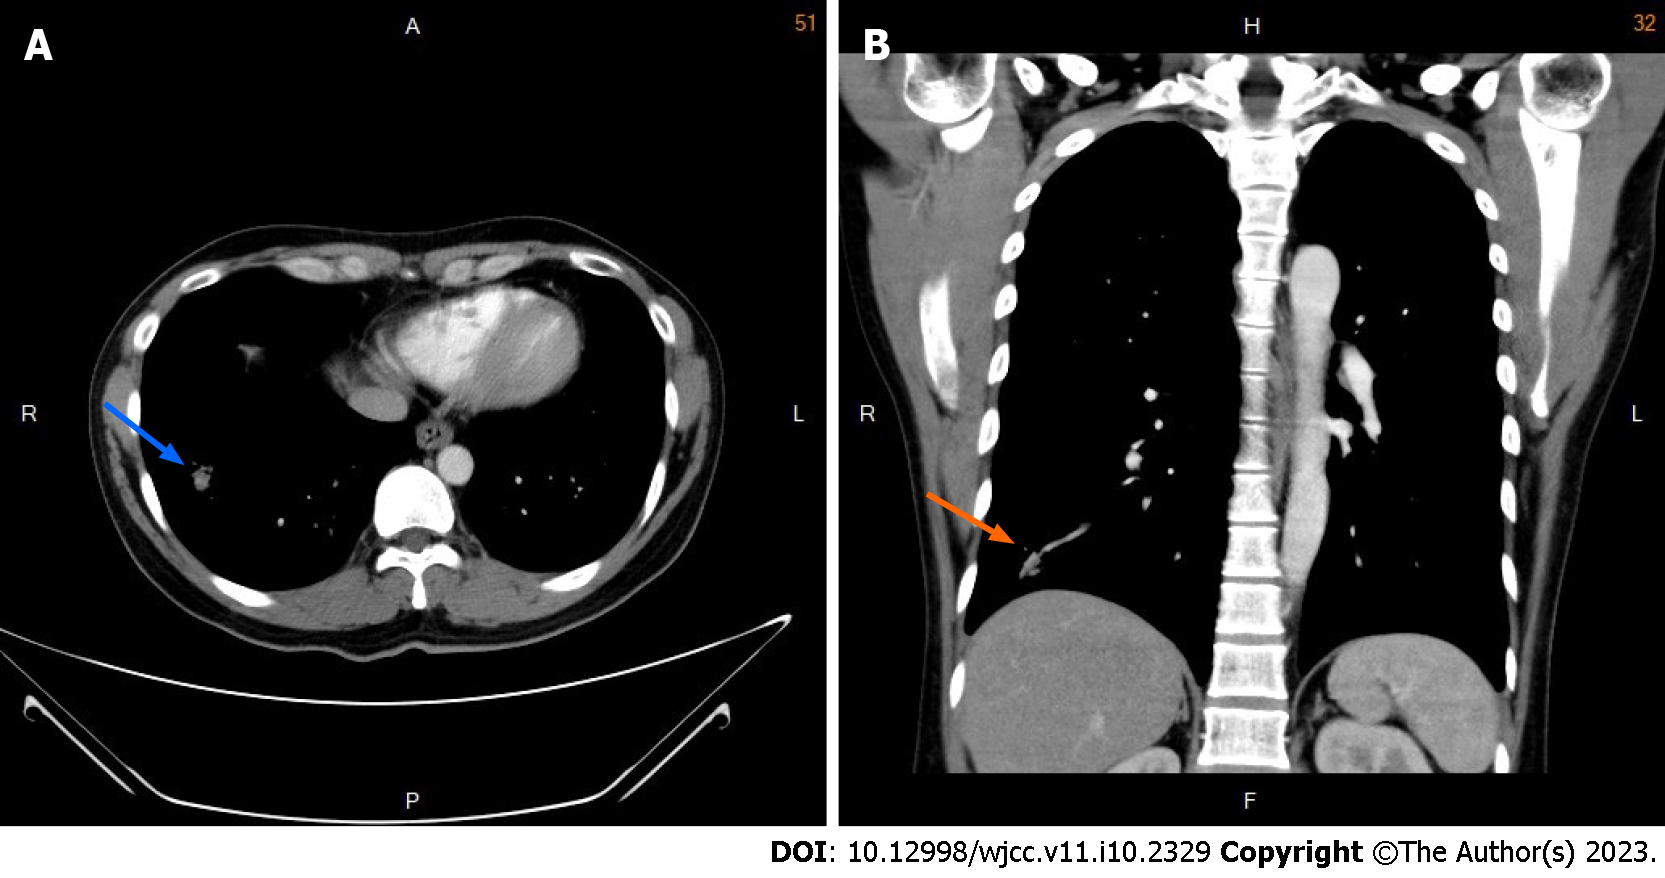
Figure 2 Chest computed tomography images obtained after the initial examination.
A: Axial and B: Coronal images obtained in a soft tissue setting showing a circumscribed calcified nodule measuring 3.5 mm in the right lower lung lobe (blue and orange arrows).
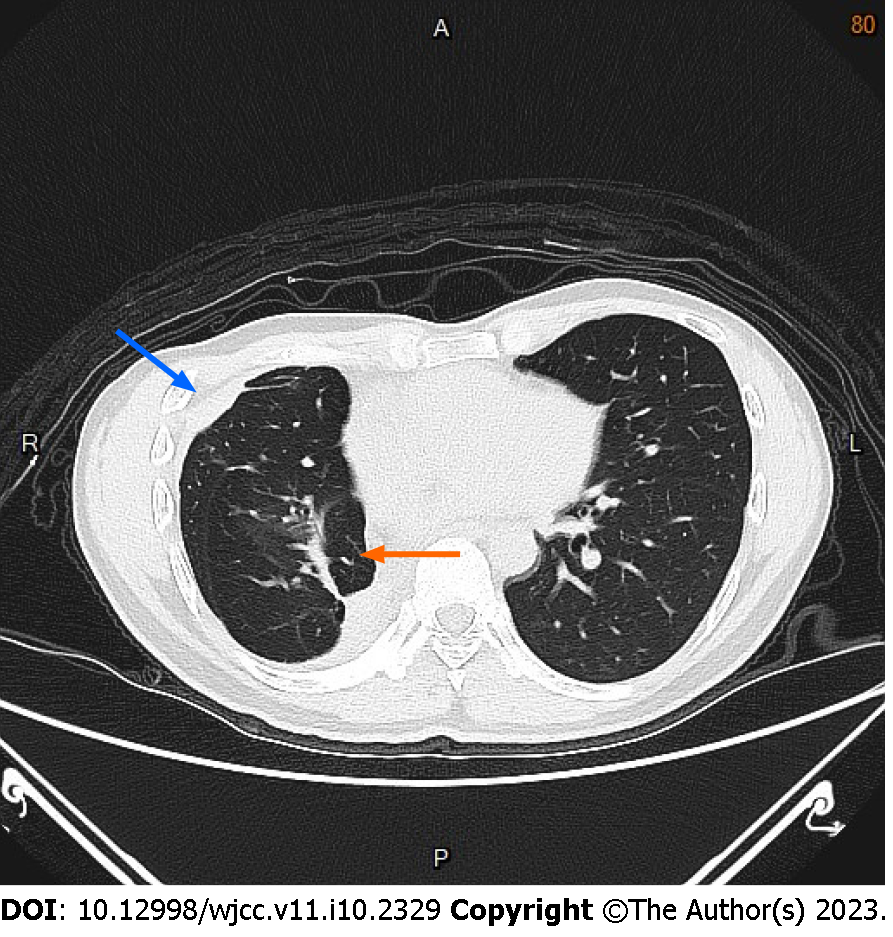
Figure 3 Follow-up chest computed tomography image obtained two years after the initial therapy.
Axial image showing thickening of the right pleura (blue arrow) and focal atelectasis (orange arrow) in the right middle lung lobe.
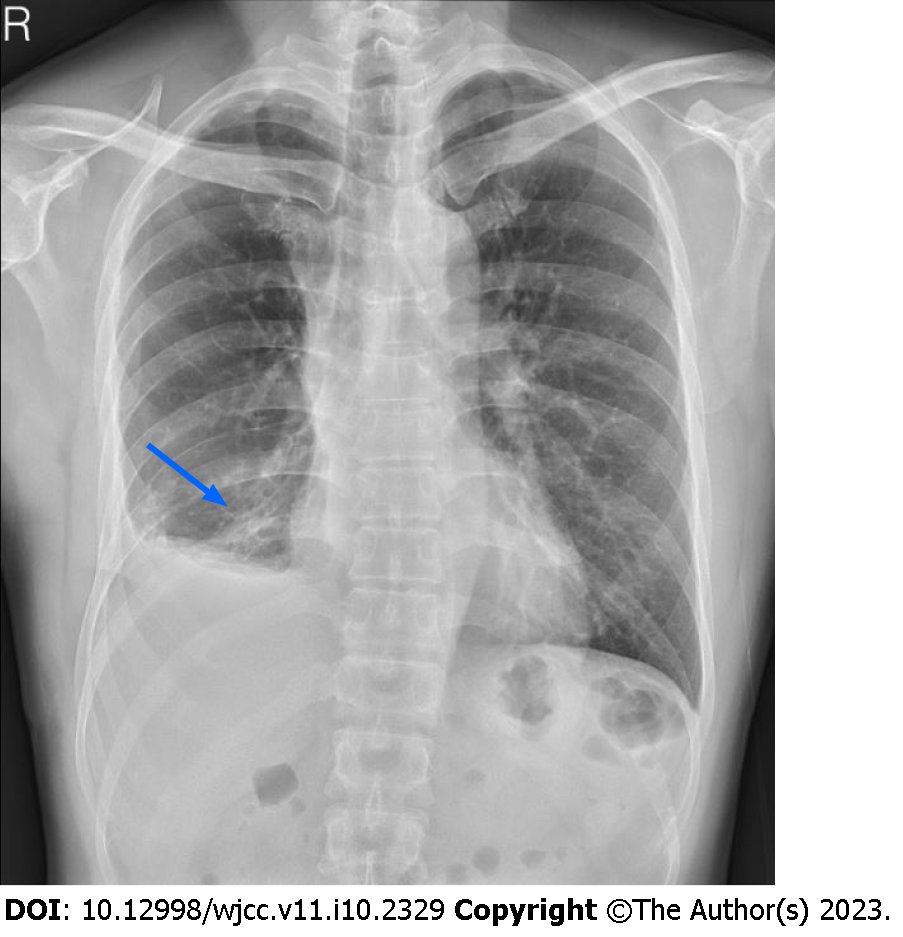
Figure 4 Follow-up chest radiograph obtained two years postoperatively.
The image shows calcified shadows over the right lower lung field (blue arrow).
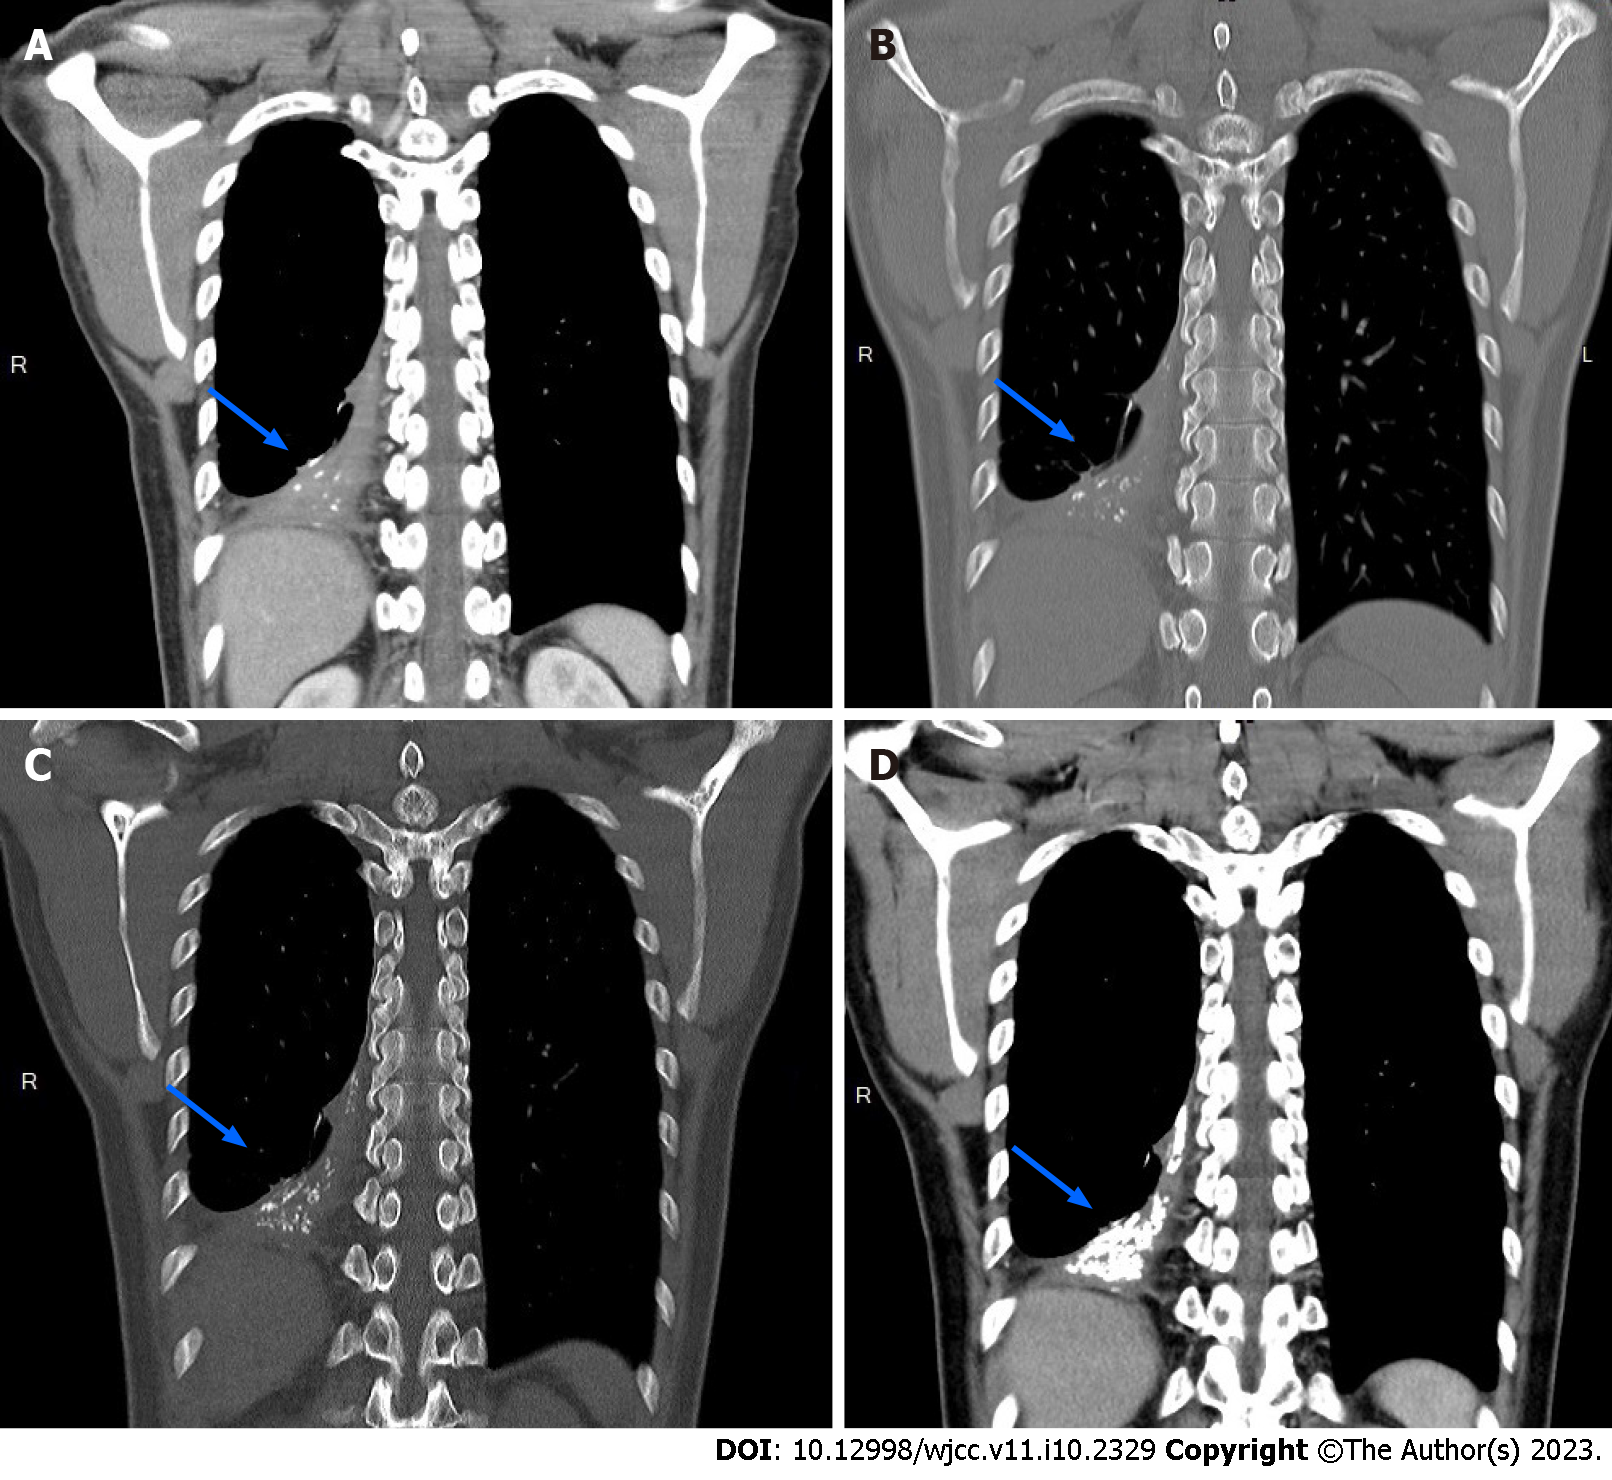
Figure 5 Serial computed tomography images obtained during a 5-year follow-up.
Coronal images showing gradual thickening of the right pleura near the lower posterior mediastinum and several sporadic calcified nodules (blue arrow) in the same region with increasing intensity over time, which eventually formed a large curve-shaped calcified thoracolith measuring approximately 9 cm in length. A: 5-year follow-up in 2017; B: 5-year follow-up in 2018; C: 5-year follow-up in 2019; D: 5-year follow-up in 2022.
- Citation: Hsu FC, Huang TW, Pu TW. Formation of a rare curve-shaped thoracolith documented on serial chest computed tomography images: A case report. World J Clin Cases 2023; 11(10): 2329-2335
- URL: https://www.wjgnet.com/2307-8960/full/v11/i10/2329.htm
- DOI: https://dx.doi.org/10.12998/wjcc.v11.i10.2329


