Copyright
©The Author(s) 2023.
World J Clin Cases. Apr 6, 2023; 11(10): 2260-2266
Published online Apr 6, 2023. doi: 10.12998/wjcc.v11.i10.2260
Published online Apr 6, 2023. doi: 10.12998/wjcc.v11.i10.2260
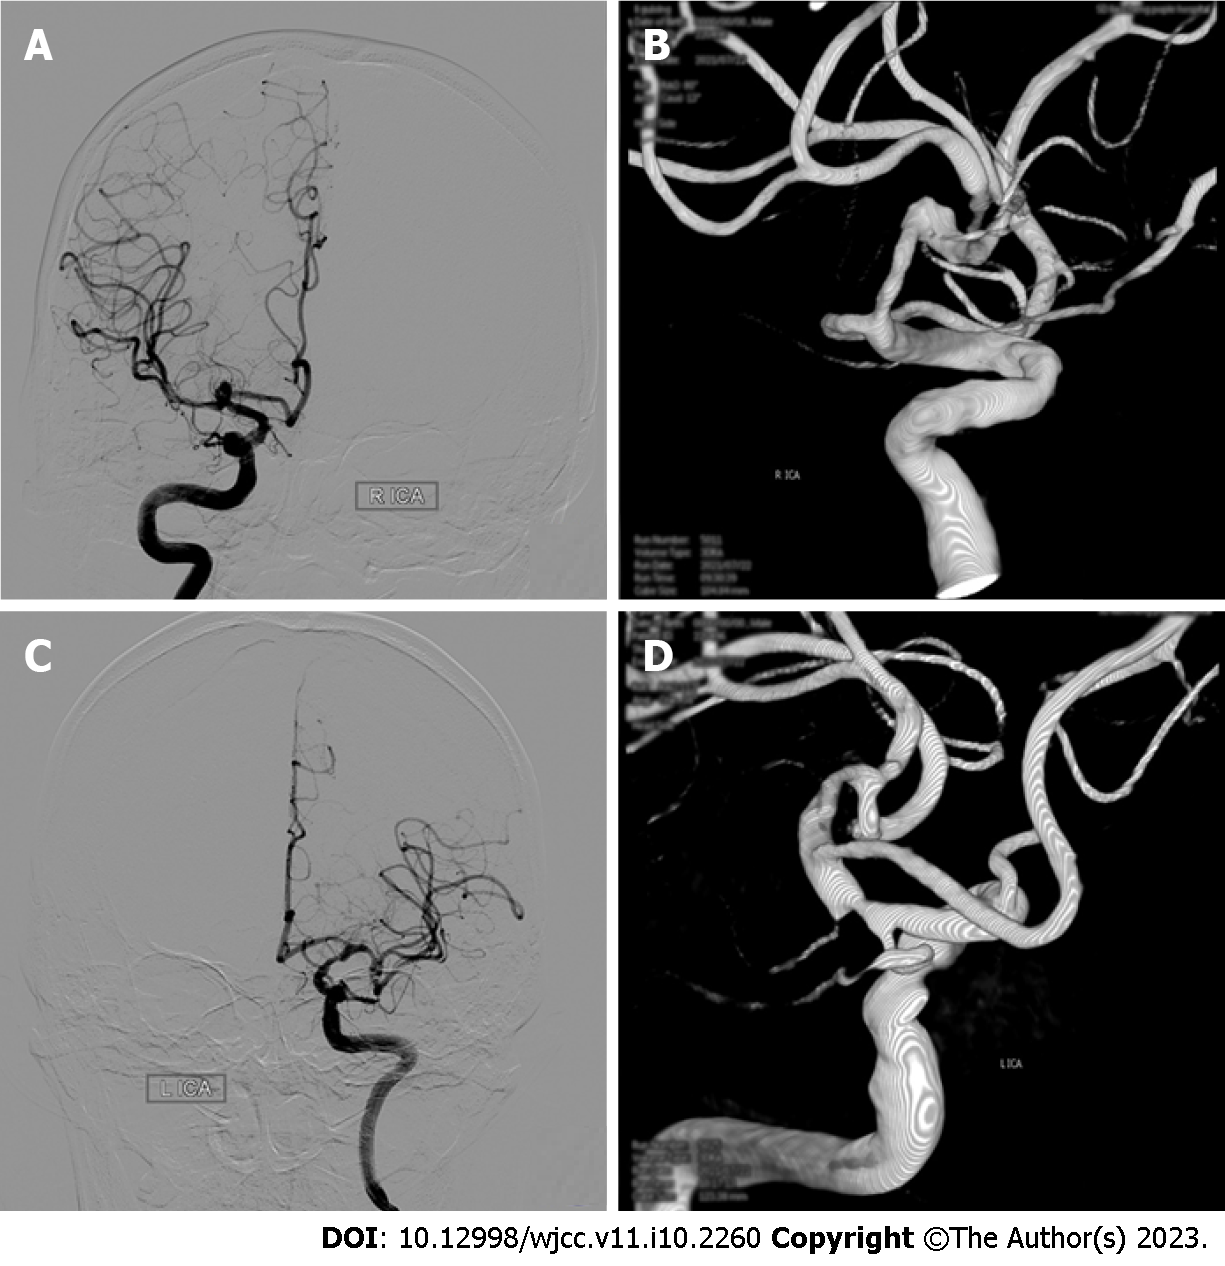
Figure 1 Angiography of the intracranial aneurysm.
A and B: The right middle cerebral artery aneurysm; C and D: Digital subtraction angiography showing the left internal carotid artery terminal aneurysm.
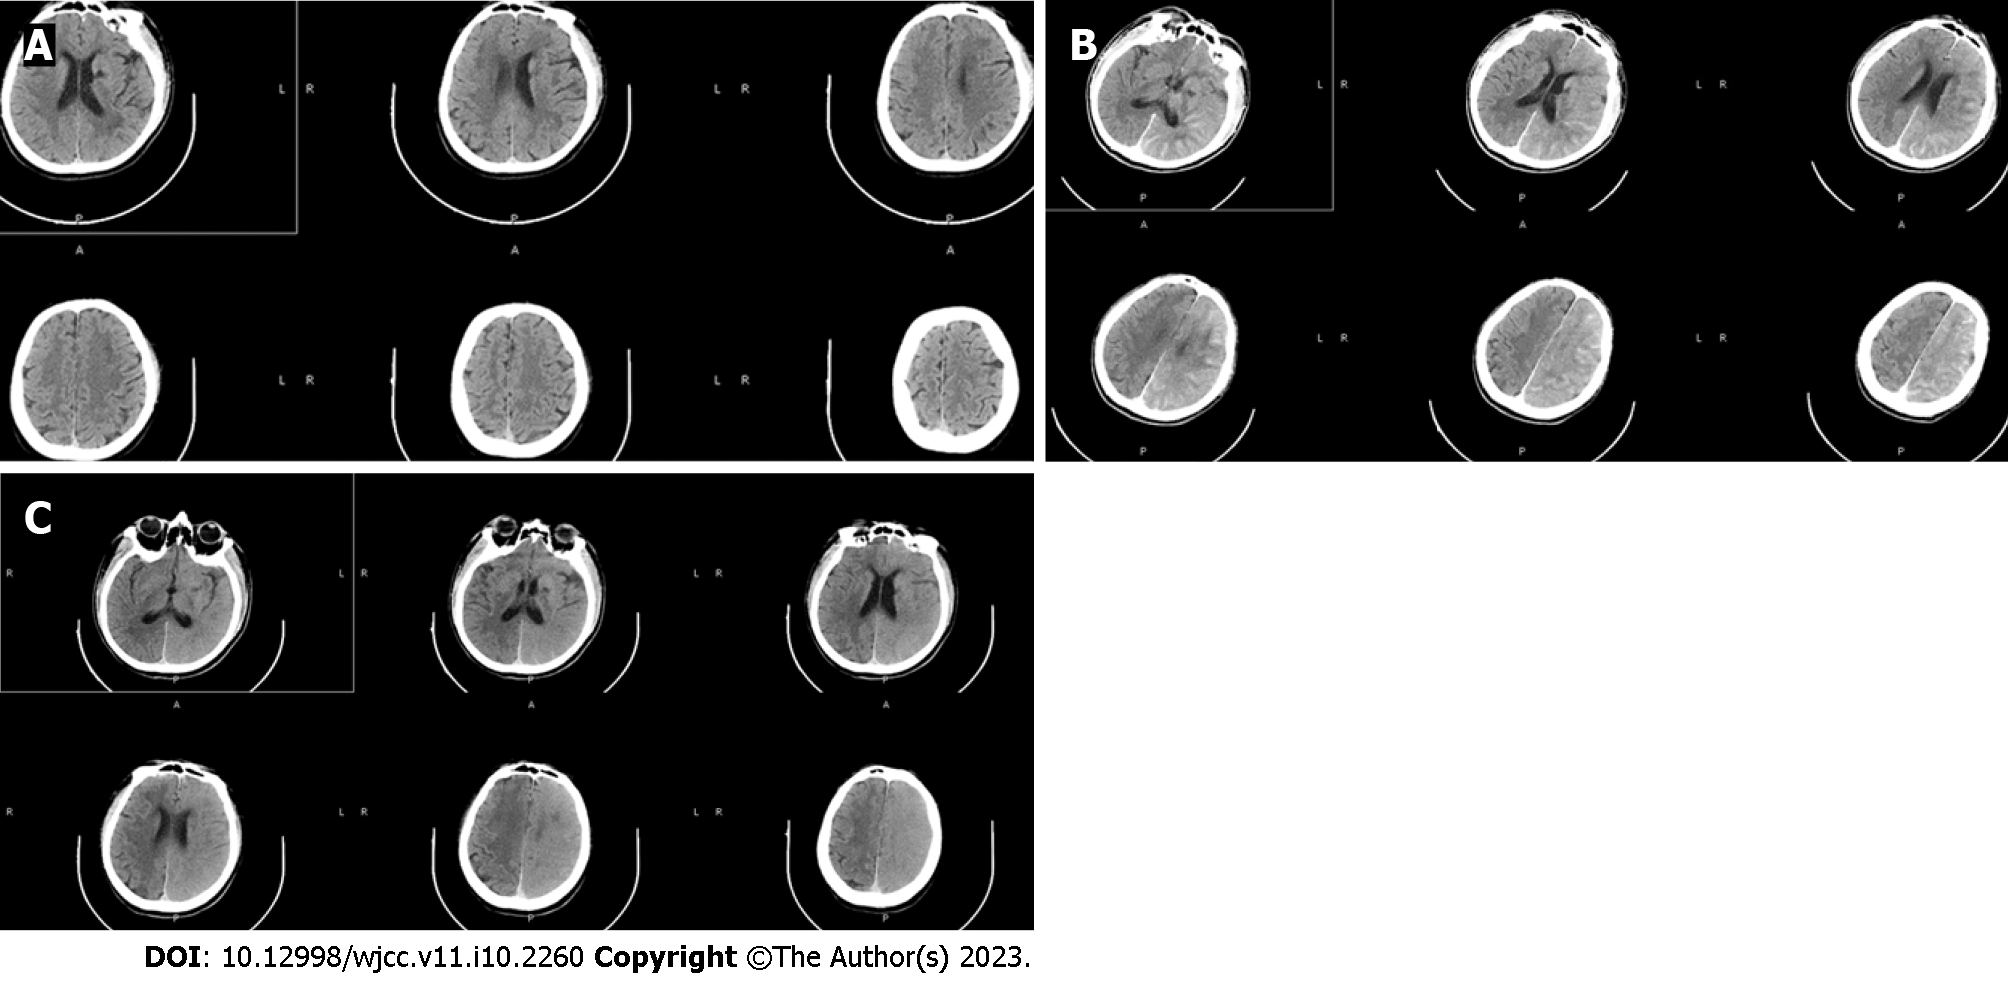
Figure 2 Computed tomography of the brain before and 2 h and 7 h after the procedure.
A: The normal occipital lobe of the left cerebral hemisphere on the preprocedure computed Tomography (CT); B: The increased density of the interhemispheric cistern, left fissure cistern and part of the left sulcus on CT 2 h after digital subtraction angiography (DSA); C: Seven hours after DSA, indicating the swelling of the left frontal, temporal, parietal and occipital lobe brain tissue, the disappearance of the high-density shadow of sulci and gyri, the shallow appearance of the sulci and gyri, and the higher density of the left cerebral hemisphere than the right cerebral hemisphere.
Figure 3 Computed tomography 3 d after digital subtraction angiography and magnetic resonance imaging 17 d after digital subtraction angiography.
A: The brain computed tomography (CT) 3 d after digital subtraction angiography (DSA), which showed that brain tissue swelling in the left cerebral hemisphere was significantly reduced, and there was no significant difference in the density of bilateral cerebral hemispheres; B-E: Brain magnetic resonance imaging re-examination 17 d after DSA. The signals of T1, T2, and diffusion-weighted imaging in bilateral brain tissues were symmetrical without significant differences.
- Citation: Zhang ZY, Lv H, Wang PJ, Zhao DY, Zhang LY, Wang JY, Hao JH. Unilateral contrast-induced encephalopathy with contrast medium exudation: A case report. World J Clin Cases 2023; 11(10): 2260-2266
- URL: https://www.wjgnet.com/2307-8960/full/v11/i10/2260.htm
- DOI: https://dx.doi.org/10.12998/wjcc.v11.i10.2260


