Copyright
©The Author(s) 2022.
World J Clin Cases. Mar 26, 2022; 10(9): 2710-2720
Published online Mar 26, 2022. doi: 10.12998/wjcc.v10.i9.2710
Published online Mar 26, 2022. doi: 10.12998/wjcc.v10.i9.2710
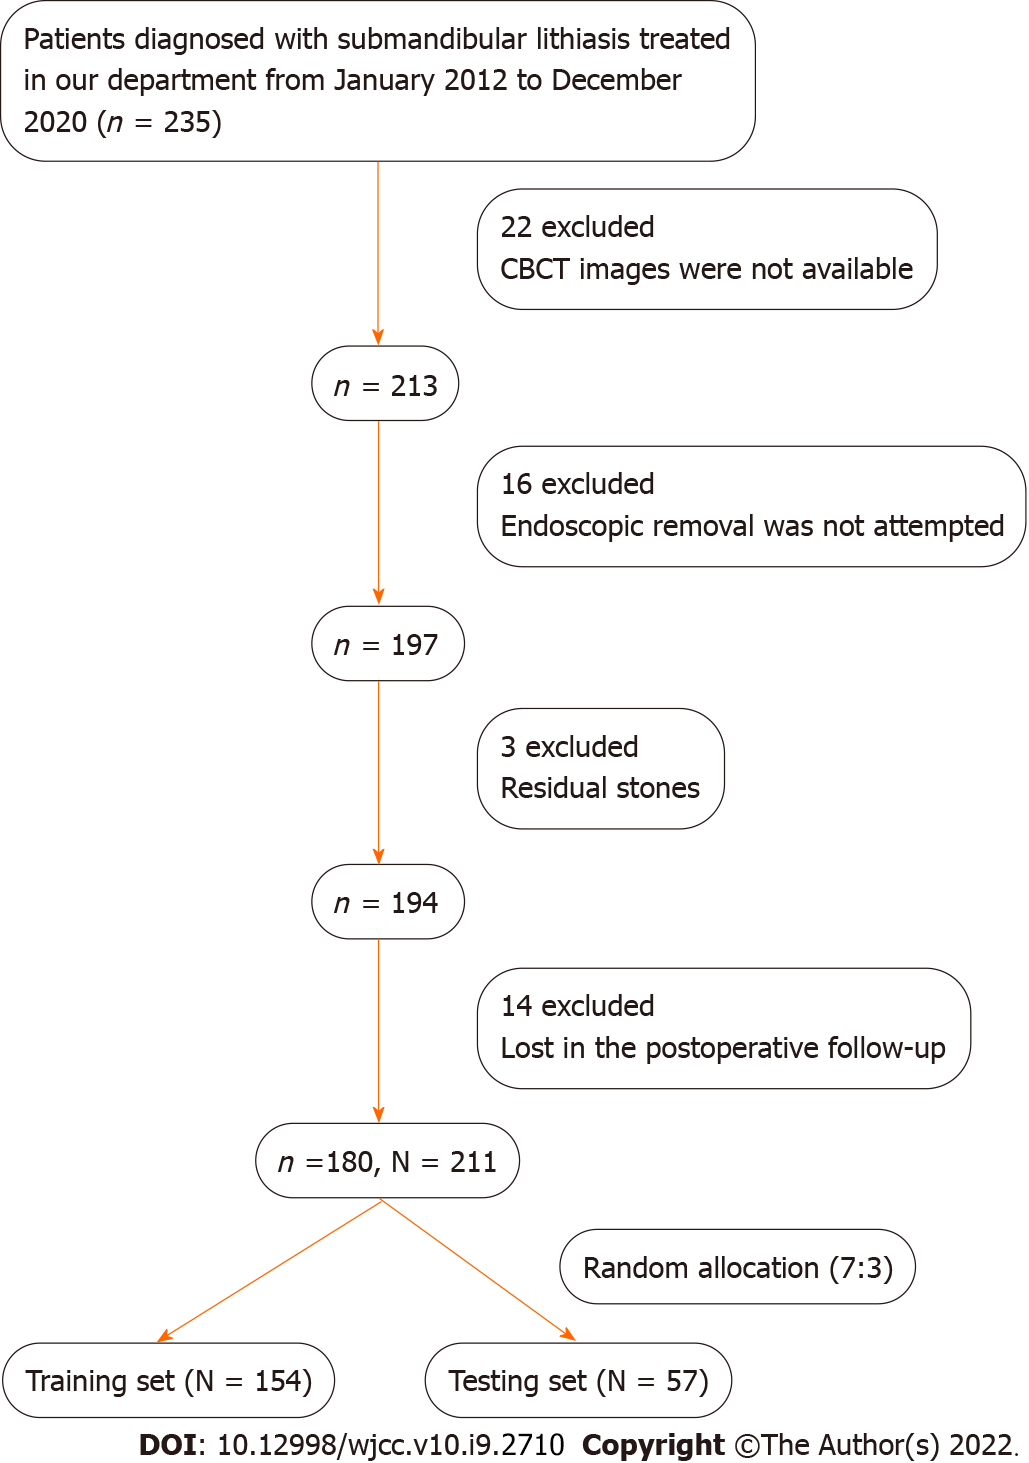
Figure 1 Study flowchart.
A total of 180 patients with 211 submandibular stones were finally enrolled in this study and then randomly separated into training and testing sets at a ratio of 7:3. N: Number of stones; n: Number of patients; CBCT: Cone beam computed tomography.
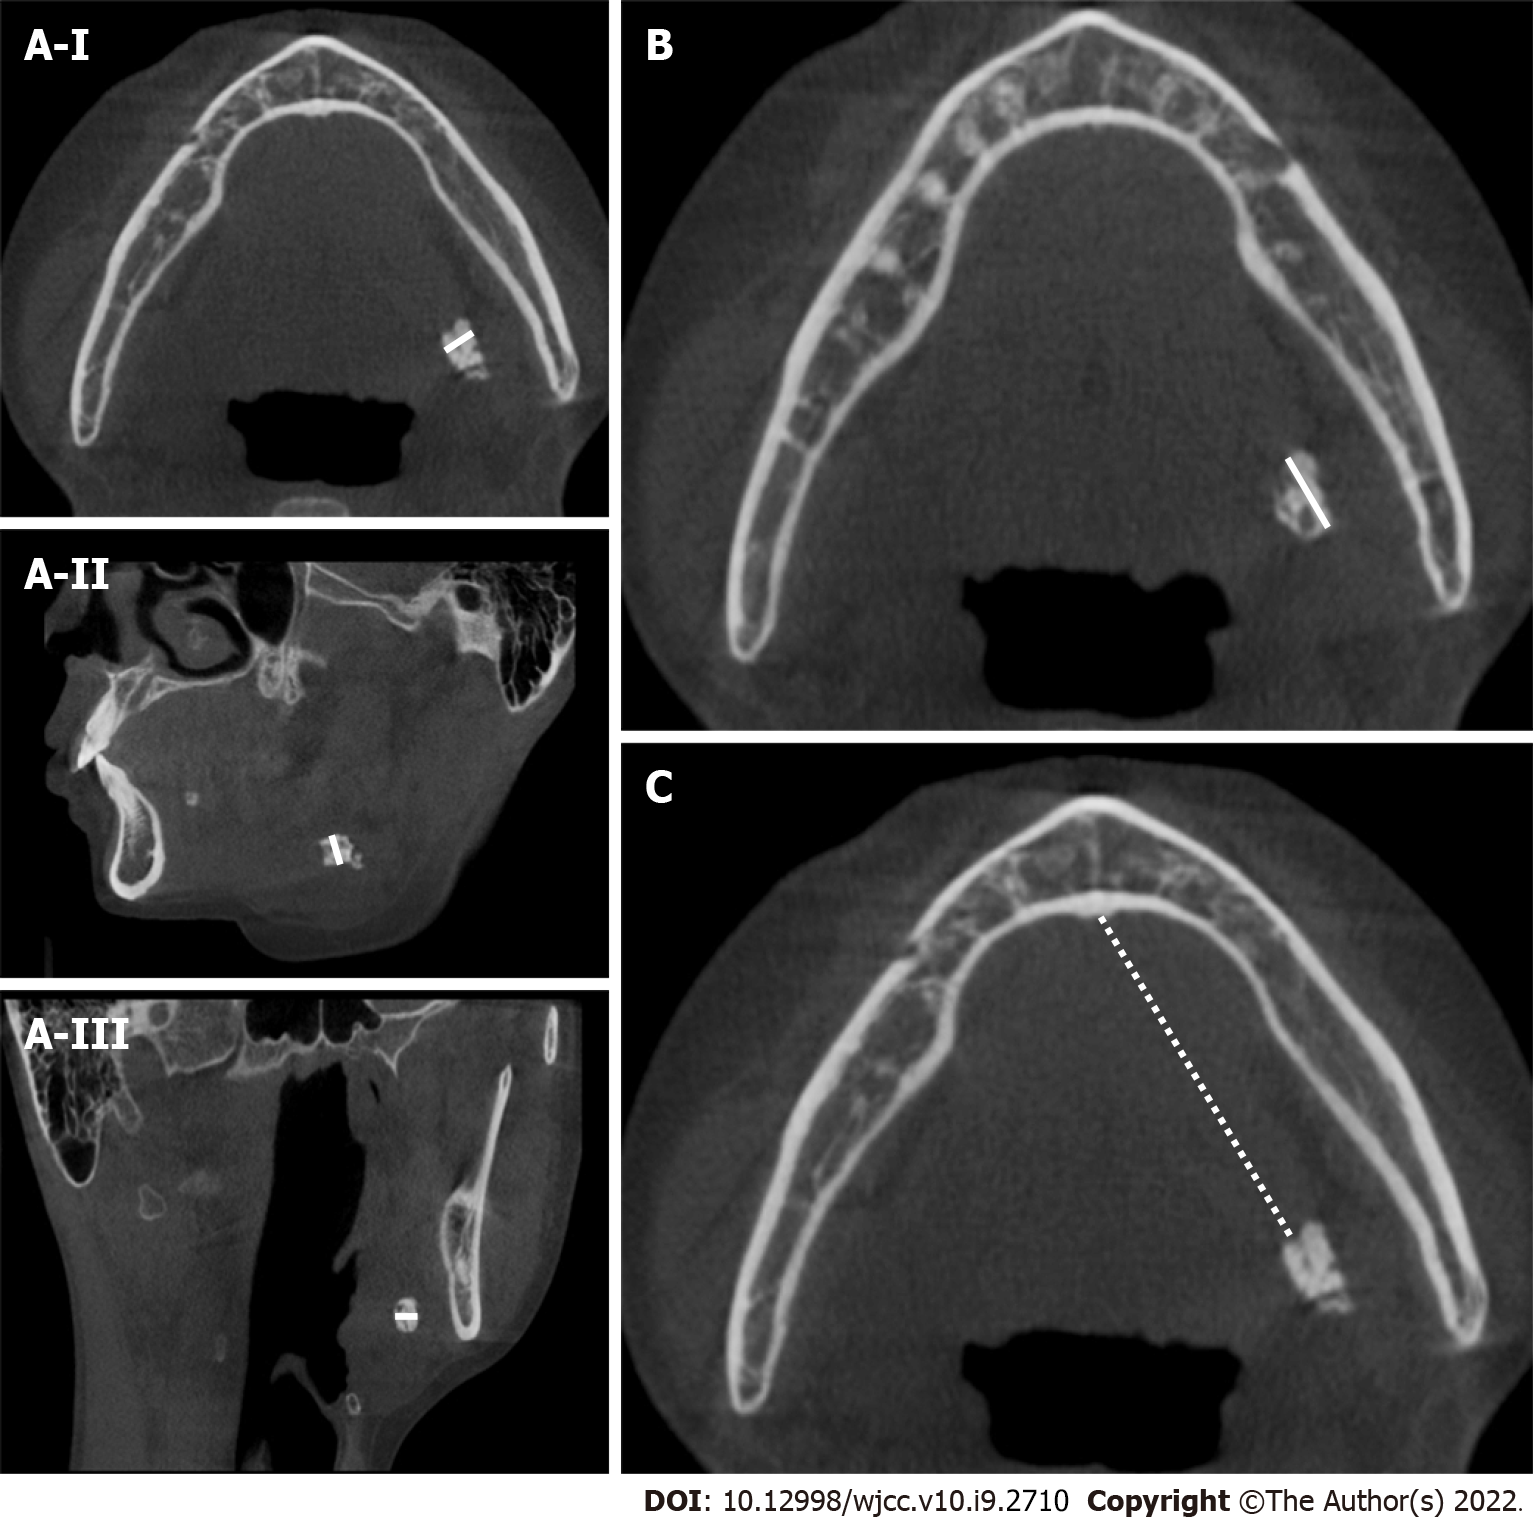
Figure 2 Measurements of the location, transverse diameter and longitudinal diameter of submandibular stones.
A-I: Measures the width of stones in the axial cone beam computed tomography (CBCT) views (white line); A-II: Measures the width of stones in the sagittal CBCT views (white line); A-III: Measures the width of stones in the coronal CBCT views (white line); B: Measures the longitudinal diameter of stones in the axial CBCT views (white line); C: Measures the distance between the anterior edge of the stone and the midpoint of the glossal cortex of the mandible in the axial CBCT views, which was defined as the location of the stone (white dotted line).
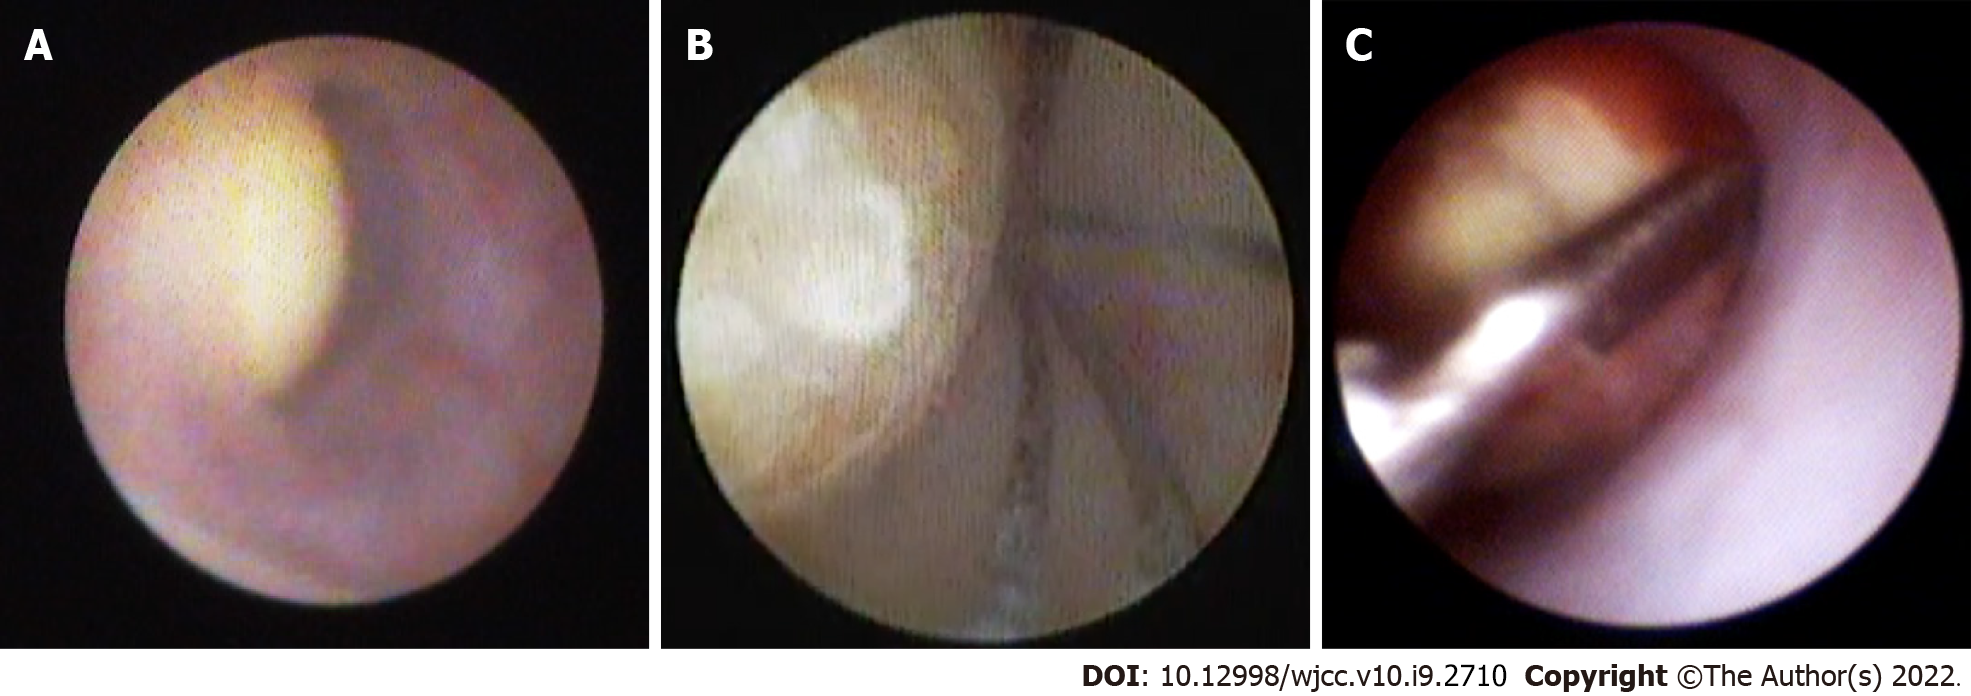
Figure 3 Endoscopic removal of submandibular stones.
A: It was captured while locating the stones under an endoscope; B: It was captured while attempting to grasp the stone with a stone basket; C: It was captured while attempting to grasp the stone with forceps.
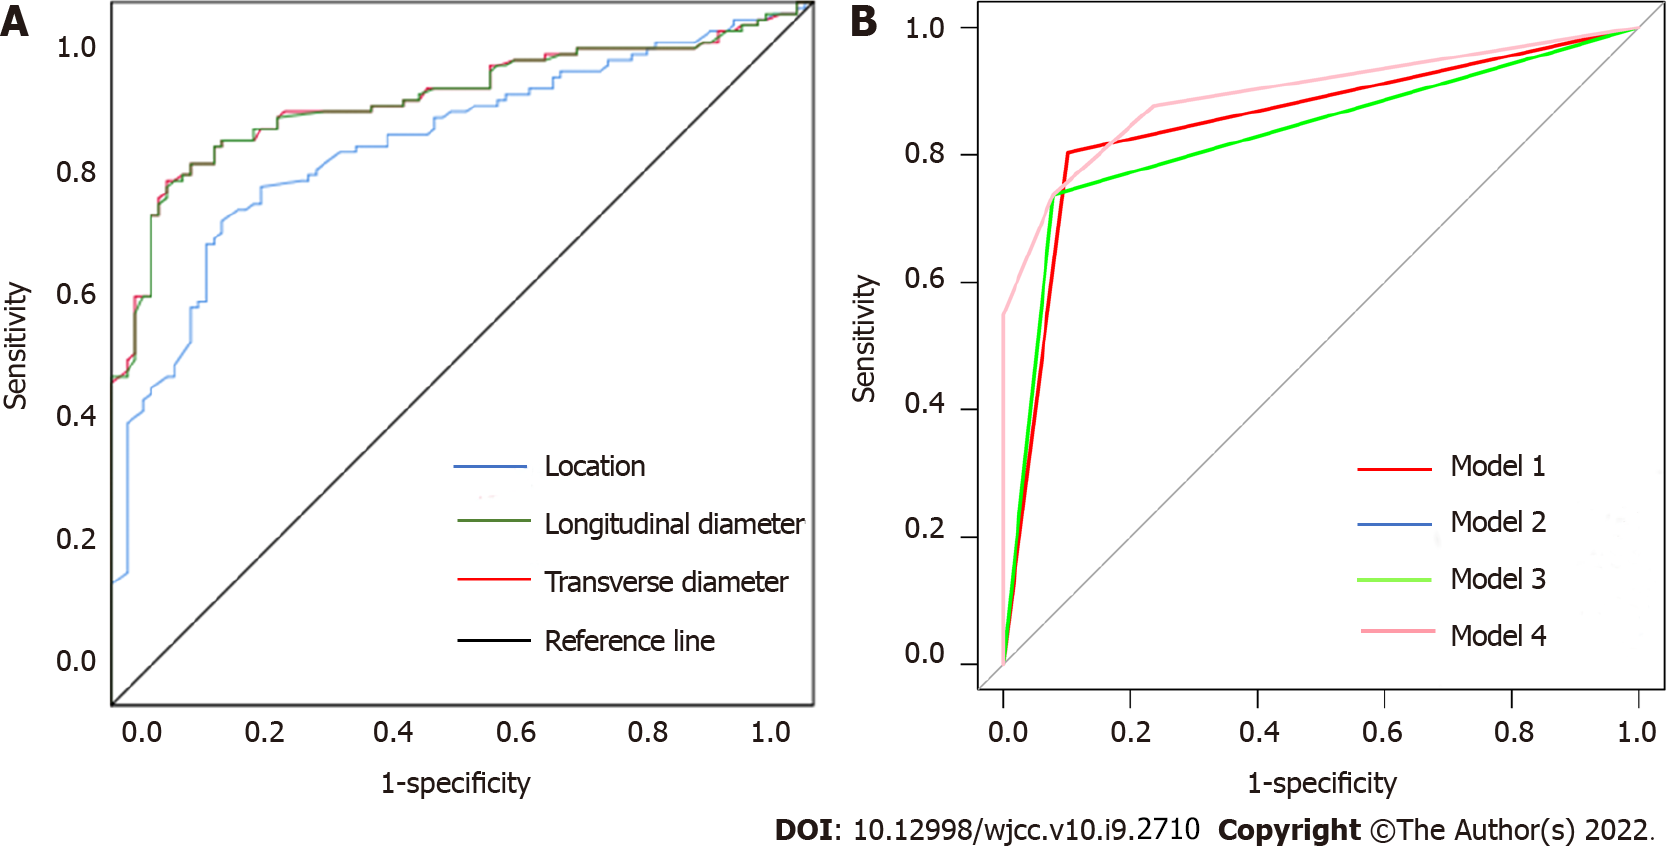
Figure 4 Receiver operating characteristic curve analysis.
A: To determine the optimal cutoff points for the location, transverse diameter (TD) and longitudinal diameter (LD) of the stones; B: To compare the predictive performance of the univariate and multivariate combined models. In B, the univariate model of TD, LD and location correspond to models 1, 2 and 3, respectively. Model 2 and model 3 are so close that it is difficult to distinguish them graphically. The multivariate combined model corresponds to model 4.
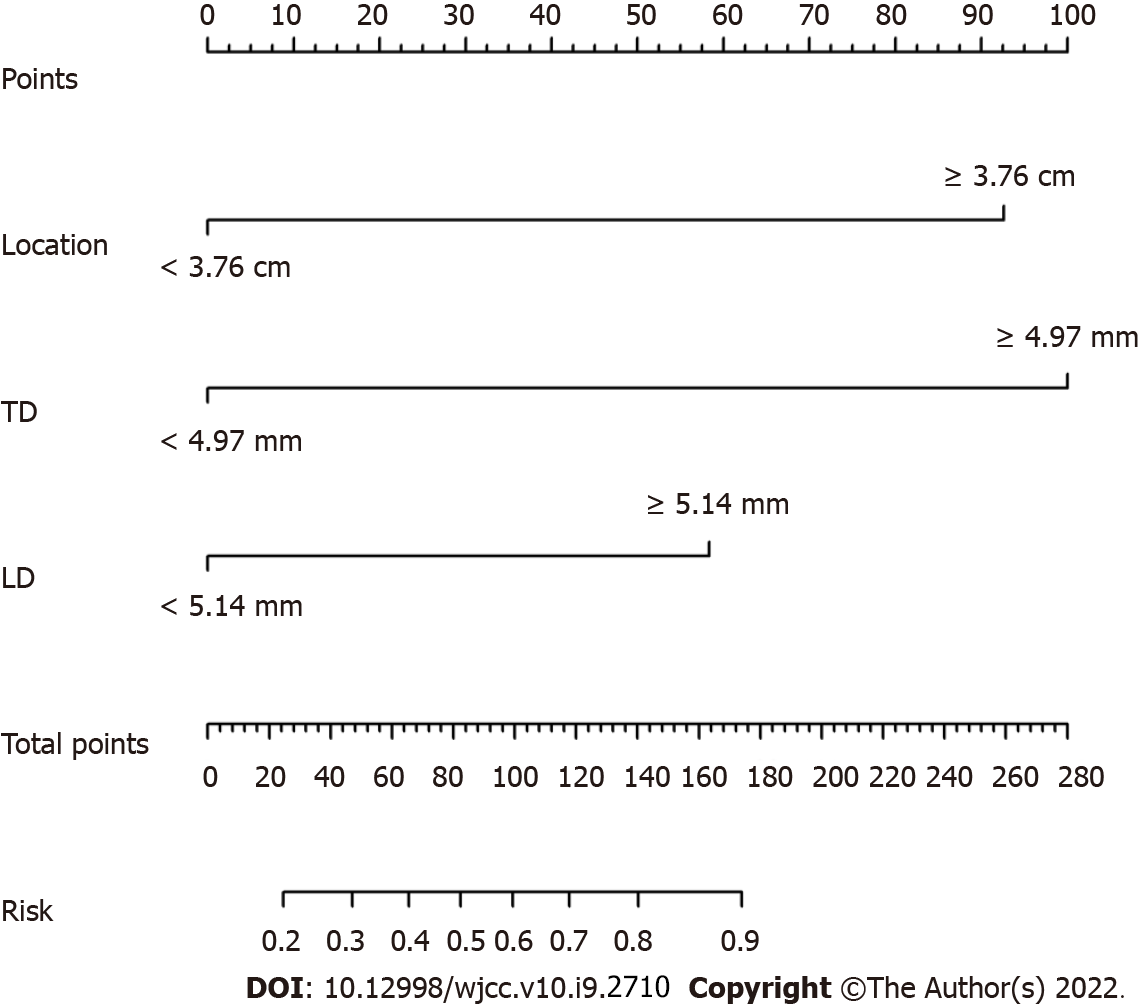
Figure 5 Predictive nomogram for the risk of endoscopic removal failure.
Each factor was given a point, and the total points for an individual stone could be obtained by summing all points. The predictive risk of endoscopic removal failure was identified by the total points according to the scale at the bottom. TD: Transverse diameter; LD: Longitudinal diameter.
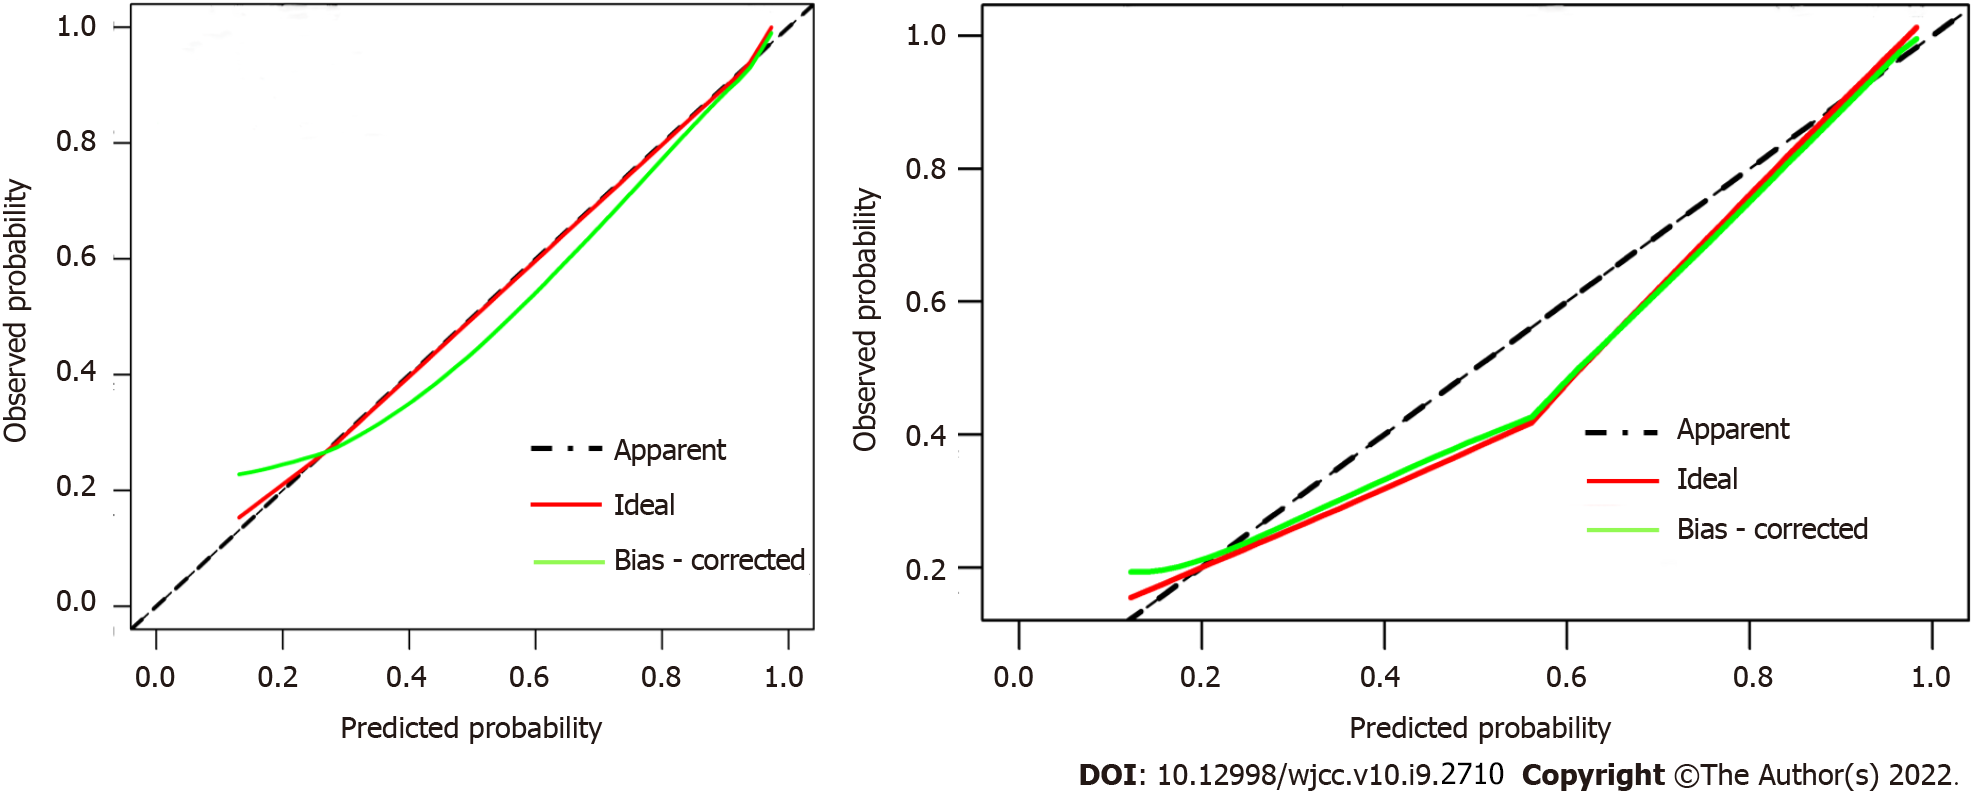
Figure 6 Calibration curves of the nomogram in both sets.
They showed good agreement between the predicted (X-axis) and observed (Y-axis) probabilities. The dotted line represents the apparent match.
- Citation: Huang Y, Liang PS, Yang YC, Cai WX, Tao Q. Nomogram to predict the risk of endoscopic removal failure with forceps/baskets for treating submandibular stones. World J Clin Cases 2022; 10(9): 2710-2720
- URL: https://www.wjgnet.com/2307-8960/full/v10/i9/2710.htm
- DOI: https://dx.doi.org/10.12998/wjcc.v10.i9.2710


