Copyright
©The Author(s) 2022.
World J Clin Cases. Mar 16, 2022; 10(8): 2616-2621
Published online Mar 16, 2022. doi: 10.12998/wjcc.v10.i8.2616
Published online Mar 16, 2022. doi: 10.12998/wjcc.v10.i8.2616
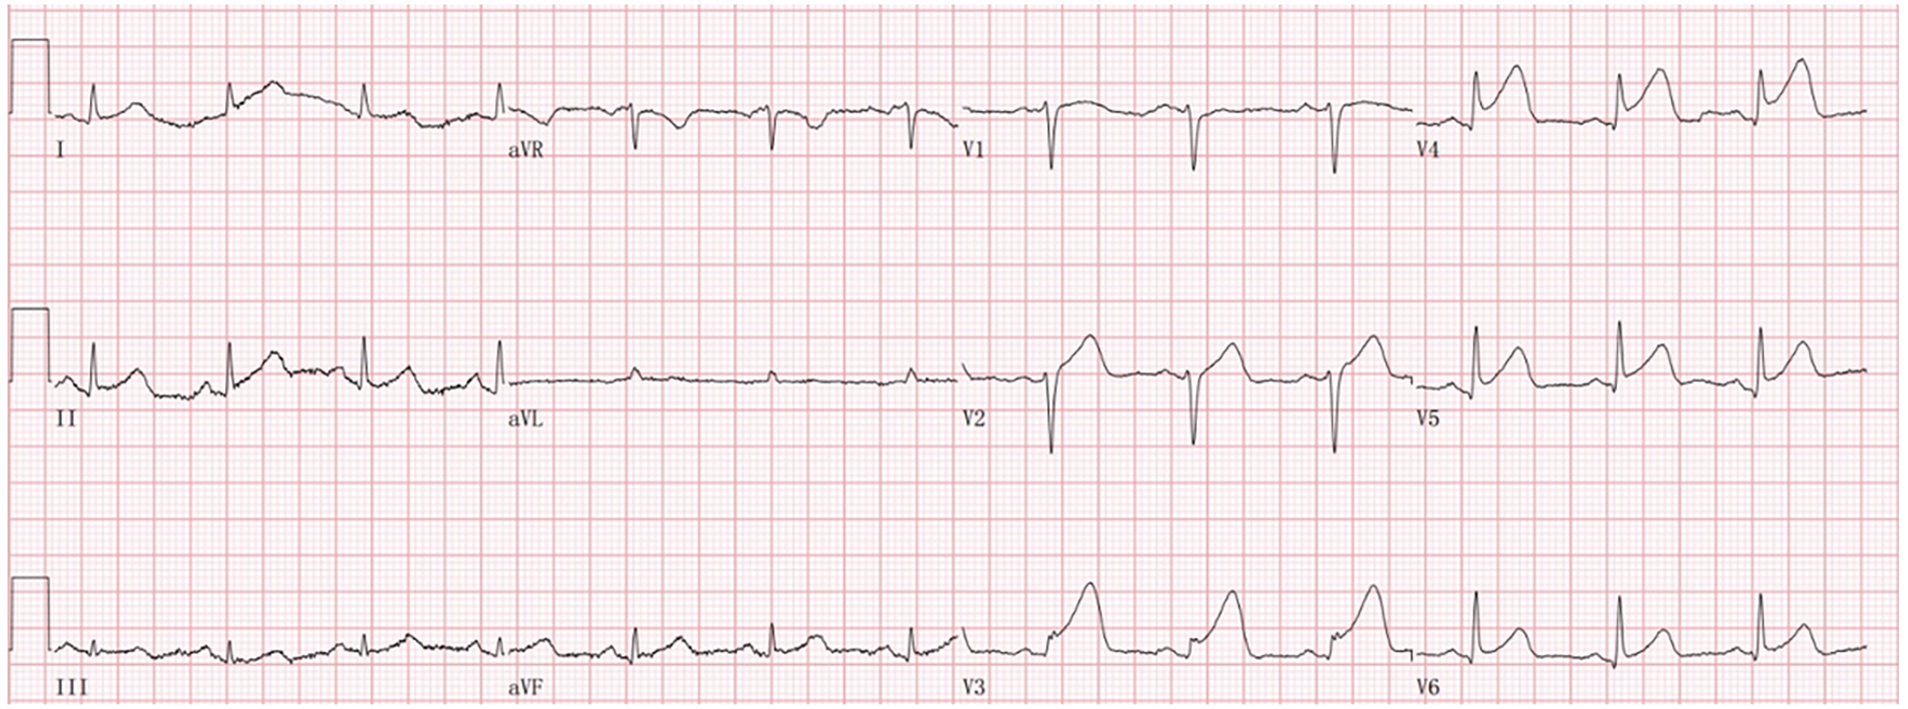
Figure 1 Prehospital electrocardiogram showing an upslope elevation of 0.
05–0.15 mV in the ST segment of the V3–V5 lead with a towering and upright T wave.
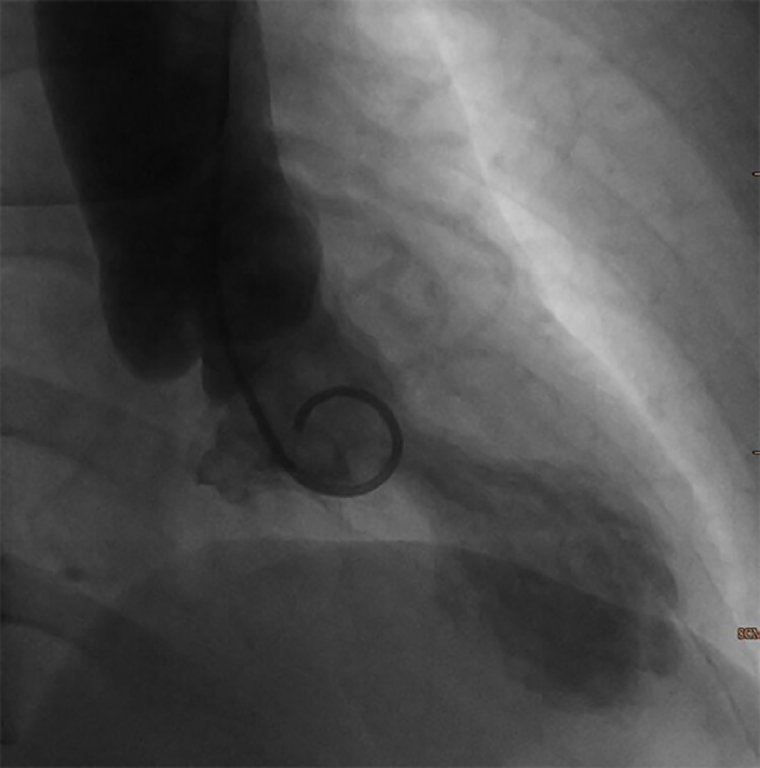
Figure 2 Left ventricular angiography showing weakened contractions of the left ventricular apex.
The systolic apex is bulbous, showing typical “octopus-trap”-like changes.
- Citation: Meng LP, Zhang P. Takotsubo cardiomyopathy misdiagnosed as acute myocardial infarction under the Chest Pain Center model: A case report. World J Clin Cases 2022; 10(8): 2616-2621
- URL: https://www.wjgnet.com/2307-8960/full/v10/i8/2616.htm
- DOI: https://dx.doi.org/10.12998/wjcc.v10.i8.2616


