Copyright
©The Author(s) 2022.
World J Clin Cases. Mar 16, 2022; 10(8): 2393-2403
Published online Mar 16, 2022. doi: 10.12998/wjcc.v10.i8.2393
Published online Mar 16, 2022. doi: 10.12998/wjcc.v10.i8.2393
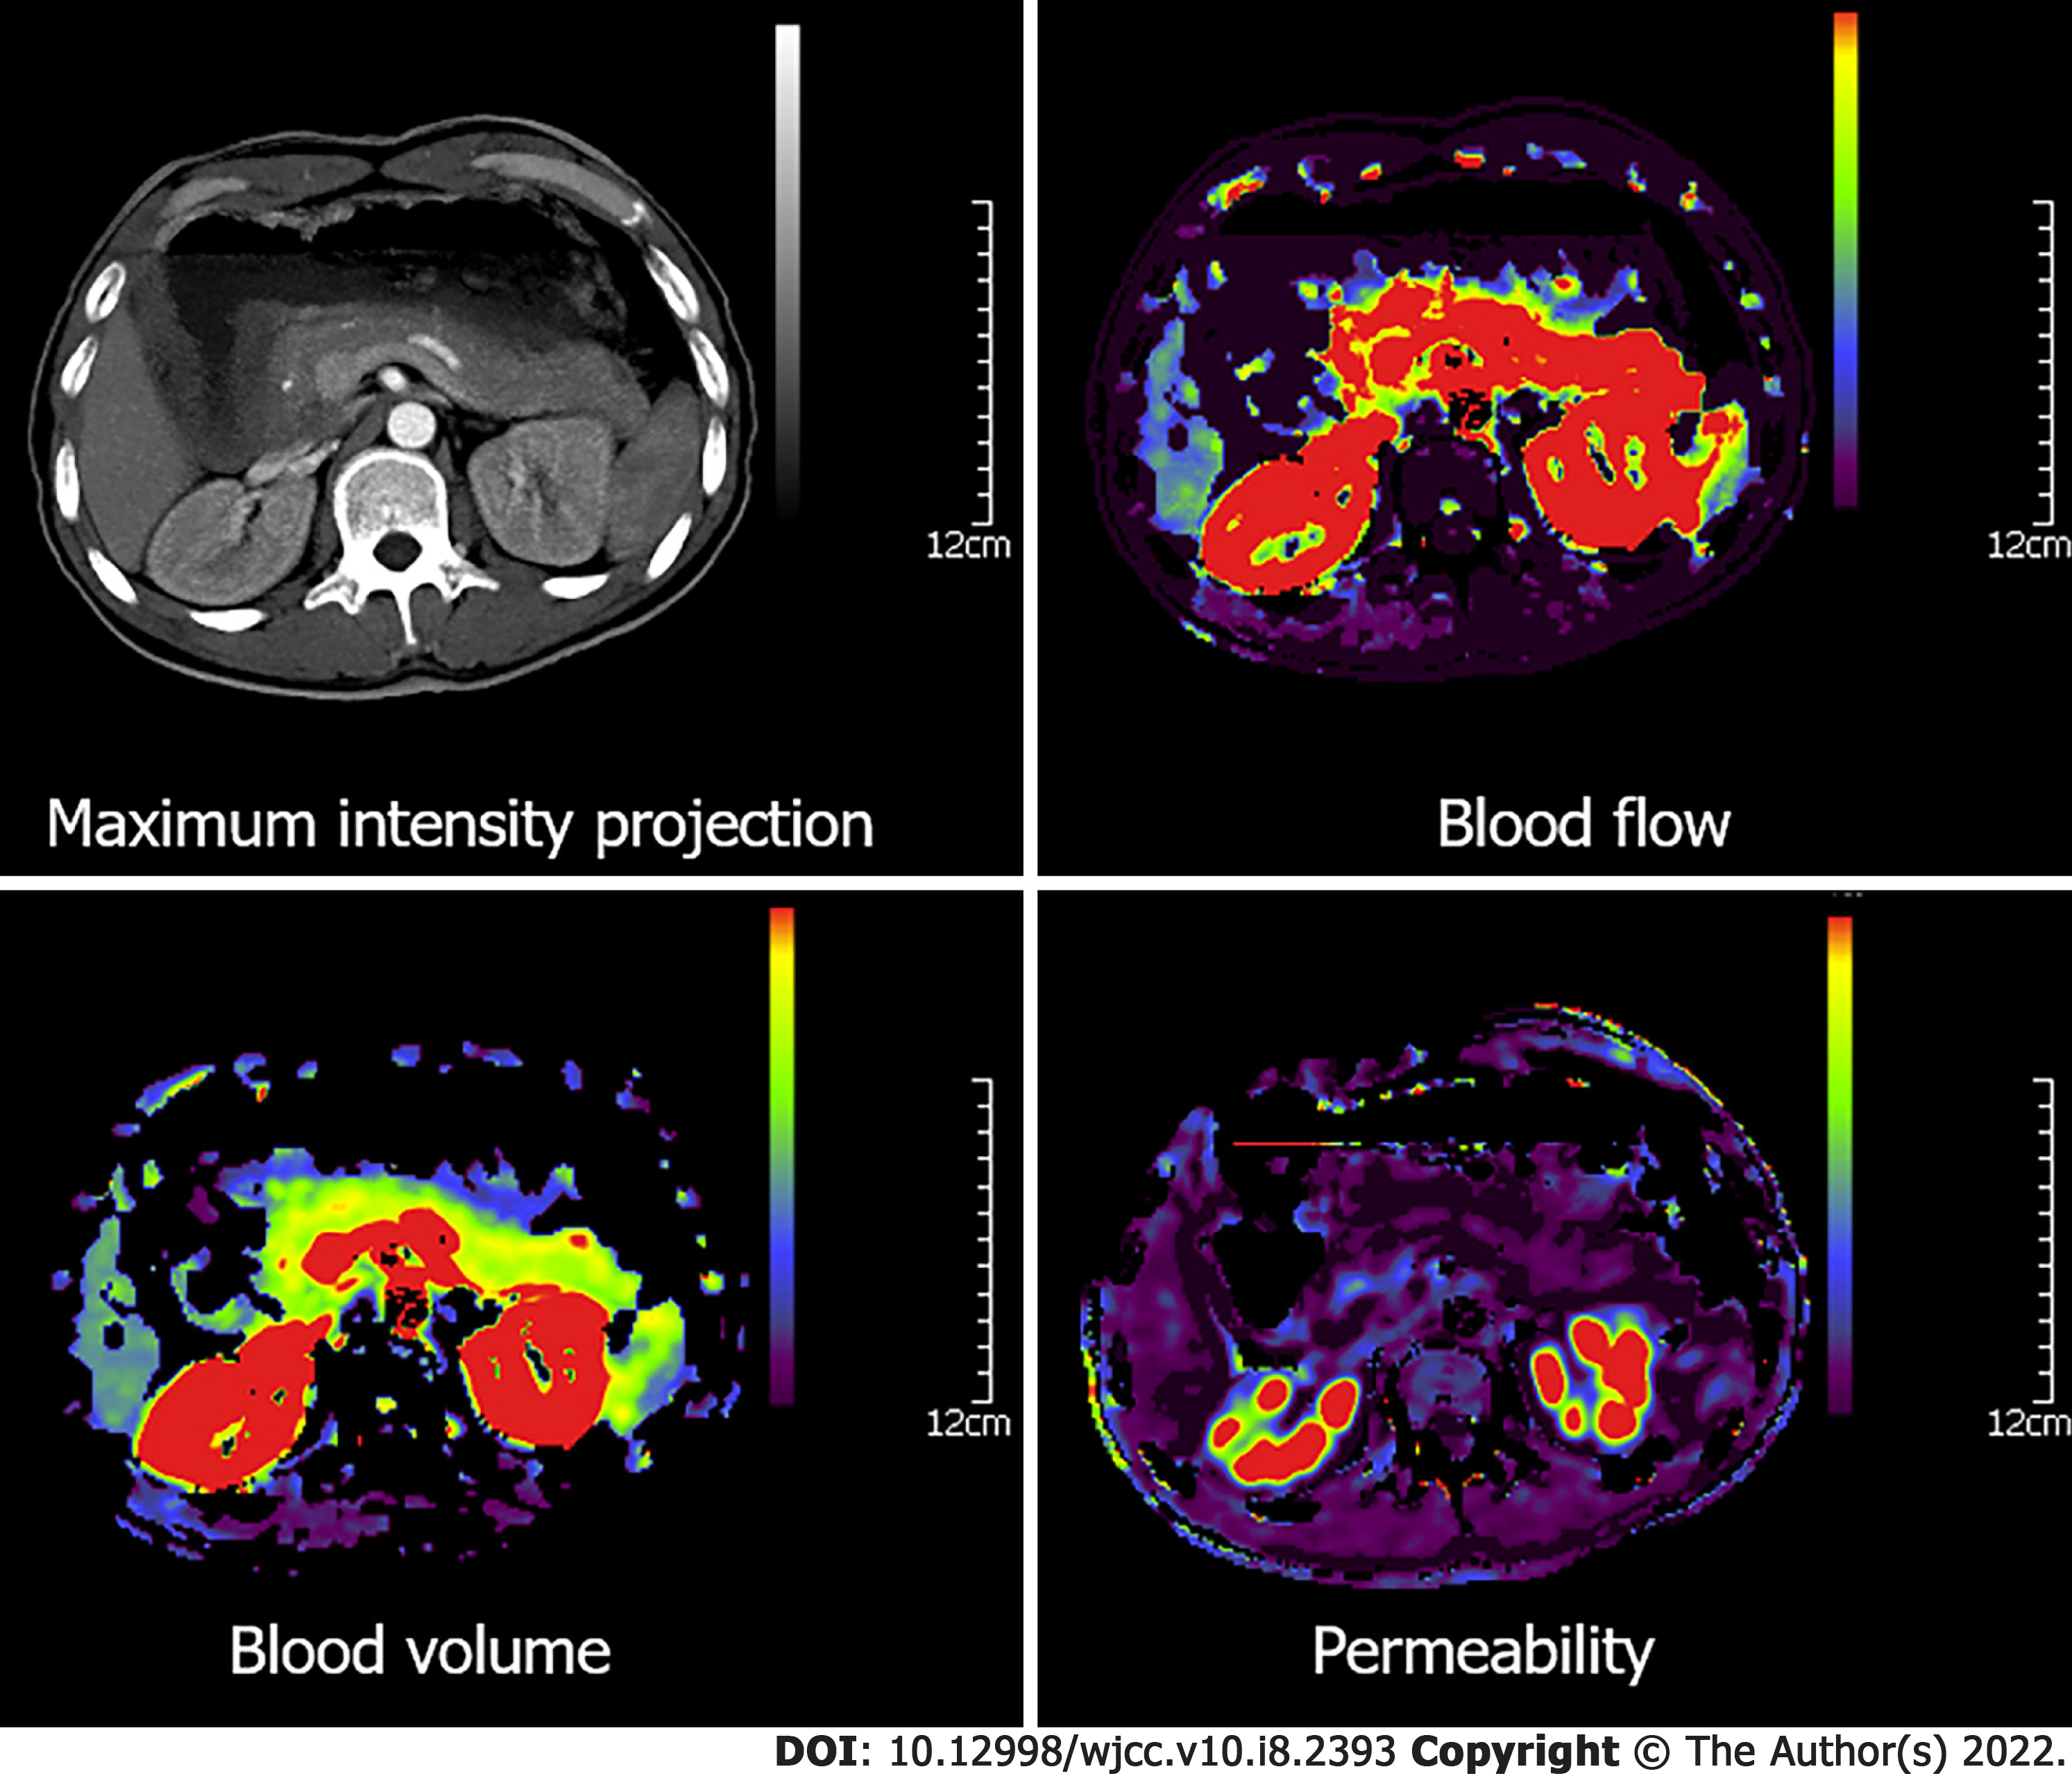
Figure 1 Representative computed tomography perfusion parameters in the pancreas of a healthy volunteer.
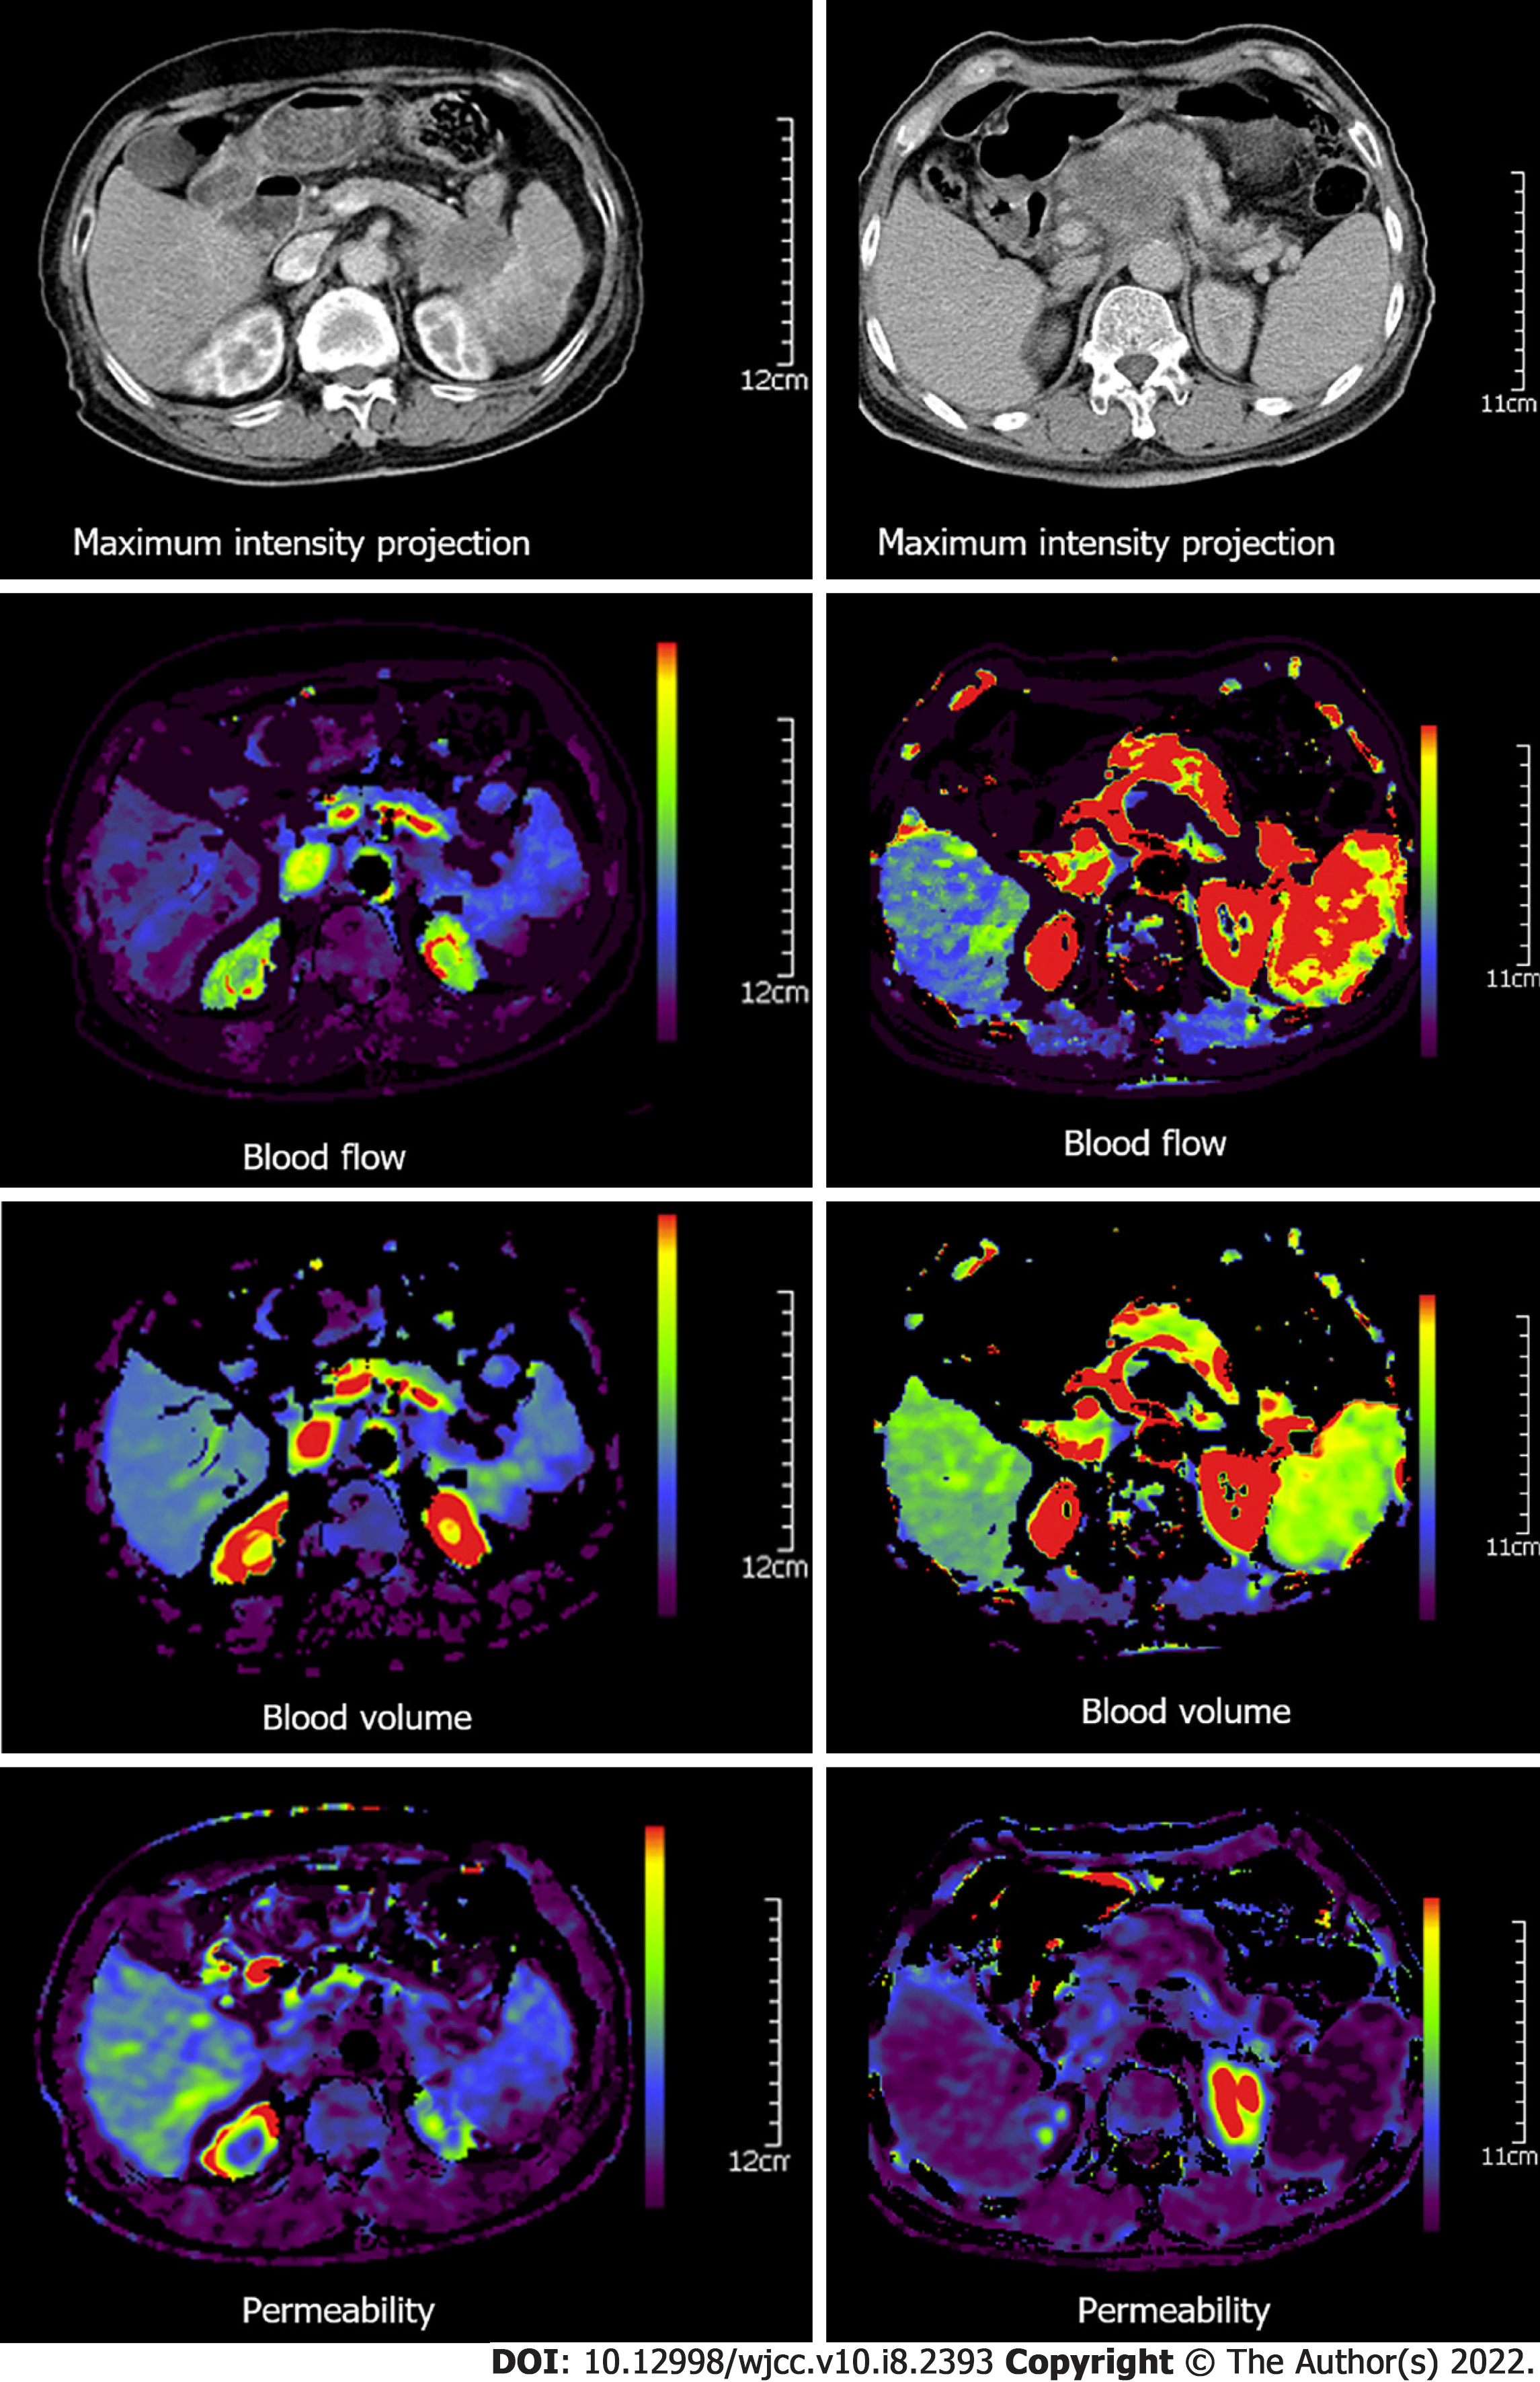
Figure 2 Representative computed tomography perfusion parameters of grade II (left) vs grade III (right) pancreatic adenocarcinoma patients.
The pancreatic adenocarcinoma patients had a lower density on the maximum-density projection images, as well as lower values of blood flow, blood volume, and permeability, as compared with the adjacent relatively normal pancreatic tissue.
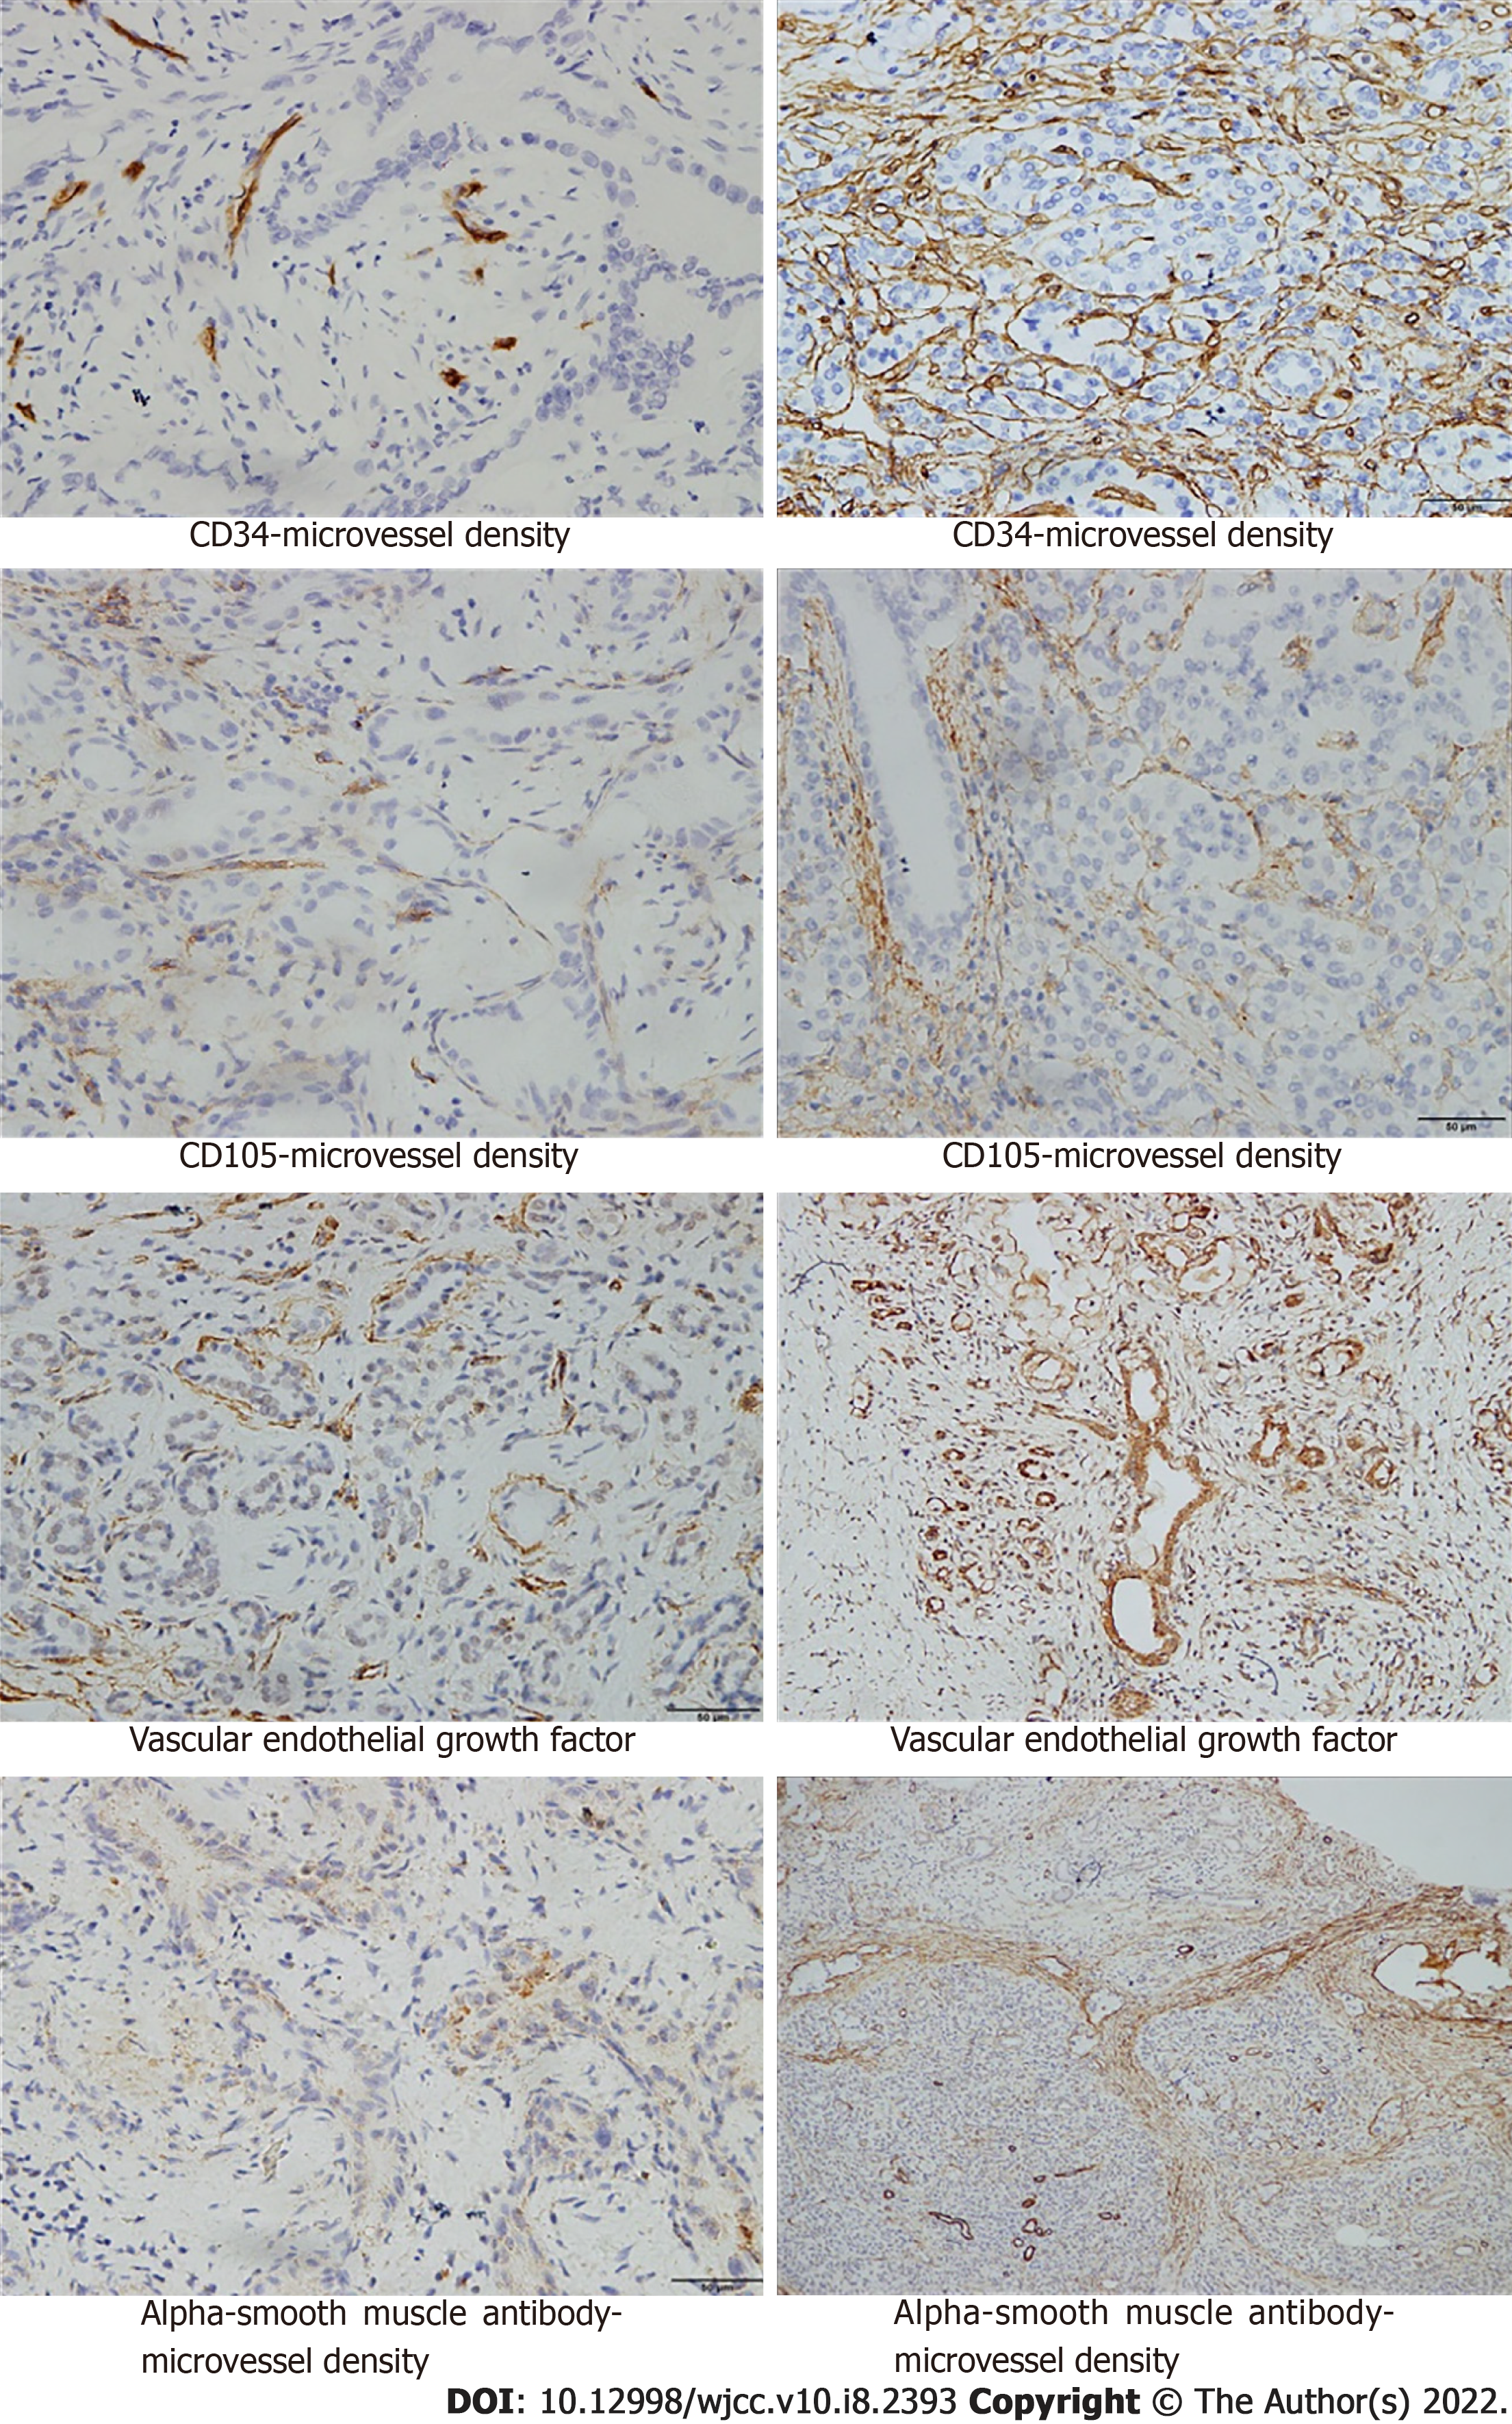
Figure 3 Immunohistochemical indicators in patients with pancreatic adenocarcinoma.
CD34-MVD, CD105-MVD, VEGF, and (α-SMA)-MVD in patients with grade III pancreatic adenocarcinoma (right) were compared with CD34-MVD, CD105-MVD, VEGF, and (α-SMA)-MVD in patients with grade I pancreatic adenocarcinoma (left). Magnification × 400.
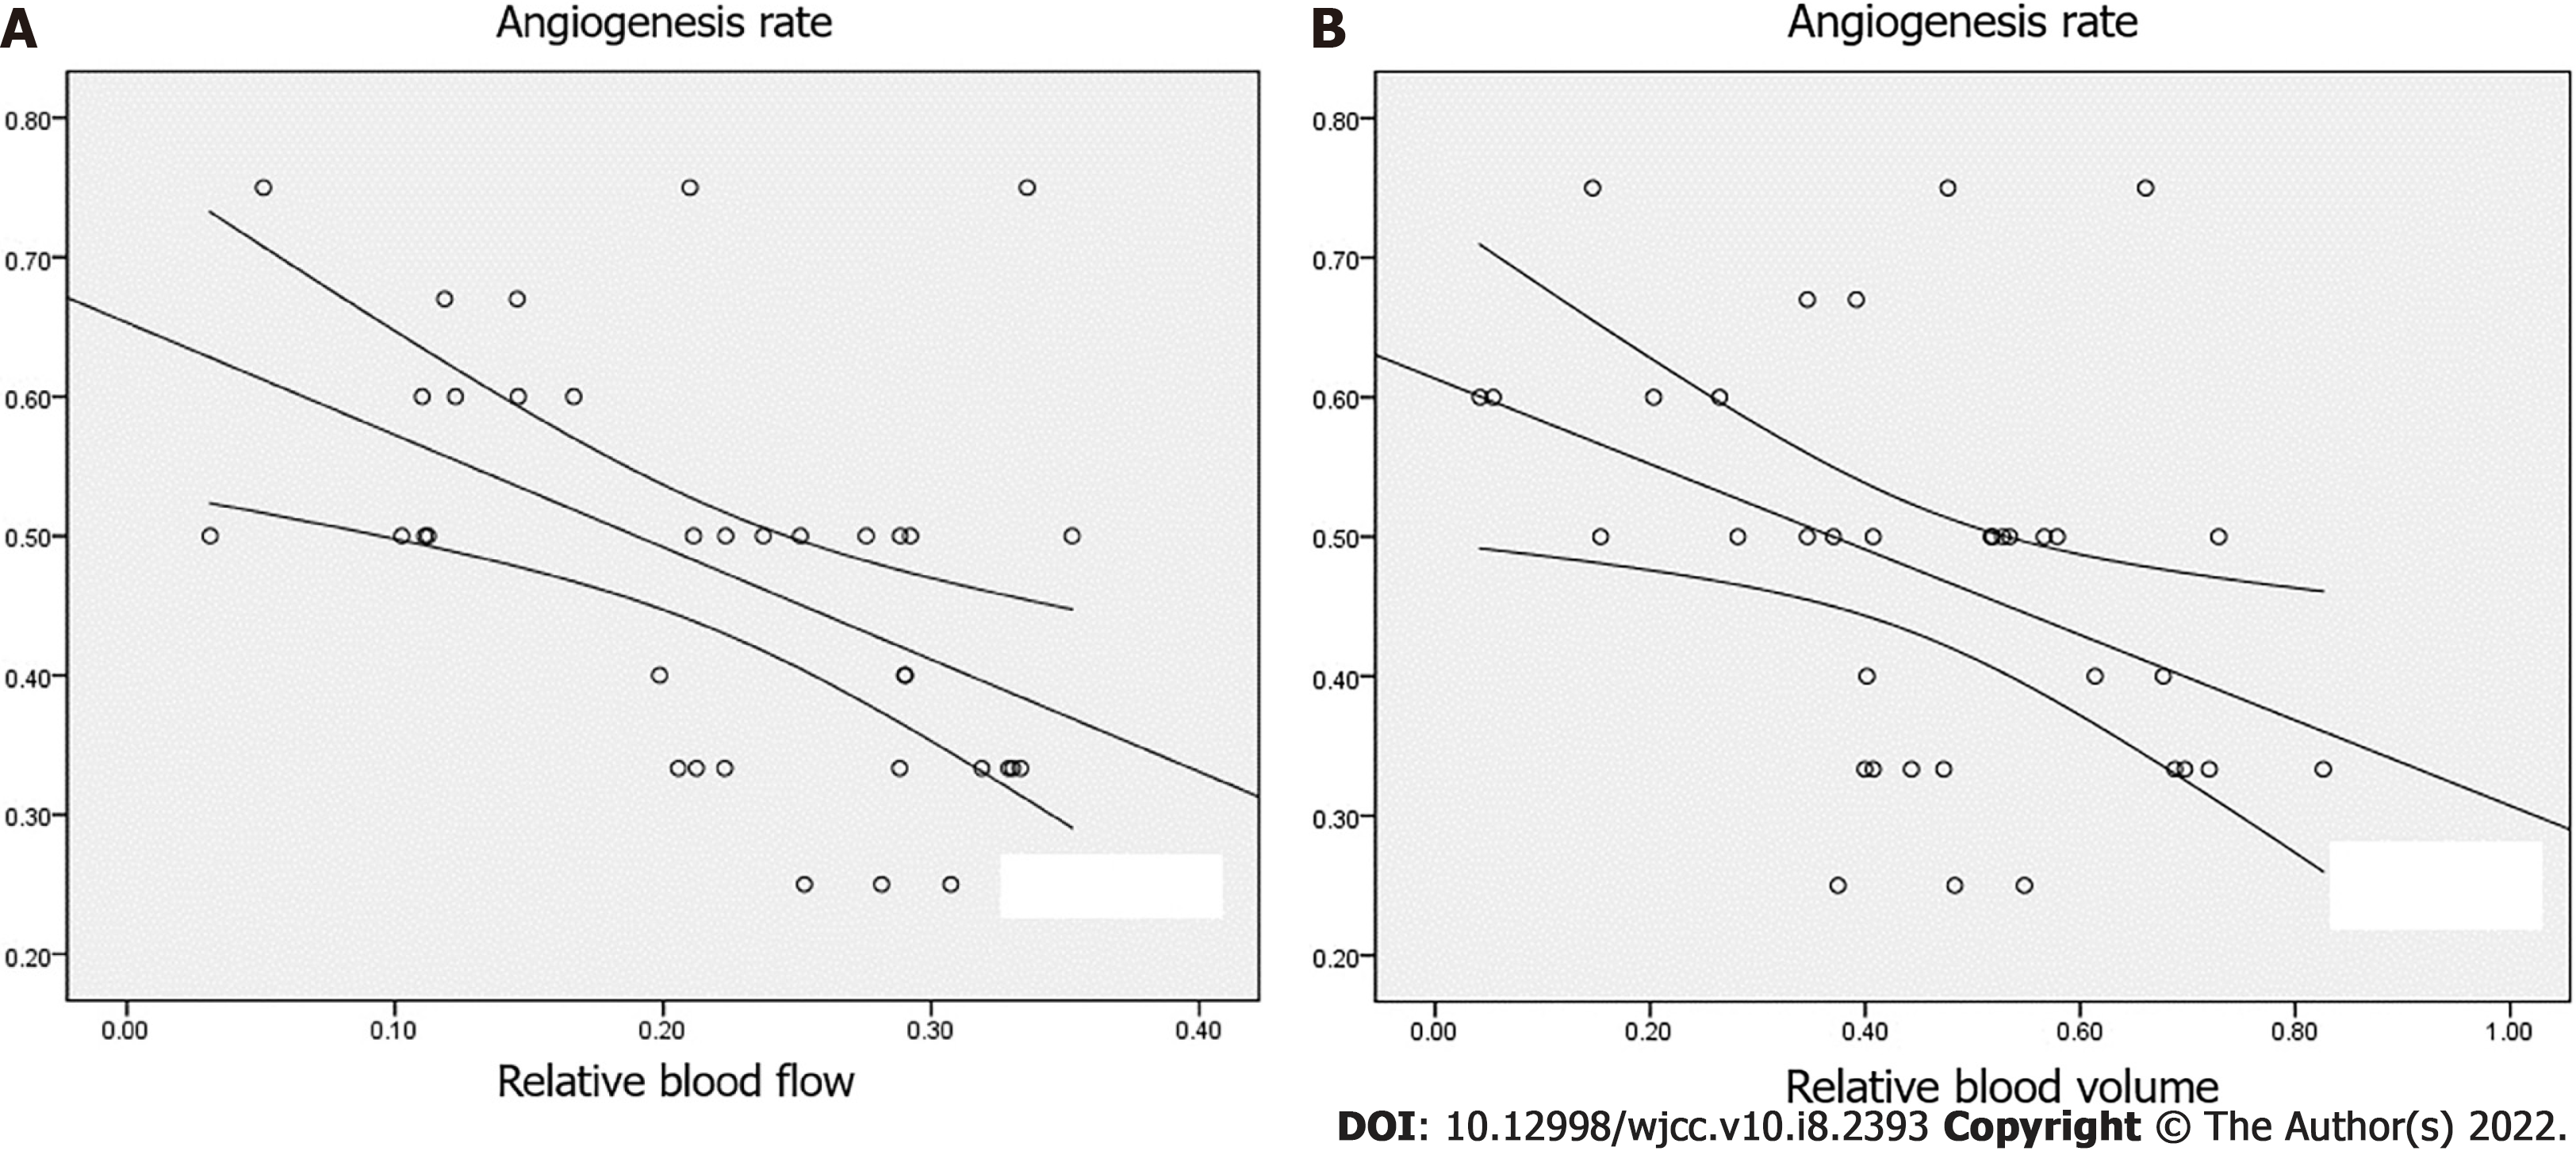
Figure 4 Correlation between relative blood flow and relative blood volume and angiogenesis rate.
A: Correlation between relative blood flow and angiogenesis rate (AR); B: Correlation between relative blood volume and AR.
- Citation: Liu W, Yin B, Liang ZH, Yu Y, Lu N. Computed tomography perfusion imaging evaluation of angiogenesis in patients with pancreatic adenocarcinoma. World J Clin Cases 2022; 10(8): 2393-2403
- URL: https://www.wjgnet.com/2307-8960/full/v10/i8/2393.htm
- DOI: https://dx.doi.org/10.12998/wjcc.v10.i8.2393


