Copyright
©The Author(s) 2022.
World J Clin Cases. Mar 16, 2022; 10(8): 2382-2392
Published online Mar 16, 2022. doi: 10.12998/wjcc.v10.i8.2382
Published online Mar 16, 2022. doi: 10.12998/wjcc.v10.i8.2382
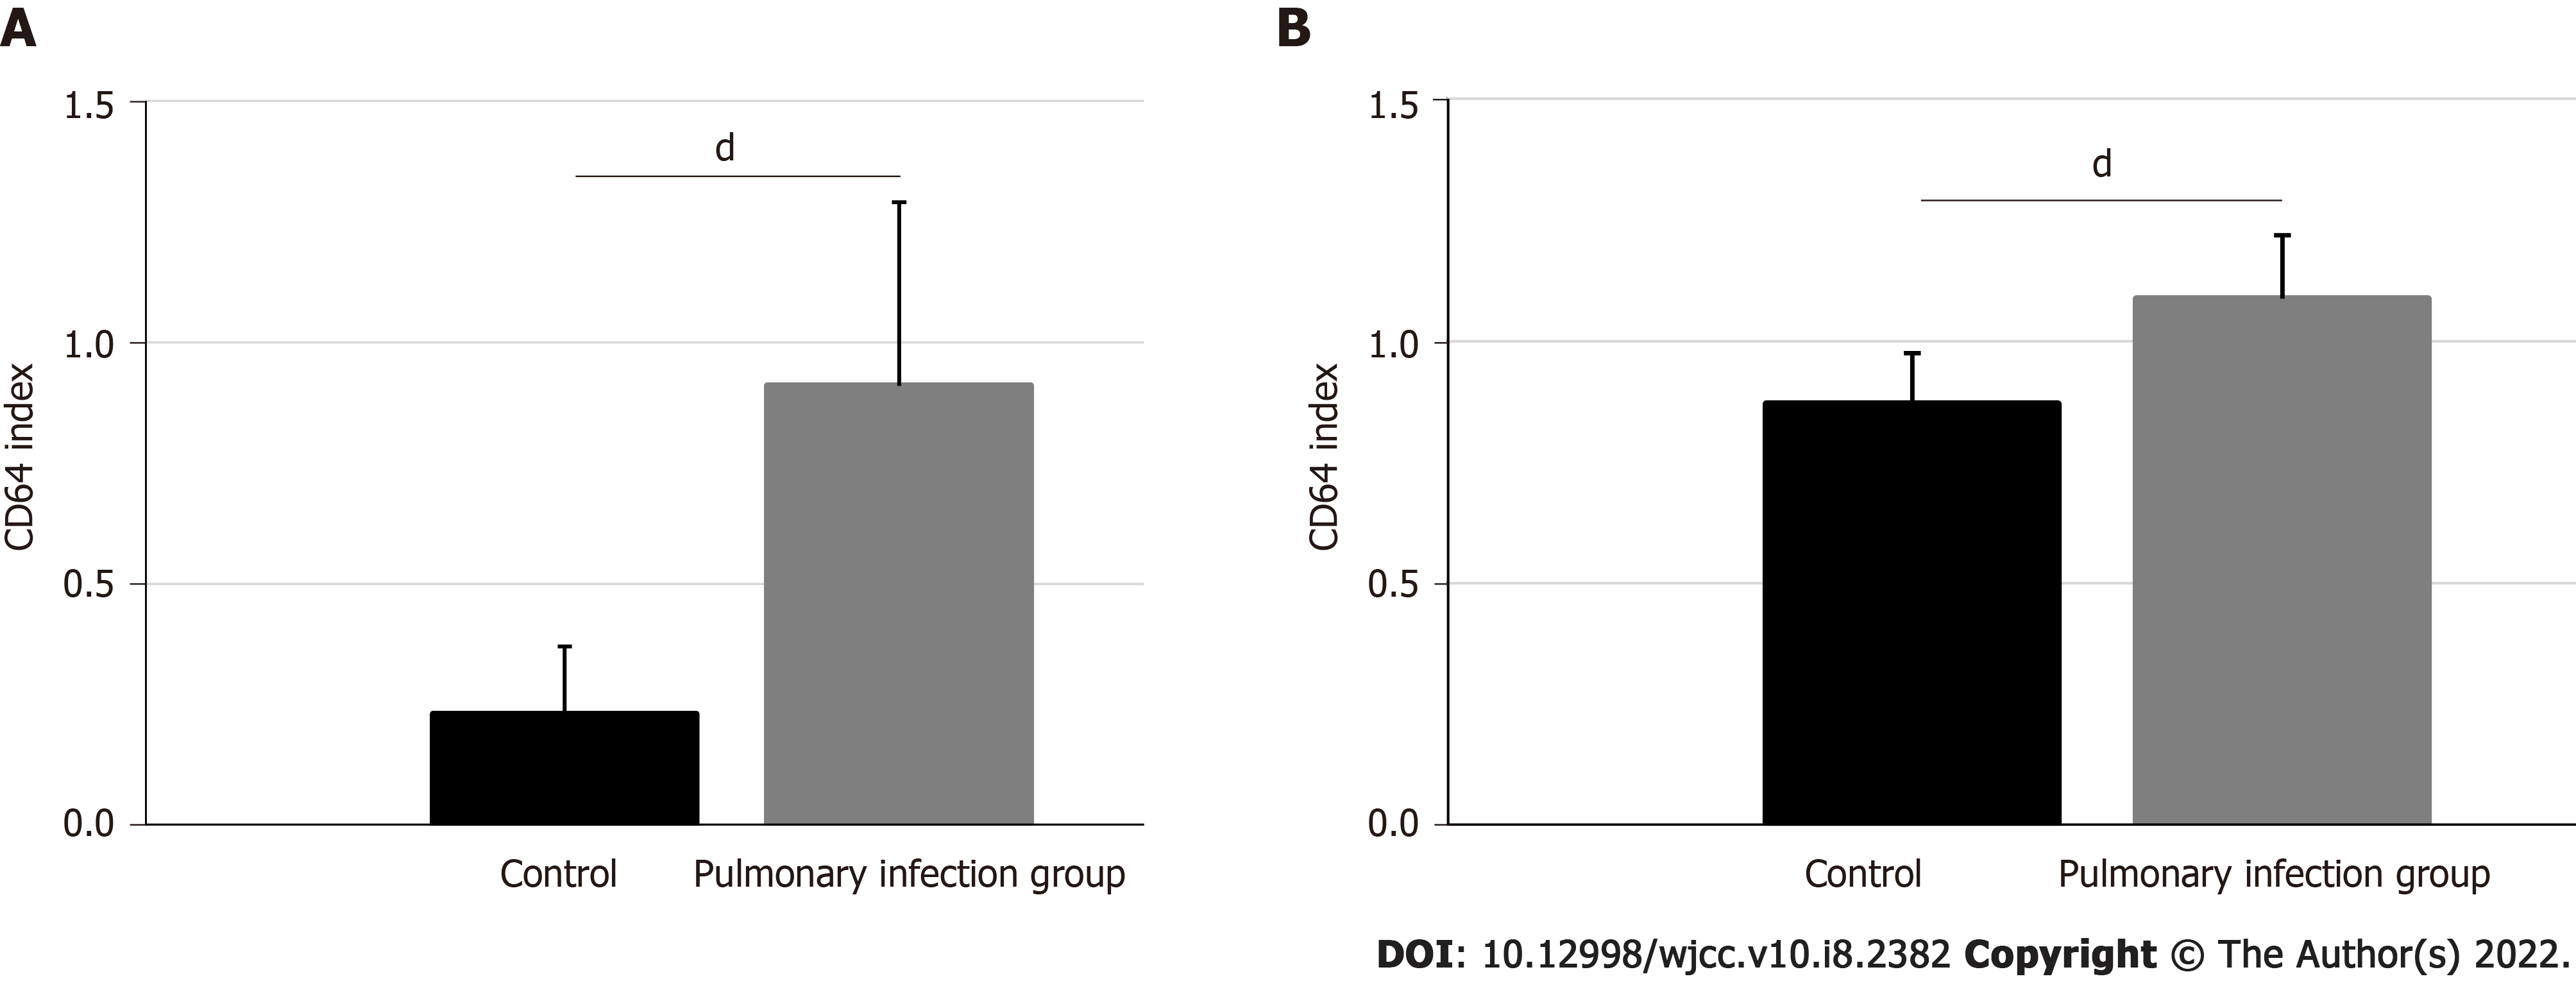
Figure 1 Comparison of CD64 index and serum activin A levels between chronic obstructive pulmonary disease patients with pulmonary infections and those without.
A: CD64 index; B: Serum activin A. dP < 0.001.
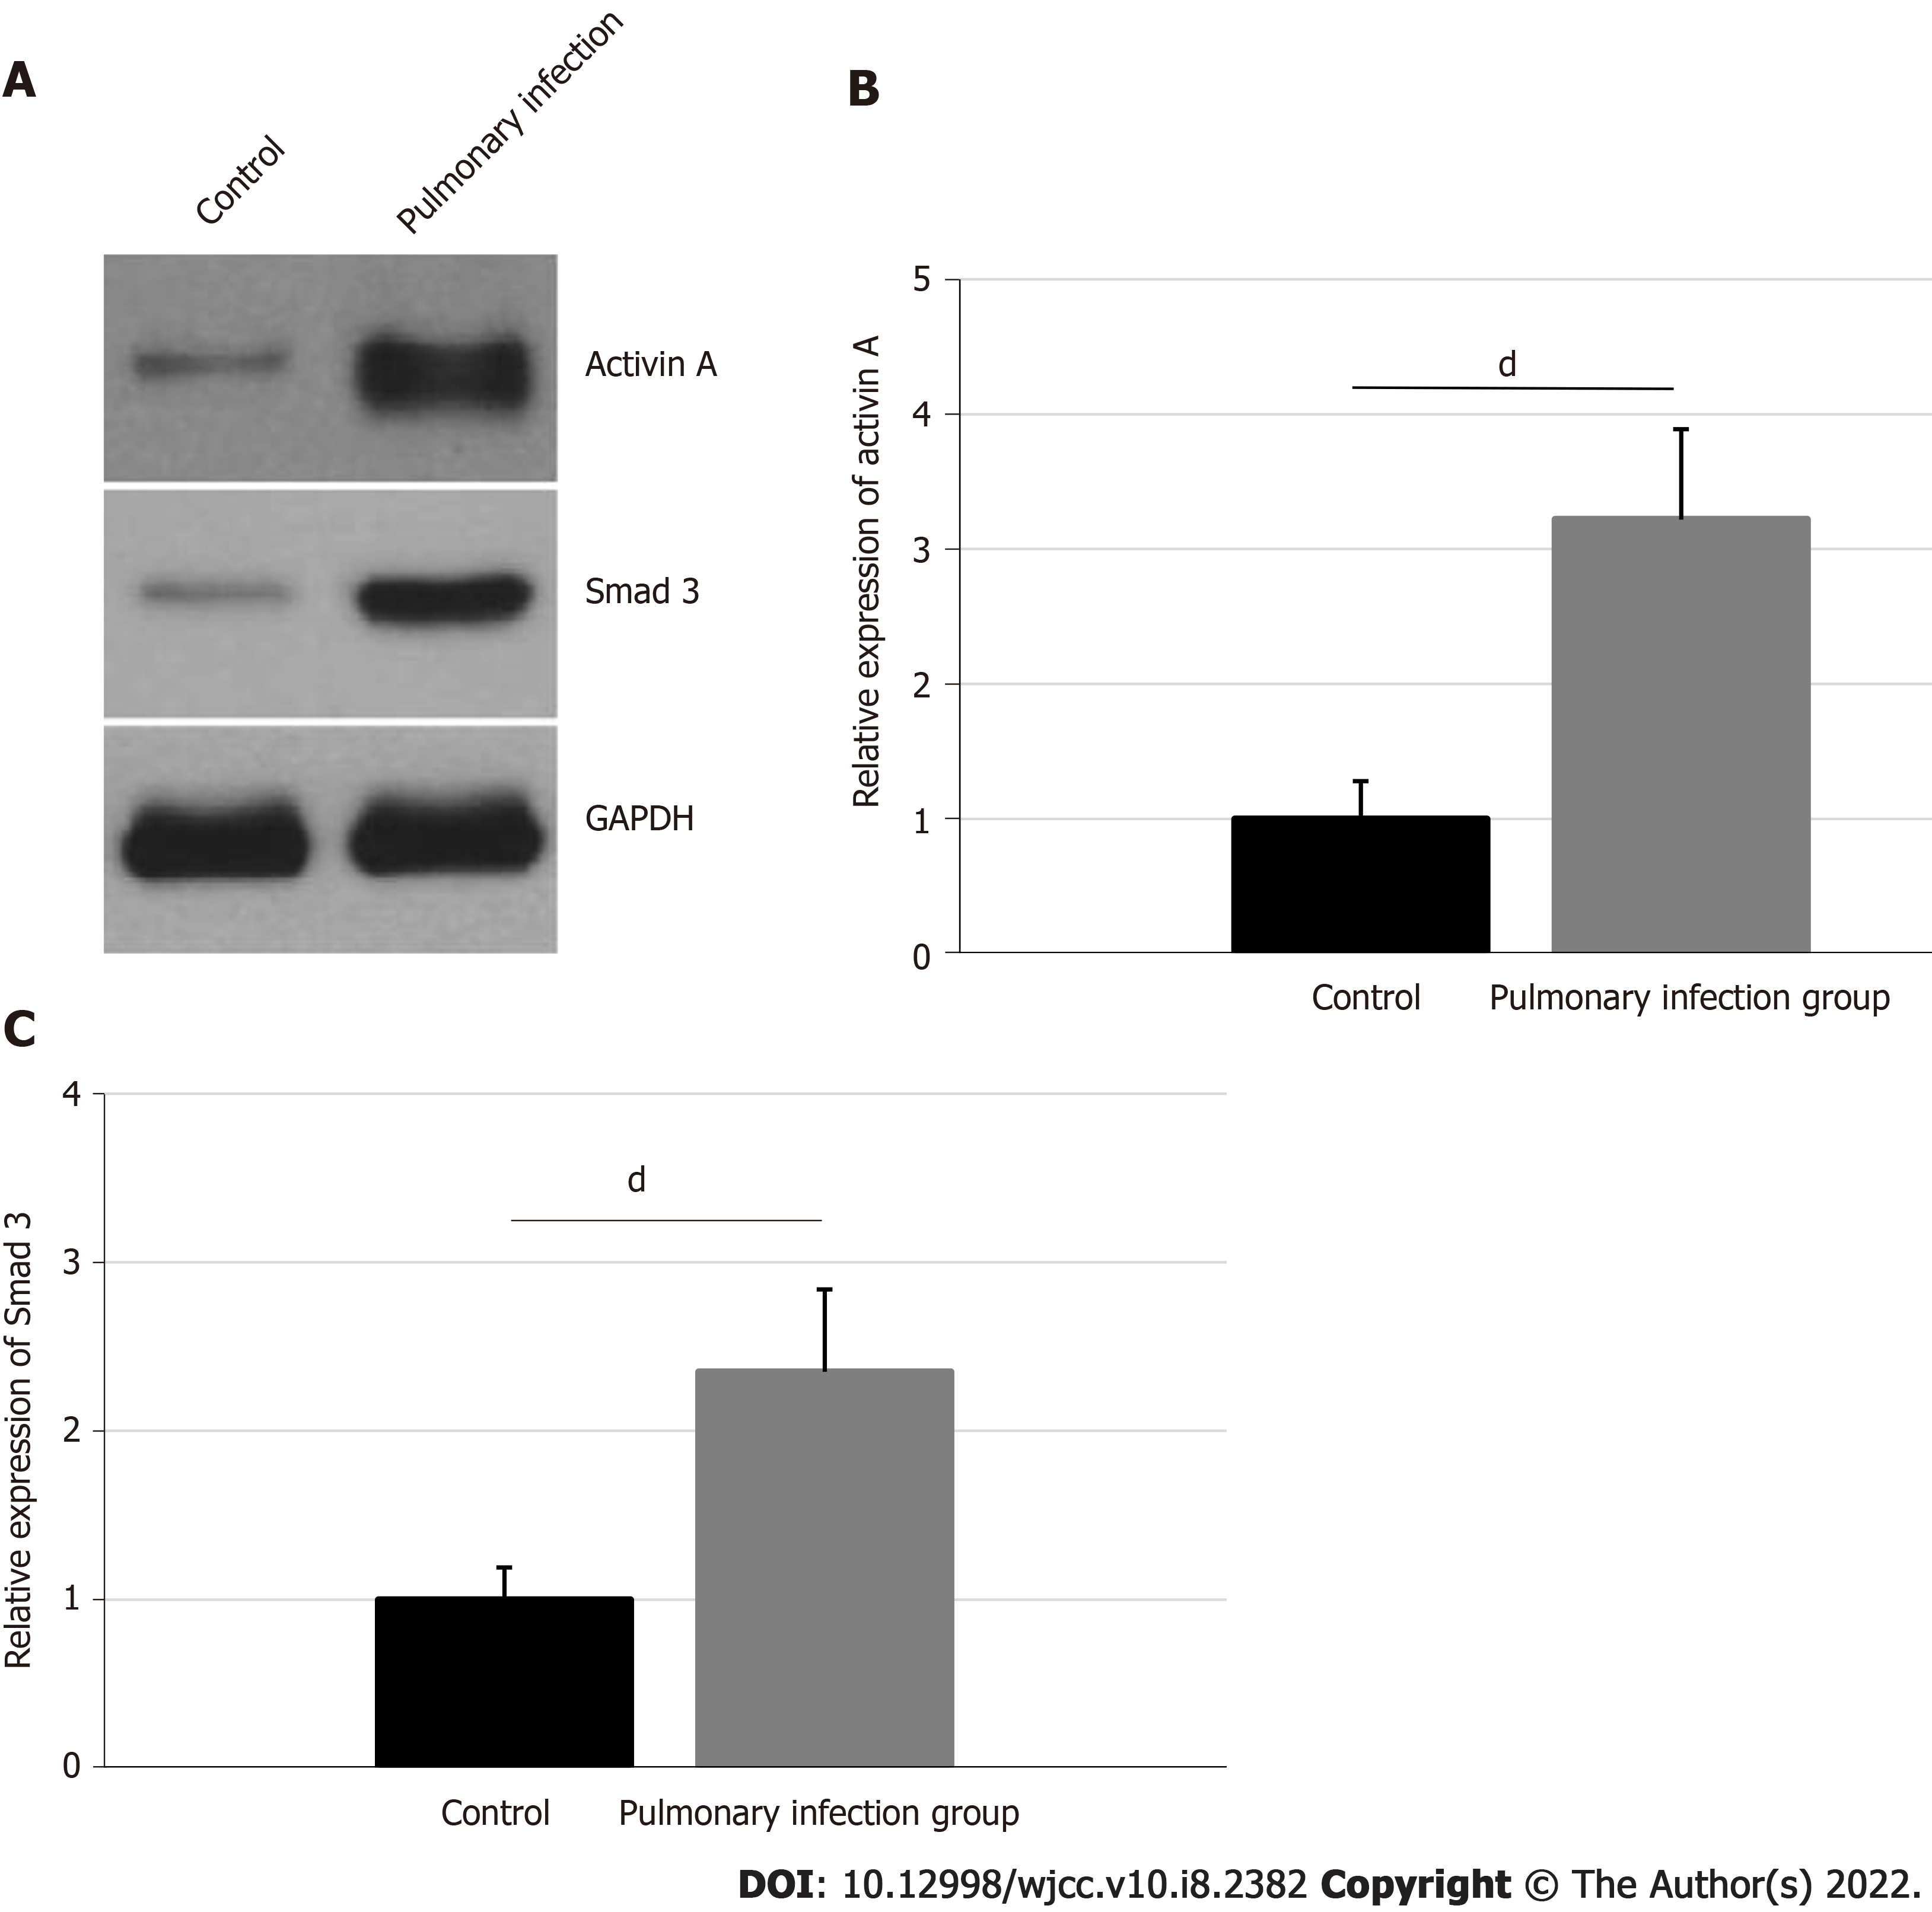
Figure 2 Pulmonary infections promote activation of the neutrophil activin A/Smad3 signaling pathway.
A: Western blot analysis of activin A and Smad3 levels in neutrophils; B: Comparison of the relative gray values of activin A between the chronic obstructive pulmonary disease (COPD) patients with pulmonary infections and those without; C: Comparison of the relative gray values of Smad3 between COPD patients with pulmonary infections and those without. dP < 0.001.
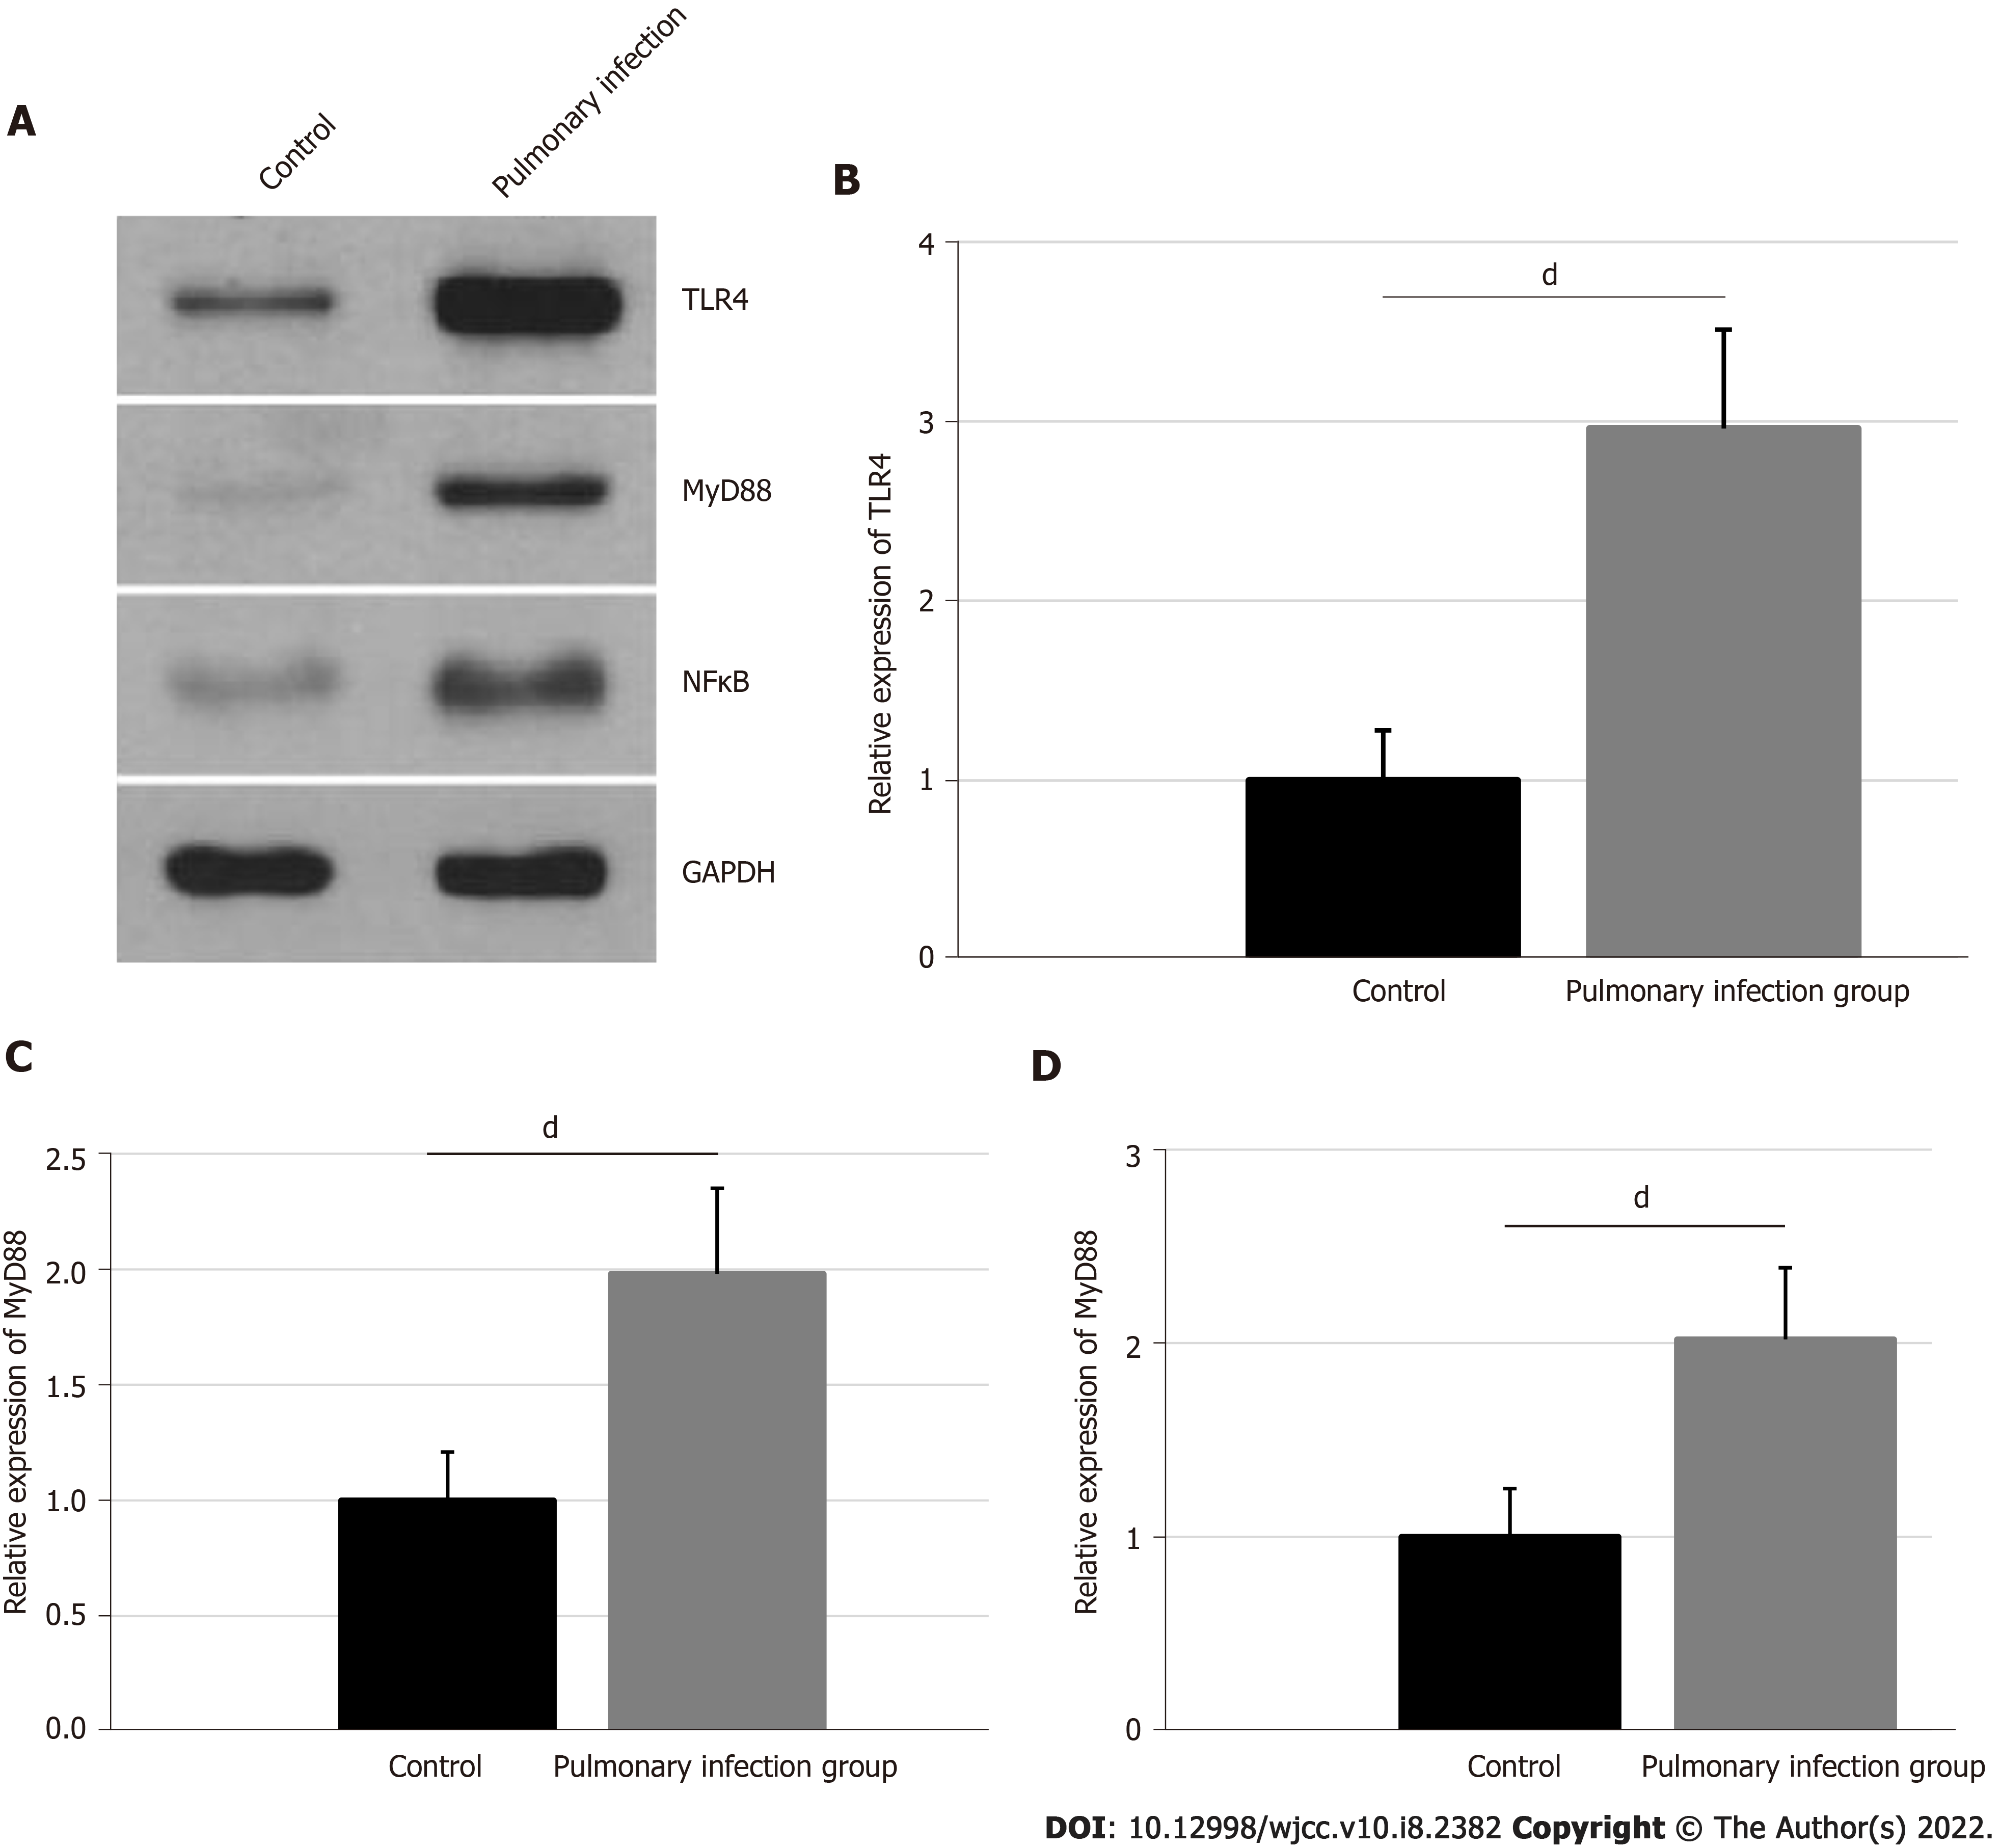
Figure 3 Comparisons of expressions of TLR4, MyD88 and NFκB in neutrophils between two groups.
A: Western blot bands of TLR4, MyD88 and NFκB in neutrophils; B: Comparison of relative gray values of TLR4 between two groups; C: Comparison of relative gray values of MyD88 between two groups; D: Comparison of relative gray values of NFκB between two groups. dP < 0.001.
- Citation: Fei ZY, Wang J, Liang J, Zhou X, Guo M. Analysis of bacterial spectrum, activin A, and CD64 in chronic obstructive pulmonary disease patients complicated with pulmonary infections. World J Clin Cases 2022; 10(8): 2382-2392
- URL: https://www.wjgnet.com/2307-8960/full/v10/i8/2382.htm
- DOI: https://dx.doi.org/10.12998/wjcc.v10.i8.2382


