Copyright
©The Author(s) 2022.
World J Clin Cases. Feb 26, 2022; 10(6): 1863-1868
Published online Feb 26, 2022. doi: 10.12998/wjcc.v10.i6.1863
Published online Feb 26, 2022. doi: 10.12998/wjcc.v10.i6.1863
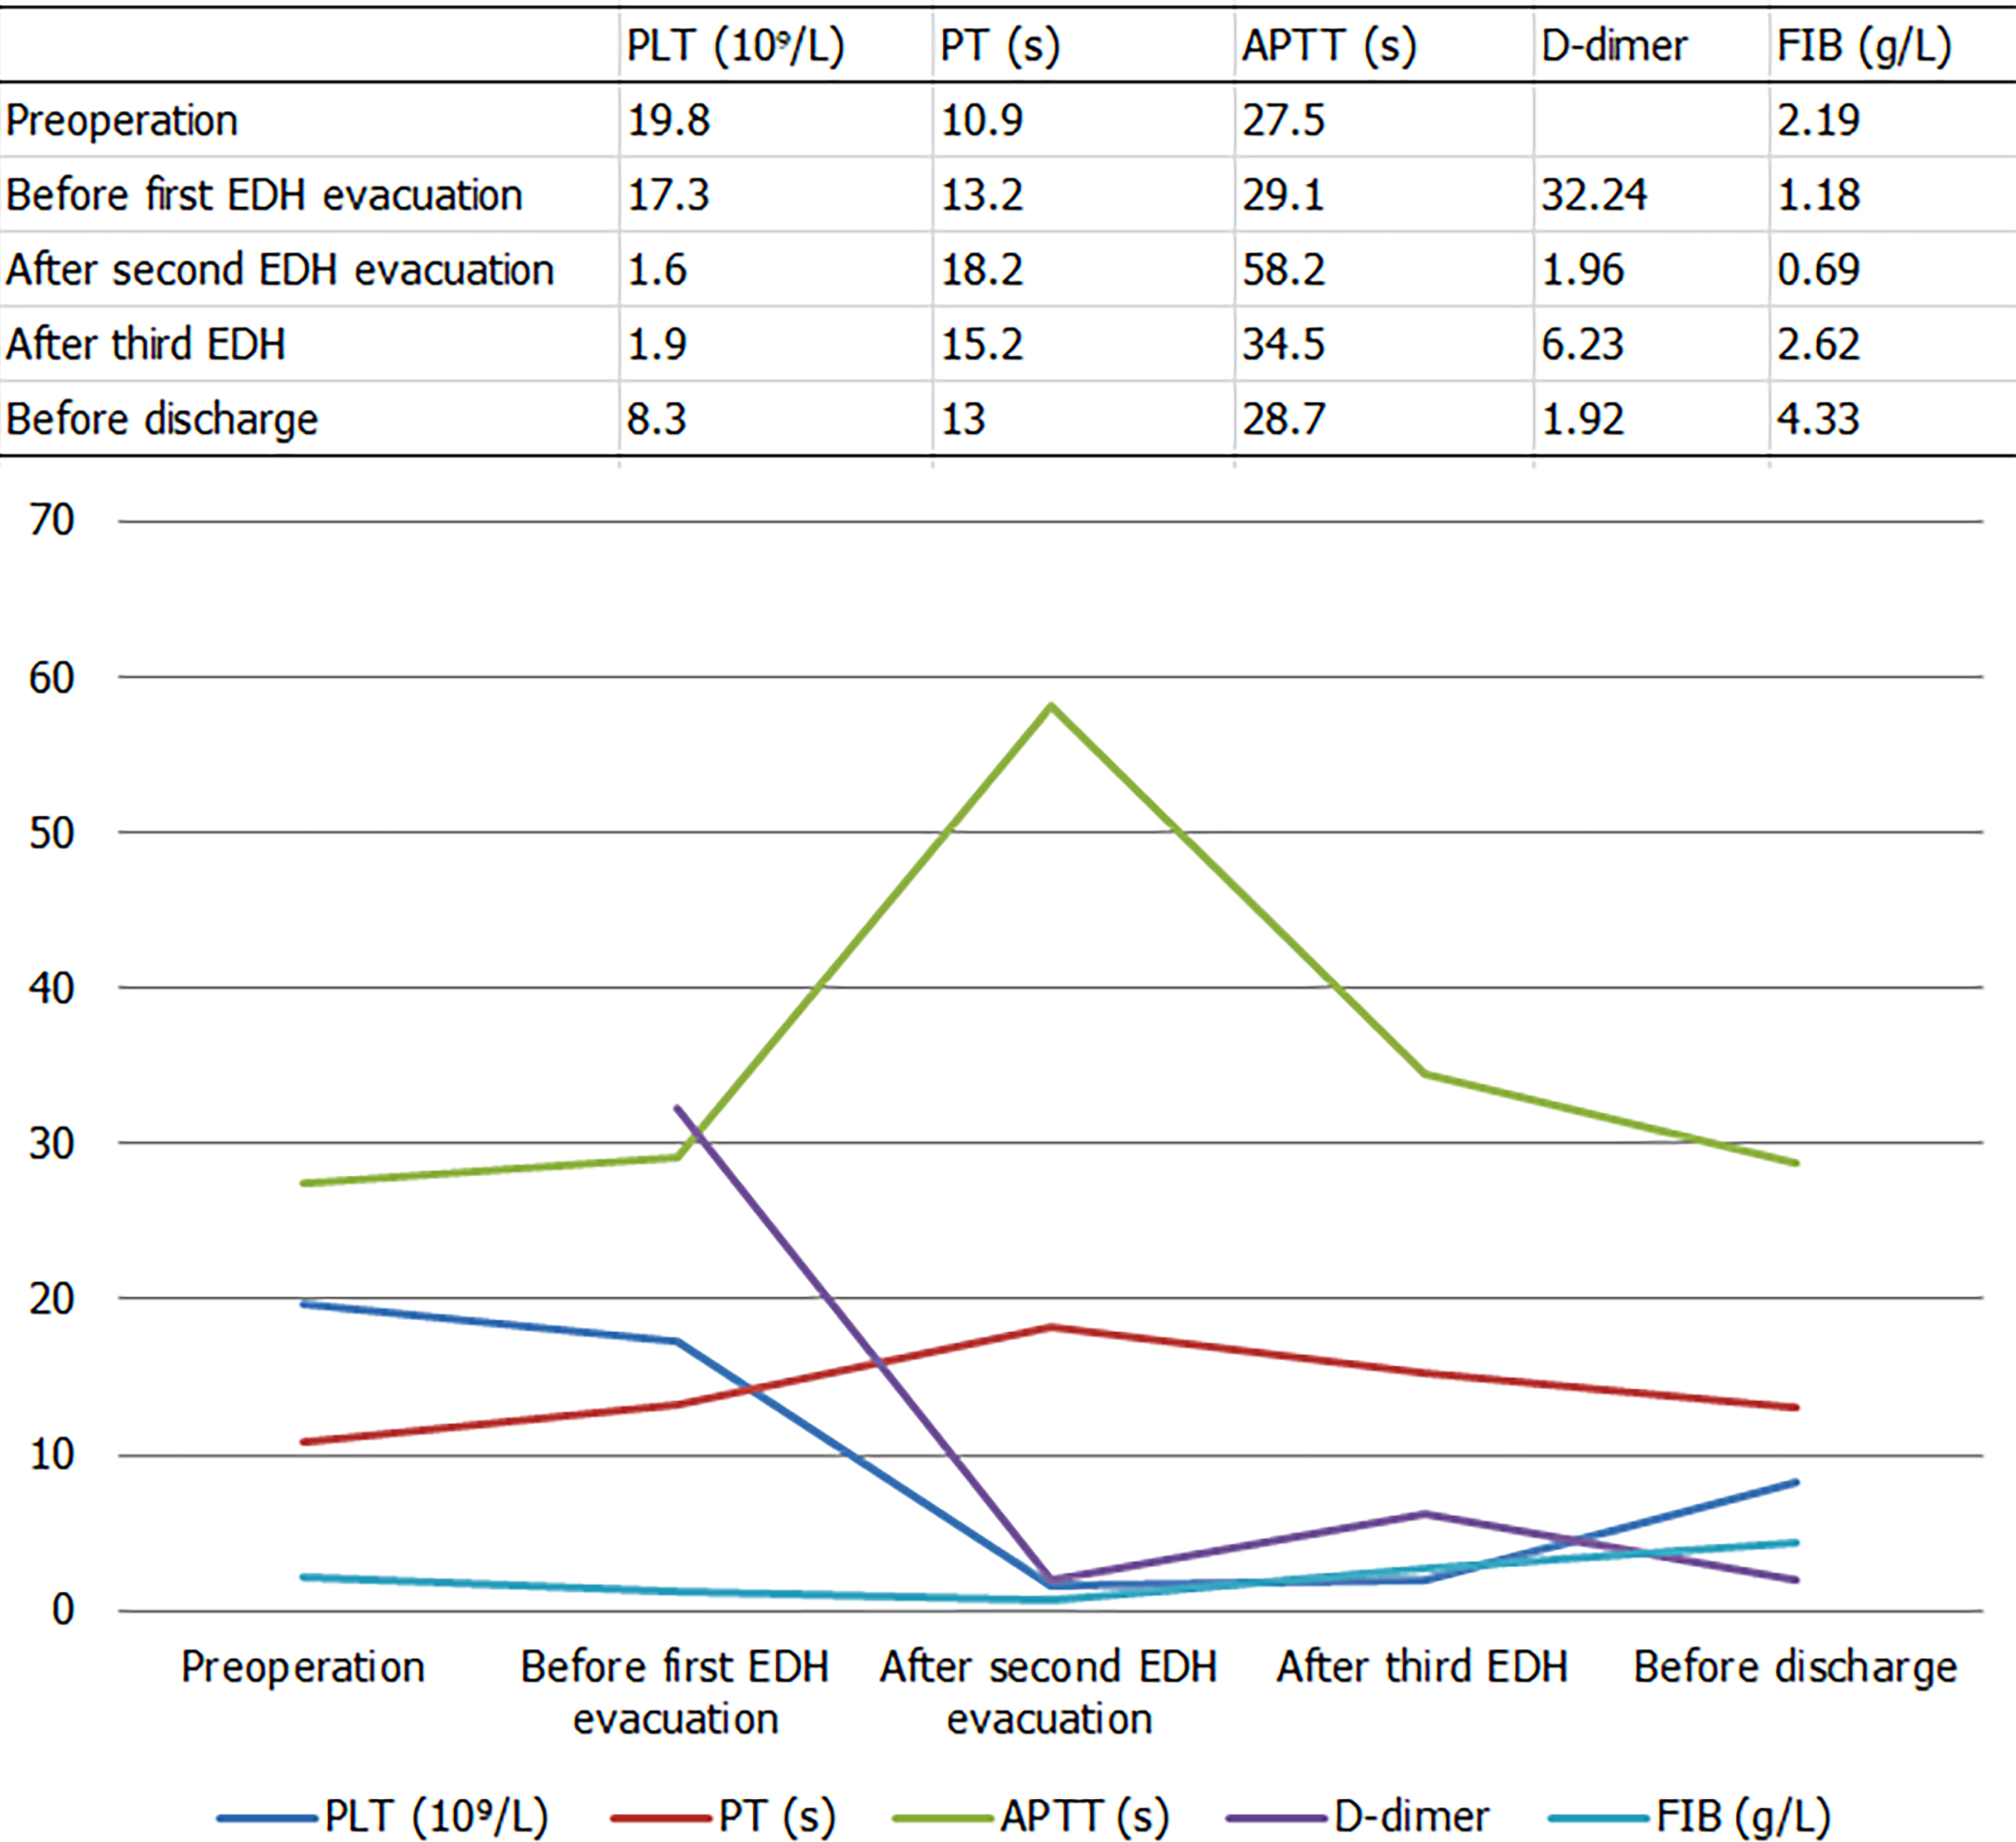
Figure 1 The change of platelet count and the fluctuation of prothrombin time and activated partial thromboplastin time were observed after the second extradural hematoma evacuation.
PLT: Platelets; PT: Prothrombin time, APTT: Activated partial thromboplastin time; EDH: Epidural hematoma.
Figure 2 Computed tomography image and magnetic resonance imaging images of the mass before surgery.
A: Computerized tomography image revealing a solid cystic mass in the right thalamus; B, C: T1 and T2 imaging showing heterogeneous signals and cystic and solid components; D: Inhomogeneous enhancement in the solid part was observed after administration of a contrast agent.
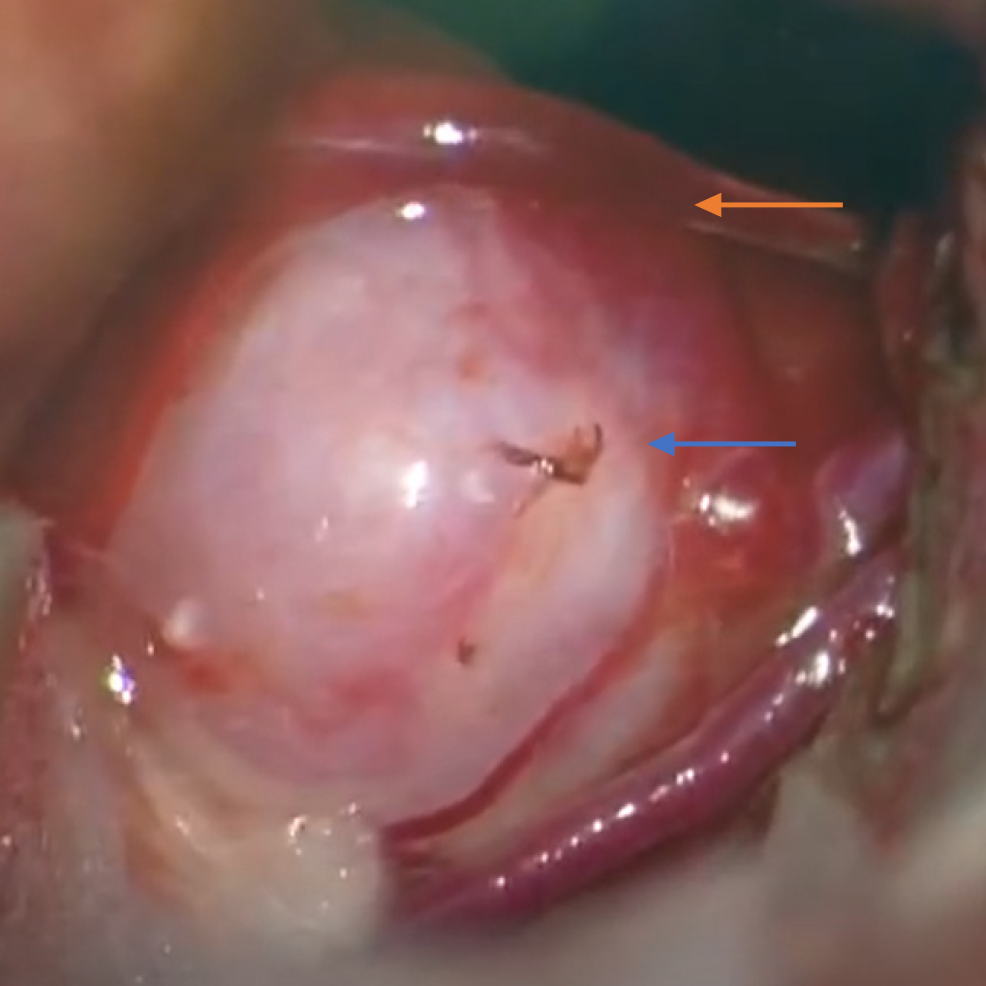
Figure 3 Intraoperative picture showing an aneurysm (blue arrow) and the draining vein (yellow arrow).
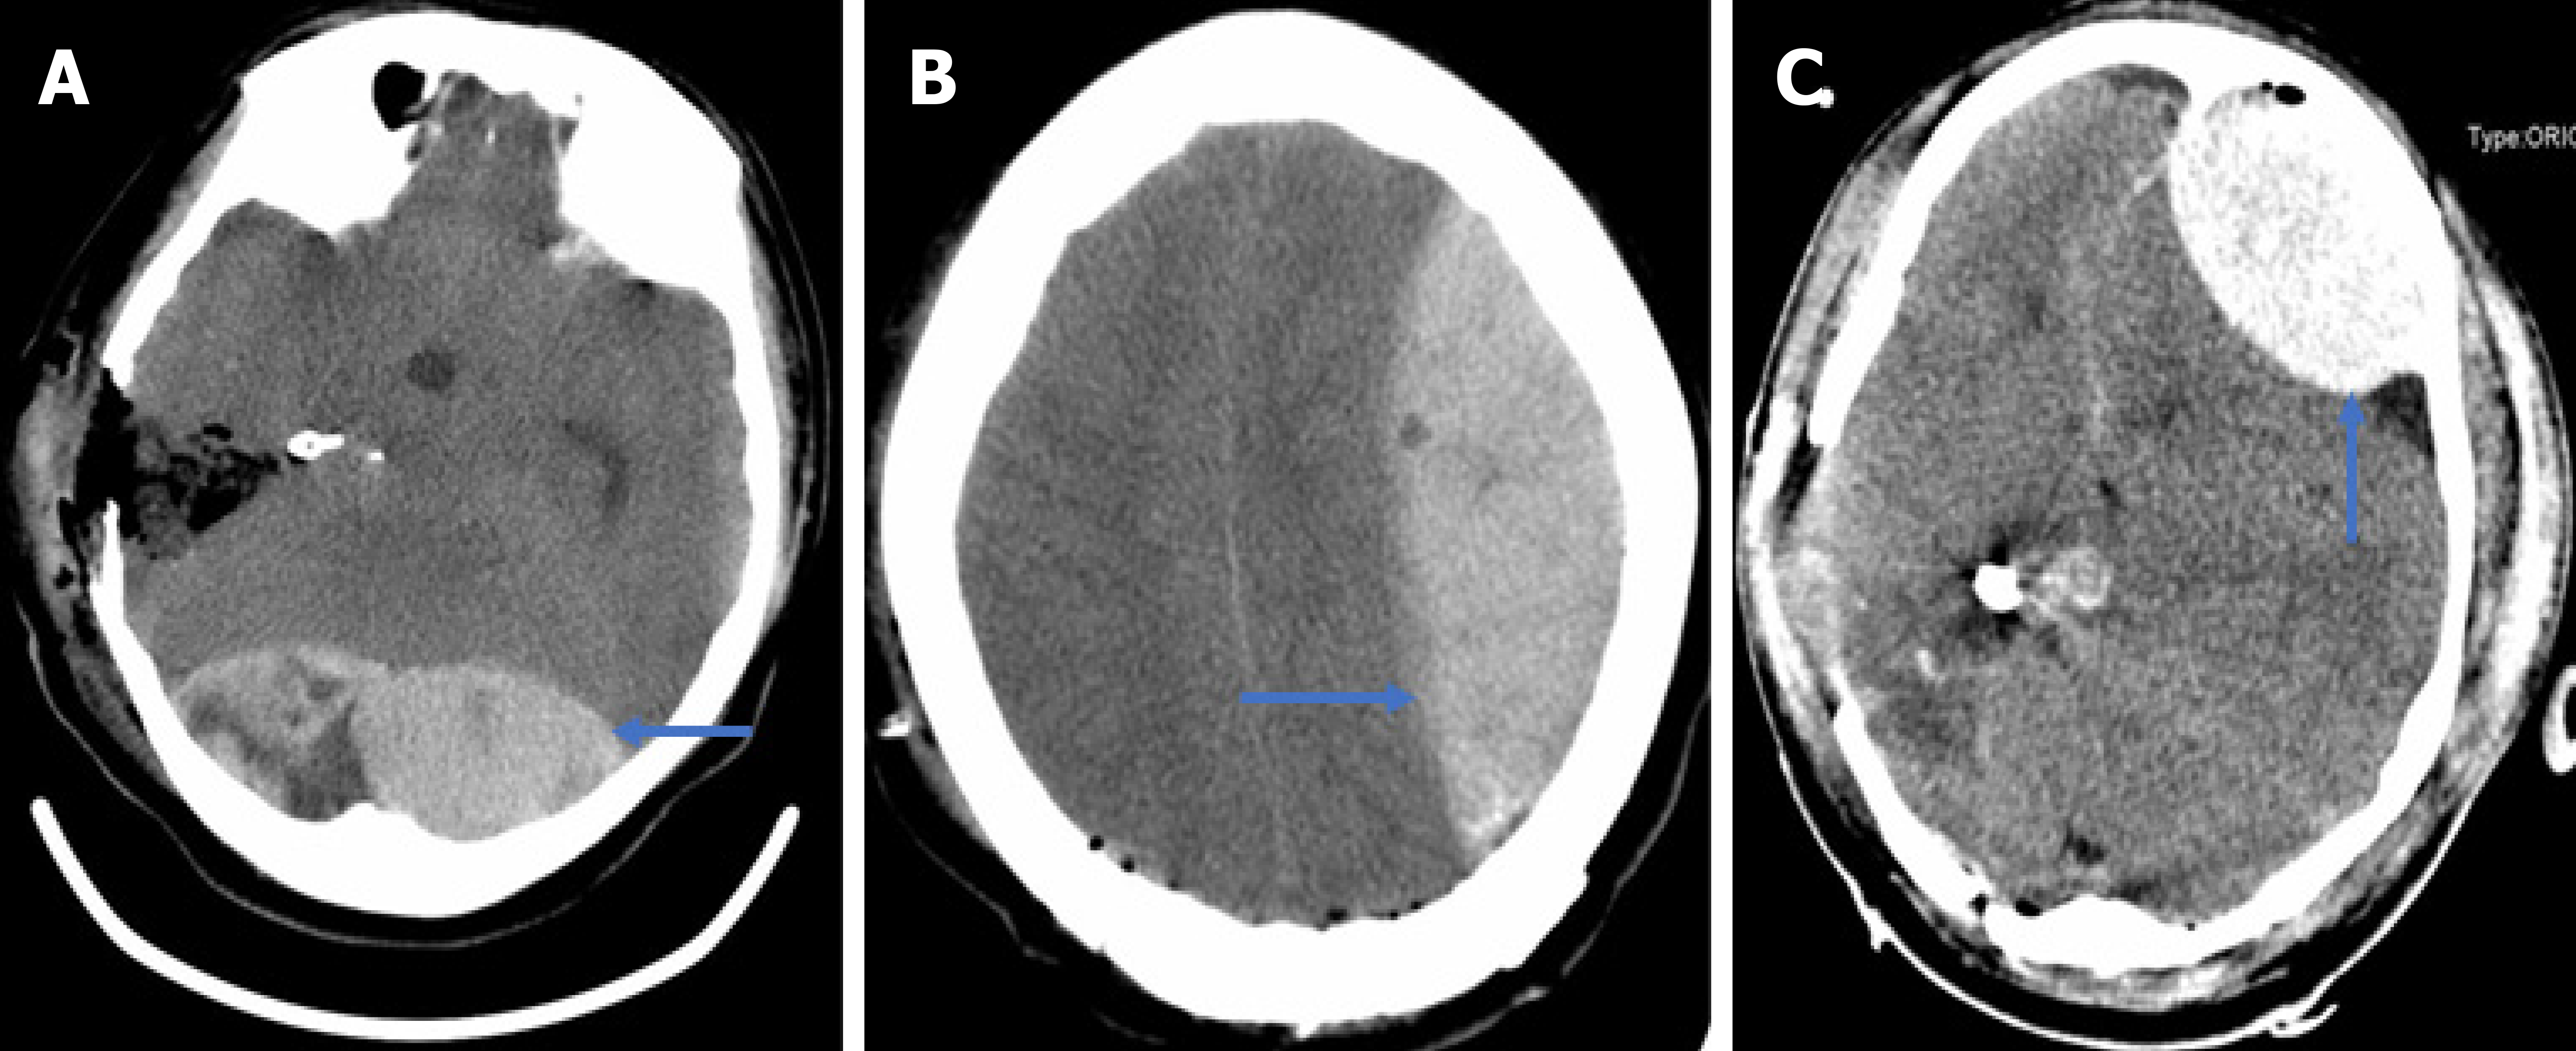
Figure 4 Three extradural hematomas in the occipital, the left frontotemporal, and the left frontal region, respectively (A-C).
- Citation: He Q, Tao CY, Fu RH, You C. Multiple different remote epidural hematomas after craniotomy: A case report. World J Clin Cases 2022; 10(6): 1863-1868
- URL: https://www.wjgnet.com/2307-8960/full/v10/i6/1863.htm
- DOI: https://dx.doi.org/10.12998/wjcc.v10.i6.1863


