Copyright
©The Author(s) 2022.
World J Clin Cases. Feb 16, 2022; 10(5): 1667-1674
Published online Feb 16, 2022. doi: 10.12998/wjcc.v10.i5.1667
Published online Feb 16, 2022. doi: 10.12998/wjcc.v10.i5.1667
Figure 1 Conventional abdominal ultrasound examination.
A: Gray-scale sonography showed a hypoechoic lesion (orange arrow), size 4.7 cm × 4.4 cm, with clear and regular boundary, between the upper pole of the spleen and the abdominal aorta; B: Color Doppler showed no evident blood flow.
Figure 2 Abdominal computed tomography plain scan and enhancement.
A: Plain computed tomography (CT) showed a local soft tissue density mass in gastric wall (orange arrow), smooth boundary, local protrusion outside the contour of the stomach, with surrounding enlarged lymph nodes (white arrow); B: Enhanced CT showed a markedly enhanced mass (orange arrow), with surrounding enlarged lymph nodes (white arrow).
Figure 3 Coronal computed tomography.
A: Computed tomography (CT) showed a mass on the fundus of the stomach (orange arrow); B: CT showed enlarged lymph nodes around the mass (orange arrow).
Figure 4 Mass was observed on the fundus of the stomach by endoscopy and endoscopic ultrasound.
A: Endoscopy showed a smooth surface of the mass (orange arrow); B: Endoscopic ultrasonography showed a hypoechoic and heterogeneous mass, derived from mucous muscularis, with hyperechoic area (orange arrow); C: Endoscopic ultrasound guided fine needle aspiration. The bright line is the puncture needle (orange arrow).
Figure 5 Postoperative pathology.
Hematoxylin and eosin staining. A: A large number of lymphocyte aggregates and lymphoid tissue hyperplasia (40 × magnification) was observed; B: A large number of spindle cells (200 × magnification) was observed.
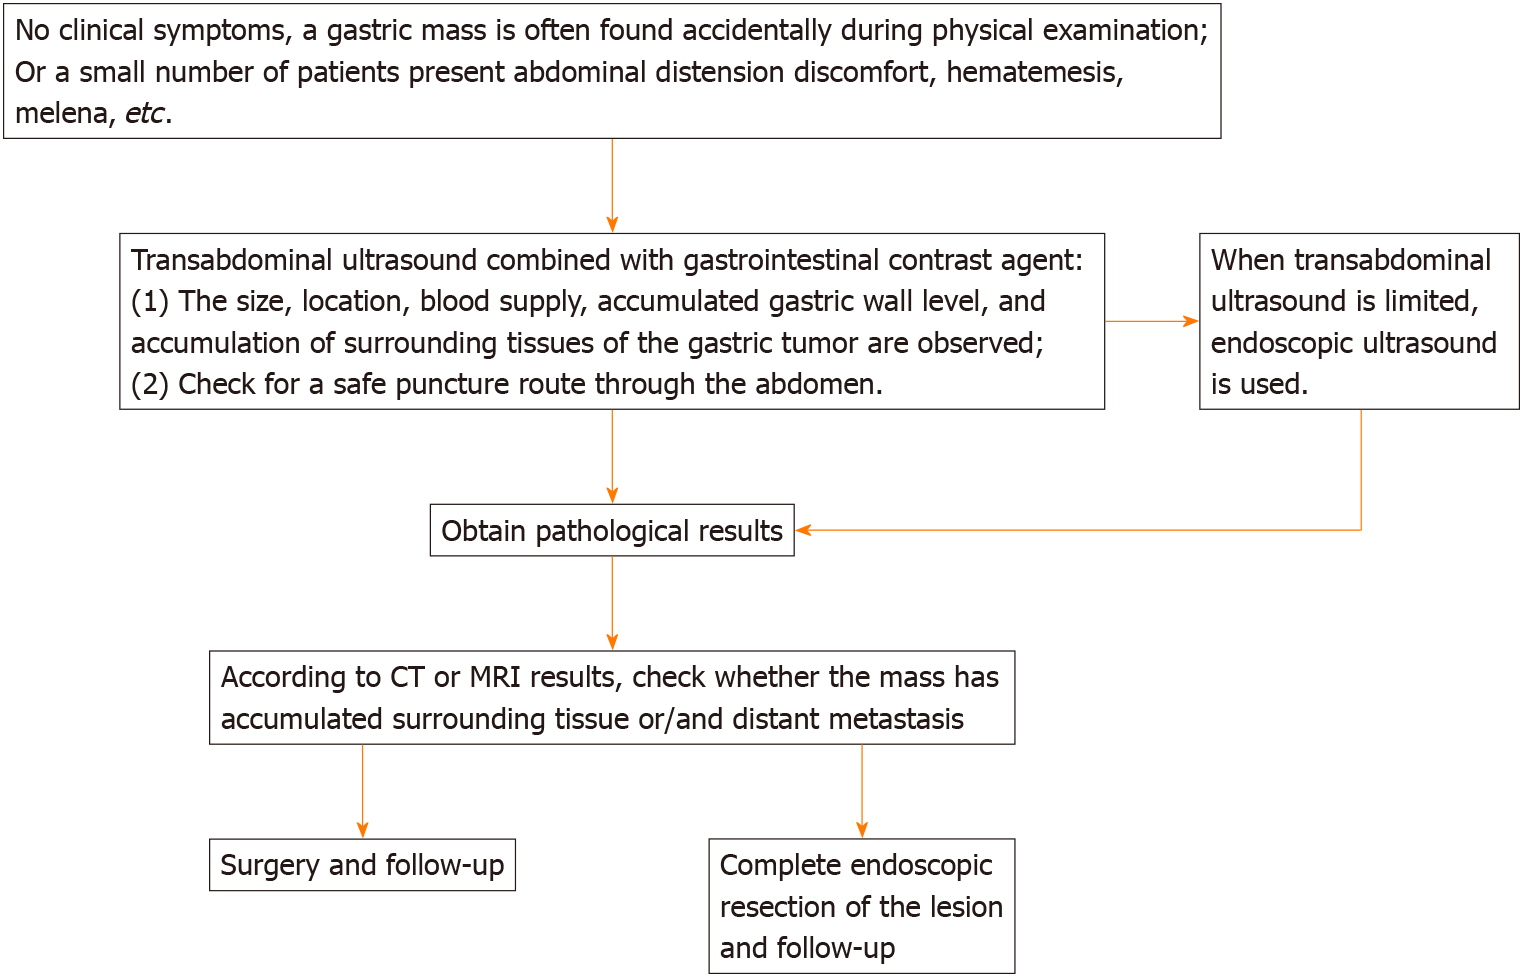
Figure 6 Procedure for diagnosis and treatment of gastrointestinal stromal tumors.
The characteristics and accumulation levels of the mass were observed under transabdominal ultrasonography or endoscopic ultrasonography. CT: Computed tomography; MRI: Magnetic resonance imaging.
- Citation: Li QQ, Liu D. Gastric schwannoma misdiagnosed as gastrointestinal stromal tumor by ultrasonography before surgery: A case report . World J Clin Cases 2022; 10(5): 1667-1674
- URL: https://www.wjgnet.com/2307-8960/full/v10/i5/1667.htm
- DOI: https://dx.doi.org/10.12998/wjcc.v10.i5.1667


